COMBINED ANALYSIS OF SENTINEL-1 AND RAPIDEYE DATA FOR IMPROVED
CROP TYPE CLASSIFICATION: AN EARLY SEASON APPROACH FOR RAPESEED
AND CEREALS
U. Lussem a*, C. Hütt a, G. Waldhoff a
a Institute of Geography, University of Cologne, Albertus-Magnus-Platz, 50923 Köln, Germany
(ulussem0, chistoph.huett, guido.waldhoff)@uni-koeln.de
Commission III, WG VIII/8
KEY WORDS: crop type mapping, Sentinel-1, RapidEye, agriculture, Support Vector Machine, Maximum Likelihood
ABSTRACT:
Timely availability of crop acreage estimation is crucial for maintaining economic and ecological sustainability or modelling purposes. Remote sensing data has proven to be a reliable source for crop mapping and acreage estimation on parcel-level. However, when relying on a single source of remote sensing data, e.g. multispectral sensors like RapidEye or Landsat, several obstacles can hamper the desired outcome, for example cloud cover or haze. Another limitation may be a similarity in optical reflectance patterns of crops, especially in an early season approach by the end of March, early April. Usually, a reliable crop type map for winter-crops (winter wheat/rye, winter barley and rapeseed) in Central Europe can be obtained by using optical remote sensing data from late April to early May, given a full coverage of the study area and cloudless conditions. These prerequisites can often not be met. By integrating dual-polarimetric sensors with high temporal and spatial resolution, these limitations can be overcome. SAR-sensors are not influenced by clouds or haze and provide an additional source of information due to the signal-interaction with plant-architecture. The overall goal of this study is to investigate the contribution of Sentinel-1 SAR-data to regional crop type mapping for an early season map of disaggregated winter-crops for a subset of the Rur-Catchment in North Rhine-Westphalia (Germany). For this reason, RapidEye data and Sentinel-1 data are combined and the performance of Support Vector Machine and Maximum Likelihood classifiers are compared. Our results show that a combination of Sentinel-1 and RapidEye is a promising approach for most crops, but consideration of phenology for data selection can improve results. Thus the combination of optical and radar remote sensing data indicates advances for crop-type classification, especially when optical data availability is limited.
* Corresponding author
1. INTRODUCTION
Timely and accurate information on crop type and crop acreage is vital for monitoring and modelling purposes at different scales. For regional modelling approaches on matter fluxes in the soil-vegetation-atmosphere system (SVA) annual data on crop types are important, to assess impacts of crop-rotations and management practices.
Remote sensing (RS) plays an important role in providing data for agricultural crop type mapping. For modelling purposes at regional scales crop-type input maps at various seasonal stages are often desired, to assess N and C in- and output at different temporal resolutions and to validate model performance (Lenz-Wiedemann et al. 2010). The use of multitemporal data from optical sensors is a common approach to derive crop type maps and usually provides better accuracies than data from microwave sensors alone. However, when relying on optical RS data, several limitations like overcast conditions (clouds, haze) or even spectral similarities of crops depending on the acquisition date may produce inadequate results (Whitcraft et al. 2015), especially in an early season approach for winter crops by the end of March, early April. As crops like cereals have similar reflectance patterns early in the season, their differentiation is often limited, until a certain stage of crop development is reached. Usually, a reliable crop type map for winter-crops in Central Europe can be obtained by using optical remote sensing data from late April to early May, when canopy closure of crops is reached, given a full coverage of the study
area and cloudless conditions (Waldhoff 2014). These prerequisites can often not be met. By integrating dual-polarimetric SAR-sensors with high temporal and spatial resolution, these limitations can be overcome. SAR-sensors are not influenced by clouds or haze and provide an additional source of information due to the signal-interaction with plant-architecture (McNairn et al. 2014).
Thus the combined analysis of optical and SAR data can improve crop classification early in the season and can be applied in case no additional optical data is available for the desired timeframe.
The overall goal of this study is to demonstrate the contribution of Sentinel-1 SAR-data to regional crop type mapping for an early season map of disaggregated winter-crops for a subset of the Rur-Catchment in North Rhine-Westphalia (Germany). For this reason, synergies of combining one RapidEye image with three dual-polarimetric Sentinel-1images are used to classify crop types at 15 meter spatial resolution in a pixel-based classification approach. This contribution is based on the Multi-Data Approach (MDA) by Bareth(2008) and Waldhoff (2014). The MDA focuses on integrating as much spatial information as there is available (multi-sensor RS data, official land use data, OpenStreetMap data etc.) to compile disaggregated land use information for regional agro-ecosystem modelling. Here we focus on the RS part of the MDA.
2. STUDY AREA AND DATA
The study area is part of the Rur-Watershed in North Rhine-Westphalia, Germany. Major land use patterns are intensive agriculture in the rather flat north-eastern parts and pasture-forage and forestry in the mountainous south-western parts of the study area. Typical winter crops grown in the study area are winter wheat (triticum aestivum) winter rye (secale cereale), winter barley (hordeum vulgare) and rapeseed (brassica napus).
Figure 1. Overview of the study area. Colour-composite of three Sentinel-1 images (see Table 1). Red polygon indicates
Rur-Watershed (Background SRTM)
For a more accurate crop type classification an additional dataset of agricultural boundaries provided by the agricultural chamber of North Rhine-Westphalia was implemented to separate agricultural land and pasture from other land use/land cover (LULC) types (Waldhoff et al., 2012).
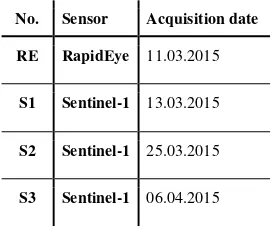
Crop type mapping was conducted using single-date multispectral RapidEye data and multi-date dual-polarimetric (VV/VH) C-band SAR Sentinel-1 data (orbit 37, incidence angle ~ 34-35°).
No. Sensor Acquisition date
RE RapidEye 11.03.2015
S1 Sentinel-1 13.03.2015
S2 Sentinel-1 25.03.2015
S3 Sentinel-1 06.04.2015
Table 1. Remote Sensing data obtained for this study
RapidEye data was radiometrically calibrated to radiance and atmospheric correction was applied using the FLAASH module in ENVI. Orthorectification was performed with the RPC-Orthorectification workflow in ENVI. The image was resampled to 15m spatial resolution and projected to WGS84, UTM Zone 32N.
Sentinel-1 Interferometric Wide Swath data was acquired in high-resolution Level-1 Ground Range Detected processing level from the Sentinel-Data-Hub website, already multi-looked (5x1) and with a pixel-spacing of 10x10 meter. Terrain correction was performed in ESA´s Sentinel-1 Toolbox/SNAP using Range-Doppler Terrain Correction module, including a calibration to Sigma nought. The images were resampled to 15m spatial resolution and projected to WGS84, UTM Zone 32N. A Gamma-MAP speckle filter with a 3x3 moving window was run twice on the SAR-data to suppress inherent speckle-noise.
All images were combined to a stacked dataset and masked using the aforementioned layer of agricultural boundaries. Although this layer provided information on permanent grassland and crops separately, both classes were combined for the assessment of discrimination between cereals and grassland, since annual types of grassland are seeded as well on permanent agricultural fields.
Independent training and testing data on crop type and development stage was gathered on several field trips during the growing season 2015.
3. METHODS
Choosing the appropriate classification algorithm is critical to classification success, thus two different classification approaches are implemented to assess their performance on the multi-source datasets. The parametric Maximum Likelihood Classification (MLC) algorithm is widely adopted, provides good results and was tested for example by Ban (2003) on optical and SAR data. As parametric algorithms draw statistical assumptions on the data, which are heterogeneous in a multisource approach, the non-parametric Support Vector Machine (SVM) algorithm was adopted as well to compare the classifier performances (Mountrakis et al., 2011; Watanachaturaporn et al., 2008).
Classification was performed in ENVI on the data-stack with different band combinations (see table 2). Since the focus of this study is on crop types, no other LULC classes were included in the classification. Training data were the same for every band-combination and classification algorithm. Because of differences in phenological development, two sub-classes per information class (winter wheat, winter barley, rapeseed, grassland, bare soil) were implemented, which were merged prior to error assessment. For each class at least 60 training-pixels were identified.
To assess the classification performance accuracies a standard error matrix was calculated with independent testing data for each classification result, including user´s accuracy (UA), producer´s accuracy (PA), overall accuracy (OA) and Kappa-coefficient (K) (Foody, 2002).
4. RESULTS
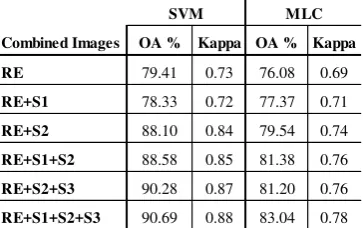
Main results of the accuracy assessment (overall accuracy and Kappa-Coefficient) are summarized in Table 2 per applied combination of image-band.
Combined Images OA % Kappa OA % Kappa
RE 79.41 0.73 76.08 0.69
RE+S1 78.33 0.72 77.37 0.71
RE+S2 88.10 0.84 79.54 0.74
RE+S1+S2 88.58 0.85 81.38 0.76
RE+S2+S3 90.28 0.87 81.20 0.76
RE+S1+S2+S3 90.69 0.88 83.04 0.78
SVM MLC
Table 2. Overall accuracies and Kappa-values for all image-combinations for SVM and MLC
As expected, the classification results of the RE data alone lead to good results, with better performance by the SVM classifier. Adding the first Sentinel-1 image into the classification process only leads to minor improvements in overall accuracies and Kappa when using the MLC, but decreases OA and Kappa for the SVM approach. By adding the second Sentinel-1 image to the RE image (without S1), accuracies are boosted by almost 10% to 88.58% using the SVM classifier, but remain below 80% using MLC. The combination of RE+S1+S2 yields almost similar accuracies like the combination of RE+S2 using SVM, but increases accuracies slightly more for MLC. Classification of all available images of the timeframe leads to the highest accuracies of almost 91% for SVM (Kappa of 0.88) and 83% for MLC (Kappa of 0.78). In general, accuracies of 85% or higher are considered reliable for mapping purposes (LANDIS & KOCH 1977).
However, examination of class-wise accuracies provides more insight into classification performance.
Figure 2. Producer´s and user´s accuracies for winter wheat for all image combinations
Accuracies for winter barley show higher discrepancies of PA and UA for both classification approaches using the RE image alone, as well as for the combination of RE+S1. Both cases can be attributed to the inclusion of winter barley-pixels into the winter wheat class (commission error of 56%). Adding the S2 image to RE, the UA for both SVM and MLC are significantly boosted (SVM from 43% to 75%), but PA declines. Classifying RE in combination with S2 and S3 finally leads to PA and UA of above 80% using the SVM classifier. For the MLC approach PA remains constantly high (around 90%) in all image-combinations, but UA could not reach a level of 80%.
Figure 3. Producer´s and user´s accuracies for winter barley for all image combinations
For winter wheat RapidEye data alone leads to acceptable results regarding PA and UA of above or almost 80% with SVM but with lower PA for MLC. Adding the S1 image could not boost the accuracies significantly. However, when combining RE and the S2 image, both UA and PA are boosted above 80% for the SVM approach, but remain almost on the same level as with RE alone for the MLC approach. The combination of all available images finally leads to accuracies of almost 90% using SVM.
Figure 4. Producer´s and user´s accuracies for rapeseed for all image combinations
For rapeseed, RE data alone leads to acceptable results using SVM, but PA and UA for MLC are only around 60%. Adding S1 leads to a decline in UA for SVM and has only little effect on MLC accuracies. Adding the S2 image boosts PA to almost 98% and UA to 80% using SVM. For the MLC approach PA is boosted to 84% and UA to 69%. Finally, when classifying all images in combination, rapeseed reaches very high accuracies using SVM.
Figure 5. Producer´s and user´s accuracies for grassland for all image combinations
Grassland reaches the highest accuracies using MLC on only the RE data with PA of 83% and UA of 81%. Adding the SAR images could not significantly improve the class-wise accuracies to an acceptable level for both measures. Although adding S2 boosts UA to 94% for SVM, PA remains at 71% and an error of omission of 29%, because grassland-pixels are included to a large amount into the winter wheat class.
Besides the four classes of emerging crops, one class for summer crop fields was introduced, which yields very high user and producer accuracies for every image combination (98-100%), since those areas consist of homogenous fields with no vegetation cover (main summer crops like maize, sugar beet or potatoes are emerging in May to June). Because of the consistent results this class is excluded from Figure 2 – 5, but is included into the overall accuracy assessment.
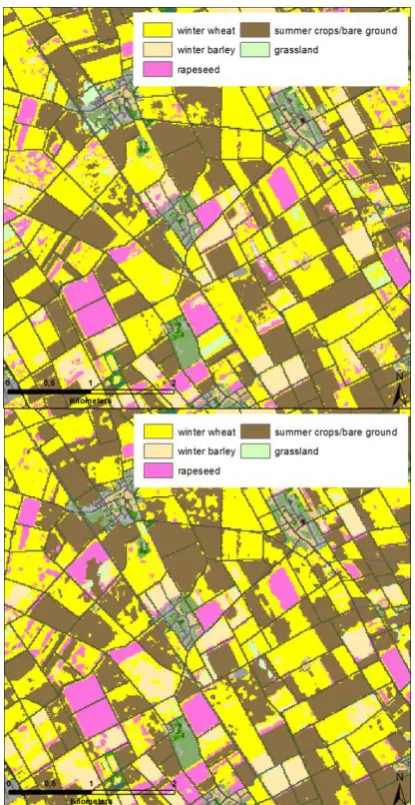
Figure 6. Subset of classification result (RE+S2+S3) for MLC (upper figure) and SVM (lower figure)
Visual comparison of both classification schemes shows a coarser speckled appearance for the SVM approach (Figure 6, lower) than for the MLC approach. There is still class-wise confusion noticeable visually, especially between winter wheat and bare ground, which might result from phenological differences.
5. DISCUSSION
As we see from the results, timing of image acquisitions remains crucial for accurately discriminating crops along the growing season, considering the phenology of observed crop types. The speckled appearance of some fields may be due to incomplete canopy closure.
The first Sentinel-1 image could not contribute well to the OA and class-wise accuracies, but adding the second Sentinel-1 image led to improved results for almost all classes. This indicates, that Sentinel-1 data is a useful addition for optical RS data in an early season multi-temporal approach.
Incrementally adding images was not found to be the optimal approach here, because by combining RE and S1 a decline of OA, Kappa and class-wise accuracies was observed. This may be attributed to the short timespan between RE and S1. Regarding the classification algorithm SVM outperformed MLC on the combined data in all instances for the OA and Kappa and for almost all class-wise accuracies. This result is consistent with the findings that SVM performs better on multi-source data (Melgani & Bruzzone, 2004; Mountrakis et al., 2011).
Discrimination of cereals and rapeseed worked well and was most likely due to their different plant structure, with cereals being more vertically orientated and thin-leafed and rapeseed being more horizontally orientated and broader leafed. This leads to different backscatter patterns in VV and VH respectively and a higher possibility for separation of these classes (Mcnairn et al., 2002; Yang et al., 2014).
Interesting are the results achieved for grassland, which were not expected, as the classification of grassland performed better in another study. This may be due to later acquisition dates on which the investigation was performed (Lussem, 2016), because in mid-March to early April grassland and cereals bear a very similar structure and size. Until the heading stage of cereals a good discrimination of grassland and cereals cannot be obtained with a C-band Sensor (Dusseux et al., 2014). Particularly interesting is the good performance of MLC for grassland, since the SVM approach shows higher errors of omission and commission.
6. CONCLUSION AND OUTLOOK
This study evaluated the combined classification of RapidEye and Sentinel-1 SAR data for early season crop type mapping in western Germany, where frequent cloud cover often hinders reliable acquisition of optical RS data. Availability of multi-temporal RS data is key for separating crop types. The start of the Sentinel-1 mission provides a rich and continuous data source for classifying crops along the growing season: Sentinel-1 data is available free of charge with a revisiting capacity of Sentinel-12 days per orbit and SAR data is not influenced by clouds or haze. This study showed, that SAR-data from Sentinel-1 can be a useful substitute if no further optical RS data is available, due to image-acquisition timing or overcast conditions. Combining Sentinel-1 and RapidEye data provides more reliable results than relying on one optical image alone for crop type mapping. However, image acquisition timing as also crucial using SAR data, as the Radar signal interacts with crop structure which is a feature of phenological development. The complementary nature of SAR-data to optical data can aid in an early season crop classification-approach for monitoring and modelling purposes.
The results indicate, that discrimination of winter crops is possible early in the growing season (mid to late March) to a certain accuracy, but integrating images of early April improves The International Archives of the Photogrammetry, Remote Sensing and Spatial Information Sciences, Volume XLI-B8, 2016
classification results. The machine learning algorithm of SVM performed better on the established multi-sensor data set. Although high overall accuracies and Kappa-coefficient, the visual comparison reveals potential for improvement.
7. REFERENCES
Ban, Y., 2003. Synergy of multitemporal ERS-1 SAR and Landsat TM data for classification of agricultural crops. Canadian Journal of Remote Sensing 29 (4), pp. 518-526.
Bareth, G., 2008. Multi-Data Approach (MDA) for enhanced land use and land cover mapping. The International Archives of the Photogrammetry, Remote Sensing and Spatial Information Sciences, Beijing, China, Vol. XXXVII. Part B8, pp. 1059-1065.
Dusseux, P., Corpetti, T., Hubert-Moy, L., Corgne, S., 2014. Combined use of multi-temporal optical and Radar satellite images for grassland monitoring. Remote Sensing 6 (7), pp. 6163-6182.
Foody, G., 2002. Status of land cover classification accuracy assessment. Remote Sensing of Environment 80 (1), pp. 185-201.
Jarvis, A., H.I. Reuter, A. Nelson, E. Guevara, 2008, Hole-filled SRTM for the globe Version 4, available from the CGIAR-CSI SRTM 90m Database (http://srtm.csi.cgiar.org). (26 Jan. 2016).
Landis, J., Koch, G., 1977. The measurement of observer agreement for categorical data. Biometrics 33, pp. 159-174.
Lenz-Wiedemann, V., Klar, C., Schneider, K., 2010. Development and test of a crop growth model for application within a Global Change decision support system. Ecological Modelling 221 (2), pp. 314-329.
McNairn, H., Decker, V., Murnagham, K., 2002. The sensitivity of C-Band Polarimetric SAR to Crop Condition. Geoscience and Remote Sensing Symposium, 2002. IGARSS ´02. IEEE International, pp. 1471-1473.
McNairn, H., Kross, A., Lapen, D., Caves, R., Shang, J., 2014. Early season monitoring of corn and soybeans with TerraSAR-X and RADARSAT-2. International Journal of Applied Earth Observation and Geoinformation 28 (1), pp. 252-259.
Melgani, F., Bruzzone, L., 2004. Classification of hyperspectral remote sensing images with support vector machines. IEEE Transactions on Geoscience and Remote Sensing 42 (8), pp. 1778-1790.
Mountrakis, G., Im, J., Ogole, C., 2011. Support vector machines in remote sensing: A review. ISPRS Journal of Photogrammetry and Remote Sensing 66 (2011), pp. 247-259.
Waldhoff, G., 2014. Multidaten-Ansatz zur fernerkundungs- und GIS-basierten Erzeugung multitemporaler, disaggregierter Landnutzungsdaten. Methodenentwicklung und Fruchtfolgenableitung am Beispiel des Rureinzugsgebiets. University of Cologne, Cologne, Germany. (http://kups.ub.uni-koeln.de/5861/)
Waldhoff, G., Curdt, C., Hoffmeister, D., Bareth, G., 2012. Analysis of multitemporal and multisensor remote sensing data
for crop rotation mapping. ISPRS Annals of Photogrammetry, Remote Sensing and Spatial Information Sciences, Vol. I-7, pp. 177-182.
Watanachaturaporn, P., Arora, M., Varshney, P., 2008. Multisource classification using support vector machines: An empirical comparison with decision tree and neural network classifiers. Photogrammetric Engineering and Remote Sensing 74 (2), pp. 239-246.
Whitcraft, A., Vermote, E., Becker-Reshef, I., Justice, C., 2015. Cloud cover throughout the agricultural growing season: Impacts on passive optical earth observations. Remote Sensing of Environment 156 (2015), pp. 438-447.
Yang, H., Li, Z., Chen, E., Zhao, C., Yang, G., Casa, R., Pignatti, S., Feng, Q., 2014. Temporal polarimetric behaviour of oilseed rape (Brassica napus L.) at C-Band for early season sowing date monitoring. Remote Sensing 6 (11), pp. 10375– 10394.