ANALYSIS ON THE CHANGING SPATIAL PATTERNS OF CHINA
’
S MIGRATION IN
1985-2010
YAN Qing-wu a, *, BIAN Zhengfu a
a
College of Environment and Spatial Informatics, China University of Mining & Technology, Xuzhou, 221008,[email protected], [email protected]
KEY WORDS: Population Migration; Population Census; Spatial Patterns; Evolutionary Trend; China
ABSTRACT:
Based on the data of China’s fourth, fifth and sixth population census, taking the seven geographical zone as research units, the Changing Spatial Patterns of China's Migration in 1985-2010 is studied by the means of spatial analysis and mathematical statistics. The empirical results show that: The migration population in China was increasing a lot in 1985-2010, and the main part of it is Provincial migration. The total number of migration, immigration and emigration, the relative proportion of inter provincial and provincial migration have been positively correlated to the regional economic development level. The emigrations from Hong Kong, Macao, Taiwan and overseas mainly moved to East and North China. Central and west of China are the main area where people outflowed from, and most migration population moved to south-eastern coastal areas. The migration in Northeast and northwest of China is still relatively small. The main direction of population migration and flowing is from west to east and from north to south.
* Corresponding author.
1. INTRODUCTION
1.1 General Instructions
Internal migration has become an increasingly significant element in the redistribution of population in China. China’s migration has attracted increasing attention from researchers. Yet the study of China’s migration suffered from a lack of reliable and consistent data prior to the 1980s. Since major market reforms and opening up, along with the rapid development of China's economy, China's population distribution undergone significant changes, China’s population has become ever more mobile. In 2013, National Bureau of Statistics (NBS) of China reported a total number of 163.4 million migrant workers who left their hometowns (NBS 2013; Ye,2014). Although a lot of literature has focused on the sharp increase of overall migration in China during the period between 1985 and 2010 (Ye,2014;Shen 2013; Fan 2005; Sandra 2006;Li 2010),very few studies have been conducted to the Changing Spatial Patterns of China's Migration.
As a result of unbalanced regional economic development and the relaxation of household registration (hukou) system, China's internal migration has grown rapidly in recent years (Fan 2005; Shen 2013;Wang 2012;Yu 2012;Ye,2014). Fan (2005) has found that the relationship between migration and unequal regional development has become stronger over time. By studying the county-level census data of 1990 and 2000, Liu(2007) analyzed the spatial and temporal changes in the floating population in China between 1990 and 2000. He found that the number of floaters increased rapidly during this period, and the area in which the floaters settled expanded
quickly into four population explosion belts: the coast, the Changjiang River Delta, the Beijing-Guangzhou Railway and national border belts. By using the coefficient of variation (CV) indices of out- and in-migration flows for each province, He(2002) found that China’s interprovincial migration has resulted from an interplay of several factors, such as the uneven distribution of the economy, inflow of trans-national capital into pockets of its provinces, and relaxed control over rural-to-urban migration. Liu(2012) found that China’s migration remains the same, even stronger trend with migration direction from mid-belt including Sichuan, Hunan, Jiangxi, Henan and Anhui to east developed belt especially including the Peal River Delta, Yangtze River Delta and Jingjintang Delta. Cai(2007)discusses the driving forces and types of migration in China, and forecasts migration trends and changes in spatial patterns of migration. Nevertheless, most previous studies of China’s migration patterns and determinants have only examined overall aggregate migration, which may mask substantial variations in spatial patterns.
This paper investigates how China’s migration volumes, spatial patterns have changed between 1985 and 2010 using data from successive censuses. In particular, taking the seven geographical zone as research units, we focus on spatial and temporal changes in China’s migration flows. This paper advances our understanding of China’s migration through a detailed examination of the most recent migration trends and a systematic account of migration patterns of the seven geographical zone.
The structure of the paper is as follows. The next section provides a brief account of data used in the analysis. This is followed by two sections using global migration indicators to analyse propensities, patterns of overall migration. Finally, the paper concludes with a
The International Archives of the Photogrammetry, Remote Sensing and Spatial Information Sciences, Volume XL-2, 2014 ISPRS Technical Commission II Symposium, 6 – 8 October 2014, Toronto, Canada
This contribution has been peer-reviewed.
summary of key findings and a discussion of the possible future trends in China’s migration.
2. STUDY AREA, DATA SOURCES AND PROCESSING
Statistical data is the basis of population migration studies. The data used in the analysis come from published tabulations of three rounds of population censuses conducted by NBS in 1990, 2000, and 2010 respectively. China’s census has been widely considered as the most authoritative and reliable sources of data for studying migration (Liu 2014; Shen 2013). The three rounds of census covered the whole population, counting 1130.5 million in 1990, 1242.6 million in 2000 and 1332.8 million in 2010. The Censuses used along-form (for 10 % samples) sampling strategy. Therefore, each migration flow given in the tabulations of the Censuses must be multiplied by 10.
In China’s census, a migrant is defined as a resident who had stayed in his/her usual place of residence for more than 6 months or 1 year, who had lived in a different usual place of residence 5 years ago and who was aged five or older at the time of enumeration. We only consider interprovincial migration in this paper to ensure that migration data from different censuses are comparable.
Since we have no migration data of Hong Kong, Macao and Taiwan, the following study area only includes 31 provinces of the mainland. In order to study the regional distribution of China’s migration, the study area is divided into seven geography zone, that is North China, Northeast China, East China, Central China, South China, Southwest China, Northwest China. North China consists of Beijing, Tianjin, Hebei, Shanxi, Inner Mongoria. Northeast China includes Heilongjiang, Jilin, Liaoning. East China contains Shanghai, Jiangsu, Zhejiang, Anhui, Fujian, Jiangxi, Shandong. Central China consists of Hubei, Hunan, Henan. South China comprises Guangdong, Guangxi, Hainan. Southwest China consists of Chongqing, Sichuang, Guizhou, Yunnan,Tibet. Northwest China contains Shaanxi, Gansu, Ningxia, Qinghai, Xinjiang. The map of seven geography zone of China are the flowing.
Figure 1. The distribution of seven geography zone in China
3. GENERAL CHARACTERISTICS OF CHINA’S MIGRATION consider interprovincial migration in this paper to ensure that migration data from different censuses are comparable.
China has experienced a dramatic increase in interprovincial migration in 1985-2010 and the main part of it is Provincial Migration. The 1990 Census documented a total of 34.128million migrants in the 1985
–1990 period, accounting for 3.02 % of the total population. Thereafter, with the reacceleration of economic reform and the gradual relaxation of the hukou system, the number of migrants increased
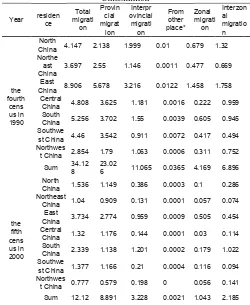
rapidly by nearly three times to 119.893 million for the 2000–2010 period (8.90 % of the total population) . Provincial migration occupies the main part of China’s migration and the ratio increased a lot in the past 30 years. In 1990 the ratio is 67.47%, and it reaches 73.35% and 95.39% respectively in 2000 and 2010. The interprovincial migration is made up by zonal migration and interzonal migration, the ratio of them is steady in the past years. Table 1 shows that the ratio of interzonal migration in interprovincial migration rose steadily from 62.33% in 1985–1990 to the peak 67.69% in 1995– 2000 and then decreased slightly to 67.34% in 2005– 2010.
Table 1 the constitution of China’s migration in 1985-2010 Units:million
The International Archives of the Photogrammetry, Remote Sensing and Spatial Information Sciences, Volume XL-2, 2014 ISPRS Technical Commission II Symposium, 6 – 8 October 2014, Toronto, Canada
This contribution has been peer-reviewed.
Year residen
*From other place refers in-migration from Hong Kong, Macao and Taiwan and other counties.
The total number of migration, immigration and emigration, the relative proportion of inter provincial and provincial migration have been positively correlated to the regional economic development level. Against the background of the widening regional disparity interzonal migration has substantially increased over the past quarter of a century.During the study period, about 25% migration moved to East China. The coastal regions such as South China, East China have increasingly benefited from inflows of migration, and the gap of net migration balances between the coastal regions and the interior has been widening.
4. CHANGING SPATIAL PATTERNS OF INTERPROVINCIAL AND INTERZONAL MIGRATION
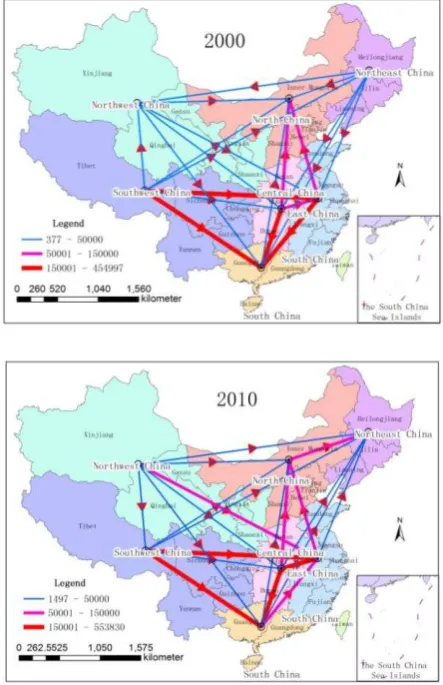
Net migration has become an increasingly effective factor for population redistribution. In order to identify some of the key patterns of migration taking place at the zonal scale and how they have changed over time, three map of the three census’s net migration flow between the seven geography zone is drawn as the flowing.
Figure 2. Net migration flow of the three censuses
There are 21 net migration flow among 7 geography zones. From above three maps, we can see that the number of net migration flow which is smaller than 50000 rose between 1985-2010, and the bigger one is falling down. That is say the net migration streams relatively dispersed in 1985– 1990.It is worth mentioning that net migration flow was balanced in this period and that several net migration streams were accompanied by large counter streams (e.g. Southwest China→South China, Southwest China→East China, Southwest China→North China, Southwest China→Central China). That implies Southwest China is the main Origin of migration and the coastal region is the main destination of in-migration. Net migration flows tended to be considerably larger in 1995
– 2000 and 2005-2010, eastward and southward migration flows became more profound than other flows. Net migrants flow were more concentrated in a few destinations. The major net migration streams were toward coastal zones, such as East China, Southeast China. Net migration streams among Northeast China and Northwest China is relatively small in size. This showed a positive correlation between economic development and volume of net migration. The region which has the high level of economic development maybe net migration destination, and the low one always be the net out-migration area.
The International Archives of the Photogrammetry, Remote Sensing and Spatial Information Sciences, Volume XL-2, 2014 ISPRS Technical Commission II Symposium, 6 – 8 October 2014, Toronto, Canada
This contribution has been peer-reviewed.
5. CONCLUSION AND DISCUSSION
In this paper we described the patterns of the interzonal migration streams for the 1995–2000 period. We can draw some conclusion. In 1985-2010, the migration volume of China was increasing a lot and the main part of it is Provincial migration. The total number of migration, immigration and emigration, the relative proportion of inter provincial and provincial migration have been positively correlated to the regional economic development level. The emigrations from Hong Kong, Macao, Taiwan and overseas mainly moved to East and North China. Central and west of China are the main area where people outflowed from, and most migration population moved to south-eastern coastal areas. The migration in Northeast and northwest of China is still relatively small. The main direction of population migration and flowing is from west to east and from north to south.
ACKNOWLEDGEMENTS (OPTIONAL)
This paper is based on research funded by the plan of National Statistical Science Project 2012LY186
REFERENCES
References
[1]Cai J, Wang G, Yang Z.Future Trends and Spatial Patterns of Migration in China[J]. Population Research. (In Chinese) [2]Fan C C. Modeling Interprovincial Migration in China, 1985-2000[J]. Eurasian Geography and Economics,2005, 46(3):165 -184.
[3]Liu C., Otusbo K., Wang Q.,etc.Spatial and Temporal Changes of Floating Population in China Between 1990 and 2000[J]. Chinese Geographical Science,2007,17(2): 99–109. [4]Liu W.,Wang L.,CHEN Z. Flow Field and Its Regional Differentiation of Inter- provincial Migration in China[J]. Economic Geography, 2012,02:8-13. (In Chinese)
[5]Liu. Y., J. Stillwell and J. Shen, etc. Interprovincial Migration, Regional Development and State Policy in China, 1985–2010[J]. Appl. Spatial Analysis, DOI 10.1007/s12061-014-9102-6 Published online,2014.
[6]LI Y., LIU H. Research Progresses on Migration Spatial Structure Modeling[J]. Progress in Geography,2010,10:1162-1170.(In Chinese)
[7]Shen, J. Increasing internal migration in China from 1985 to 2005: institutional versus economic drivers[J]. Habitat International, 2013,39(1), 1–7.
[8] Sandra P. Provincial migration dynamics in China: Borders, costs and economic motivations[J]. J. Regional Science and Urban Economics, 2006,36:386-398.
[9]Wang G.,Pan Z.,Lu Y. China’s Inter-Provincial Migration Patterns and Influential Factors: Evidence from Year 2000 and 2010 Population Census of China[J].Chinese Journal of Population Science, 2012,05:2-13+111. (In Chinese)
[10]Yu W., Pu Y., Chen G., etc. Spatial Analysis of the Patterns and Mechanism of Inter-provincial Migration Flows in China[J]. Geography and Geo-Information Science, 2012,02:44-49.
The International Archives of the Photogrammetry, Remote Sensing and Spatial Information Sciences, Volume XL-2, 2014 ISPRS Technical Commission II Symposium, 6 – 8 October 2014, Toronto, Canada
This contribution has been peer-reviewed.