FROM THE CONTINUOS TO THE DISCRETE MODEL:
A LASER SCANNING APPLICATION TO CONSERVATION PROJECTS
A. Cardaci a,G. Mirabella Roberti b, A. Versaci c
a Faculty of Engineering – University of Bergamo, 24044 Dalmine, Italy - [email protected] b Faculty of Engineering – University of Bergamo, 24044 Dalmine, Italy – [email protected] c
Faculty of Engineering and Architecture – University Kore of Enna, 94100 Enna, Italy – [email protected]
KEY WORDS: Architecture, Culture Heritage, Laser scanning, Survey, Restoration, Finite element method
ABSTRACT:
This paper aims to demonstrate the usage of laser scanning (in particular through a methodology based on the integrated use of the software “FARO© Scene” and “GEXCEL JRC-3D Reconstructor”) as a valid alternative to traditional surveying techniques, especially when finalized to the restoration and conservation repair of historical buildings. The need to recreate the complex and often irregular shapes of the ancient architecture, by acting quickly and also being accurate, as well as the subsequent implementation of FEM (Finite Element Method) for structural analysis, have made nowadays the laser scanning survey a very useful technique. The point cloud obtained by laser scanning can be a flexible tool for every need; not a finished product, but a huge database from which it is possible to extract different information at different times. The use of numerical methods in data processing allows wide opportunities of further investigations starting from the fitting equations. The numerical model lends by itself to the possibility of usage in many applications, such as modelization and structure analysis software. This paper presents the case study of the Church of the Assumption and Saint Michael the Archangel, located in Borgo di Terzo (Italy), a magnificent 18th century’s building that presented several structural problems like as the overturning of the façade, the cracking of part of the vaulted ceiling. The survey, carried out by laser scanner (FARO© Photon 120) allowed the reconstruction of the exact geometry of the church, offering the basis for performing structural analysis supported by a realistic model (and not an idealized regular one), useful also in the design of repair interventions.
RÉSUMÉ:
Ce travail se propose de démontrer l’opportunité d’utiliser le laser scanning en tant qu’efficace alternative aux techniques traditionnelles de relevage (notamment à travers une méthodologie basée sur l'utilisation intégrée des logiciels FARO© Scene et GEXCEL JRC-3D Reconstructor); cela, surtout dans le cadre du projet de restauration et de réhabilitation des bâtiments historiques. La nécessité de recréer les formes complexes et souvent irrégulières qui caractérisent généralement les bâtiments anciens, tout en agissant rapidement et étant même très précis, ainsi que la nécessité de mettre ensuite en œuvre la FEM (modélisation par éléments finis) pour le calcul des structures, ont fait aujourd’hui du relevé laser la technique la plus appropriée. Le nuage de points 3D est un outil flexible pour tous les besoins: non pas un produit fini, mais une énorme base de données dont extraire de nombreuses informations à tous moments. L’utilisation d’une méthode numérique pour le traitement des données, offre vastes possibilités dans le traitement des informations à partis de leurs équations. Le modèle numérique se prête à des nombreuses possibilités d'emploi dans plusieurs applications, comme le très versatile MIDAS. Ce travail présente une étude du cas relatif à l'Église de l'Assomption et de Saint Michel Archange, située à Borgo di Terzo en Italie, imposante construction du 18ème siècle, qui présente plusieurs problèmes structurels: le renversement de la façade, la présence de fissures sur une partie de la voûte de couverture. Le relevé laser, effectué avec le FARO© Photon 120 a permis de retrouver et représenter la géométrie exacte de l'église, ainsi permettant le calcul des structures à partir d’un modèle réel (et non pas d’un modèle idéal), avec les évidents avantages que comporte une telle procédure.
1. INTRODUCTION
1.1 Laser Scanning and structural application
This work aims to demonstrate the opportunity of using laser scanning as a better alternative to the traditional surveying techniques, focusing on its useful application in restoration and conservation design. The often irregular shapes of ancient buildings and the need to reconstruct their exact geometry for structural verifications make the laser scanning survey a very appealing technique. The point cloud produced by laser scanning become a flexible tool for many different need; not a finished product, but a huge database, a source from which is possible to extract different information at different times. A traditional approach would require a preliminary and a priori choice of the survey’s characteristics, engendering strong consequences in the restitution phase (the target positioning, the setting of cross sections to be extracted). On the contrary, laser scanning allows multiple choices in the post-processing elaboration. Handling the huge amount of metric data resulting from a 3D laser scanning survey (Fig.01), is a matter of concern for operators, particularly when they intend to use them for an implementation in the field of structural calculation. A first quantitative verification of the results is immediately possible thanks to the inspection function of the software (FARO© Scene) for point clouds processing. For instance, a 3D color display (Fig.02) obtained from the comparison of two scans (before and after loading) gives useful indication about the magnitude of the structure displacements, view in all its spatial complexity. More detailed study are possible following either a graphical or an analytical approach based on filtering and interpolation from point clouds to polynomial curves. The graphical approach is the most common technique in the field of Restoration, that uses for the building analysis the methods of architectural design (Fig.03). The systematic study of the overall description of the cracking pattern, for example, is done trough the redrawing of damages on the orthographic projection. On this basis, it is possible for instance to compare ideal and real geometry of a deformed vault, as a consequence of its own weight.
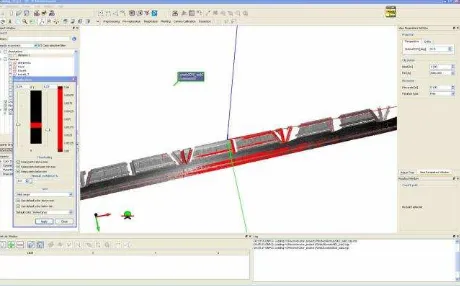
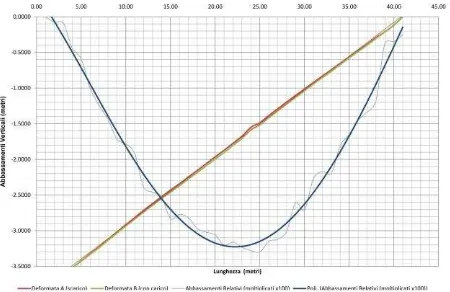
The analytical approach is otherwise much more appropriate for the numerical calculations and conversion of the point cloud into a mathematical model. The analytical method allows for a simplification of point clouds by fitting equations with a remarkable reduction of computation time. Several millions of 3D points are so transformed into systems of equations controlled by few variables representing curves in the 3D space. The results of a load test carried out on a inclined beam belonging to a wooden roof is shown (Fig.04). The first inspection test made by the software GEXCEL JRC-3D Reconstructor aimed to give a first indication on the maximum value of deflection and its location. The subsequent data processing, made by the graphical approach and its exportation into CAD system, is shown with the only purpose of make a comparison with the analytical approach (Fig.05-06). The beam profiles are shown (before and immediately after loading) in order to measure the vertical deflection of the beam axis. The deflection curve is obtained by the interpolation of a polynomial equation. The Y axis scale factor is multiplied by 100, in order to highlight the deformation trends more easily. It is important to notice that through the analytical solution small mistakes may occur, because the curve does not intercept exactly all cloud points but it deviates from them by an average error. It is therefore necessary to carry out a verification of the polynomial approximation, through some control points chosen at regular intervals (Fig.07).
Figure 01. The laser scanner used for this survey: the Photon 120 produced by the German company FARO© Europe
Figure 02. Structure with indication of spatial displacement under applied loan
Figure 03. Crack representation on the vault
Figure 04. GEXCEL JRC-3D Reconstructor’s visualization of the structural beam deflection
Compared to other surveying techniques, 3D laser scanning system is faster, more accurate and precise. Moreover, the digital surveying methodology makes it more convenient, due to the simplicity of operation and the reduction of measurement time, the 360-degree data acquisition. Actually, the point cloud is to be considered as a database of spatial information, in which each point has the same degree of precision. It is therefore possible to “question” the points cloud not only for the study of one single beam (as it is feasible by means of a total station), but also for checking structural displacements and deflection of the other beams of the roof, automatically and simultaneously recorded (Fig. 08).
2. THE CHURCH OF THE ASSUMPTION AND SAINT MICHAEL THE ARCHANGEL IN BORGO DI TERZO
2.1 Historical notes
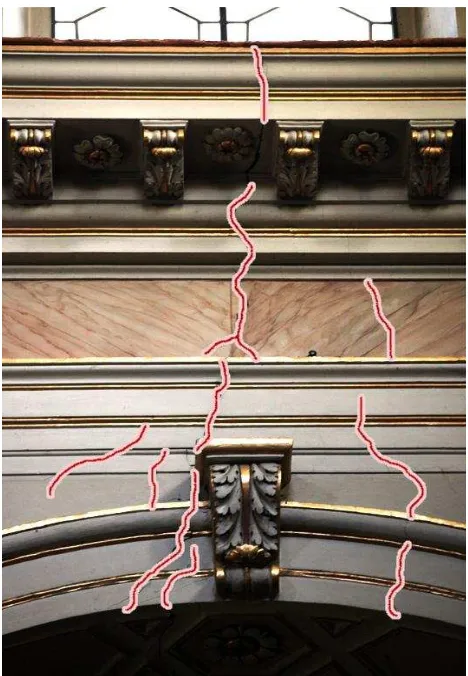
Borgo di Terzo is a small village located in the Val Cavallina, near Bergamo, in Northern Italy (Fig.09). At its heart is located the imposant Church of the Assumption and Saint Michael the Archangel, consecrated in 1735 (as engraved on the right pilaster of the main façade portal) but built upon the remains of an earlier church demolished because of its small size. Next to it stands the so-called church of ”Disciplini”, dating from the 14th century and now disused, and between them a courtyard, once an ancient cemetery; some interesting graves have been found under the floor of the nave. The current neoclassical aspect of the façade, characterised by two overlapping orders with triangular pediment and a sandstone central mullioned window, dates from after the restoration and embellishment works carried out between 1843 and 1855 (Fig.10). In 1928, an intervention aimed to consolidate the façade was undertaken. Nowadays, the church is subject to a rollover of the front and shows a significant crack pattern (Fig.11).
2.2 The survey
The survey activities have been carried out in one day; three stations have been established to obtain as many point clouds (one for the apse, a second for the nave and a third for the nave vaults) as needed for covering the overall church interiors (except for some small shadow cones) The cloud related to the nave is characterised by an higher noise, due to the fact that scan has been carried out with the instrument placed on an aerial support, not completely stable and subject to vibrations (Fig.12). For this reason, it has been used in a limited way. It has been necessary to take into account, problems related to the registration of single scans, in order to limit the error within a tolerance of the same order of magnitude as the measuring instrument.
Figure 09. Borgo di Terzo – Ancient cadastral map (1853) Figure 05. Analytical Processing: displacement plot
Figure 06. Graphical Processing: displacement profile
Figure 07. Relative displacement interpolation
Figure 08. The polynomial approximation and through control points chosen at regular intervals
Figure 11. Crack of an arch to the overturning of the façade
Figure 12. Scanning operations Figure 10. The church: the façade and the interior
The integrated use of two software, the FARO© Scene and the GEXCEL JRC-3D Reconstructor made it possible to get a good overlap of the scan without using a total station. A preliminary data processing has been performed by the software FARO© Scene. This first filtering of single range scan has permitted to reduce by 40% the size of raw data files (Fig.13).
Automatic recognition of fixed targets also allowed the registration of scans in a very short time and without operator’s intervention. A subsequent data processing made by GEXCEL JRC-3D Reconstructor, has finally allowed scan alignment and geo-referencing with respect to a unique reference system, as well as a refinement of the scan records. GEXCEL JRC-3D Reconstructor is based on an advanced form control algorithm that has allowed the overlapping of each scan with a range of tolerance range less than 1 cm. For the purpose of a better use of the algorithm, one of the point clouds has been chosen as reference scan, to keep fixed in the space, and all the others have been roto-translated over it. Greater precision would have been possible by recording scans through the coordinates of some point measured with a total station. However, the precision improvements would not be sufficient to justify time-requirement connected to the placement of fixed targets and the establishment of a topographic support network.
The overlapping of the point cloud onto a pre-existing survey (carried out by the direct method) highlighted several mismatches (Fig.14-15). The direct survey method is strongly influenced by the interpretive approach of the operator that has made a simplification of the complex geometry of the building, representing it as a modular space (symmetric, orthogonal and founded on a single axis). Without any doubts the 3D digital survey is more objective, because it is automatically carried out by the laser scanner. Survey conducted by laser scanner has differently highlighted clear alignment mismatches and a non-orthogonal configuration of the church.
2.3 The model discretization
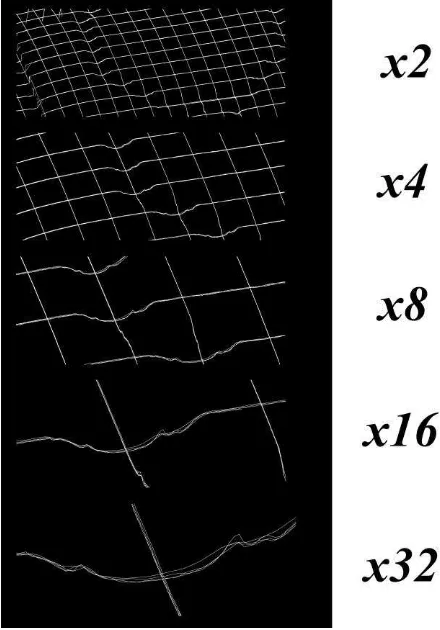
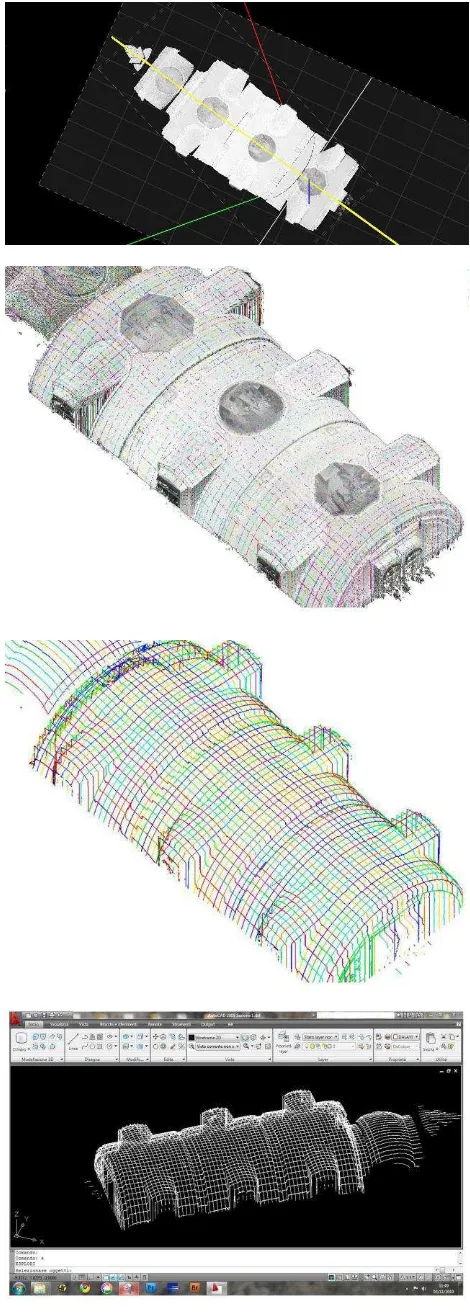
The continuous model, made up by millions of points, is a source of knowledge only when properly questioned. Excessive information, if not structured and correctly organized, causes the same inconvenience of the lack of information. We need then further elaboration to make use of the acquired metric data: the points cloud has actually to be transformed from a nearly-continuous model into a discrete numerical model (Fig.16). This latter can then be considered as a reduced and simplified version of the continuous model, obtained by discretizing only some of the available data, chosen by the operator in an intelligent but arbitrary way. An automatic scanning system allows to quickly capture more data than those actually needed. The numerical model is based on the discretization of the points cloud in a computational domain composed by elementary points arranged in a regular matrix. A further simplification arises from the choice of the cross section planes, orthogonal to each other, from which measures are needed. The discretization of the points cloud is then made by cross-sections cut at regular intervals (30×30×30cm) is a good compromise in view of the subsequent structural applications in order to define significant parts of the geometry. The cross sections, besides being created in an automatic manner, can be chosen in an arbitrary way by the operator; there is also the opportunity to densify the grid where discontinuities are more important and/or space it out when the geometry is more regular. The point cloud, so simplified to a grid of spatial curves perpendicular to each others, is not yet a numerical model suitable to be exported in a structural calculation system (Fig.17). The final step needs a data interpolation, in order to transform simple polylines in
Figure 13. The church: the complete point cloud
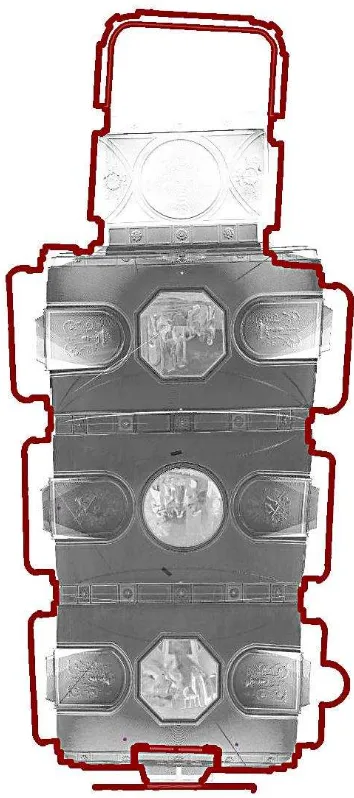
Figure 14. Survey and ortophoto of the roof vault
spatial lines defined by polynomial equations. The treatment of numerical data allows for a great number of opportunities in information processing, starting from the so obtained equations.
2.4 Strengthening intervention
The cause of the observed damage must be almost certainly found in a settlement of the wooden roof structure (probably due to the restoration made in 20th century that involved the tie of one truss and the extrados of the vault) that rested on the vault causing a strong deflection and seriously damaging the underlying masonry vault. Finite Element Analysis was aimed to evaluate actual stress distribution in the vault (in the deformed shape obtained from the survey) and to verify the new distribution after the proposed strengthening intervention. The FEM analysis in the existing conditions suggested to proceed in reconstructing the supports until the buttresses, that are built in correspondence of the ties, by means of a top beam in reinforced masonry (that act as a restraint for horizontal displacements and can redistribute possible thrusts on the walls). In addition, only a strengthening of the intermediate arch was foreword, using lime mortar with a steel net.
Moreover, being the interventions small and local and aiming to improve the static behaviour of the vault, in a seismic analysis the strengthening do not involve a significant variation of the global response to horizontal actions, because the total mass do not varies and the interventions are compatible with the original stiffness.
In particular, the model focused on the behaviour of the intrados of the vault, the part in compression from the haunch level to the keystone. The analysis has been performed trough the software “MIDAS-Gen”, on the basis of the geometry obtained by the laser-scanning survey; plate-shell elements were used for the vault and truss elements for steel ties.
The two models differ for different boundary conditions for masonry ribs at the extrados (restraint after the masonry top beam placement), for different thickness of the elements (after the strengthening with the mortar) and the reconstruction of the rib on the back of the vault.
The usage of the true deformed geometry under load action allowed to observe that the extrados tie appeared at the moment inactive. This suggested a reactivation of the tie by means of a steel bar connected to the wooden beam. The new model for the strengthened vault, where the proposed intervention were added to the existing FEM model, showed a general improvement of the overall structure.
The two models take into account the difference between the intrados obtained by the survey and the mean surface of the masonry vault, shifting with adequate offset finite element geometry. The knowledge limited only to the geometry of the vault, and not extended to material properties and exact thicknesses of the different parts, allowed only to represent the structure as homogeneous continuous material.
3. CONCLUSION REMARKS
The laser scanning technique and its application in the different fields of architecture and engineering is without any doubts in a process of on-going developments and updates. Its use in the context of cultural heritage restoration appears of great interest and certainly emblematic of the possibilities offered by such tools, not only in terms of metric data acquisition, but also for what concerns the representation and visualization of architectural objects and their contextualization in the territory.
Figure 15. Differences between the survey and the point clouds
Figure 16. Registration at different magnification error of range scans
The need to reduce even more the time devoted to survey operations and other data acquisition activities for architectural heritage (generally quite complex both from formal and geometric point of view) maintaining, at the same time, a considerably high precision; and also, the high quality and effectiveness of aesthetic representation requested, have made nearly compulsory the use of such procedures to integrate and support traditional techniques. The data acquisition and processing however must be carried out adopting appropriate methods, able to take into account the specificities of each surveyed object.
The work here presented has been conceived following these criteria, with the objective of building an example for evaluating the effectiveness of the new survey approach offered by 3D laser scanners, still in a process of continuous experimentation. Despite the recent literature does not often refer to the scan registration without targets, the scientific research is developing new solutions for the scans alignment based on other techniques. The interest will be focused on using different software for reducing time and detection operations, exploiting the acquisition speed of modern scanners that can make faster the deletion of unnecessary parts of the points cloud in the subsequent phase of data treatment, rather than a preliminary accurate definition of "windows" for data acquisition
ACKNOWLEDGEMENTS
The authors thank the FARO© Europe GmbH & Co, and in particular Mr. Bernd-Dietmar Becker, Director of Product Management & Business Development 3D-Laser-Scanner, for having made available the Laser Scanner Photon 120, in the framework of the Research Convention established between the Faculty of Engineering of University of Bergamo and FARO© Europe.
A special thanks goes to prof. Paolo Riva, dean of Engineering Faculty of Bergamo and to Ing. Massimo Oldrati, Oldra.eng s.r.l., for its helpful assistance in this work.
REFERENCES
Bartolucci, D. (2009). Principi di laser scanning 3D: hardware, metodologie applicative, esempi. Palermo: Dario Flaccovio.
Bini, M., Battini, C. (2007), Nuove immagini dei monumenti fiorentini. Firenze: Alinea.
Carbonara, G. (2008). Trattato di restauro architettonico. Secondo Aggiornamento. Grandi temi di restauro. Torino: UTET.
l’architettura e il territorio. Firenze: Alinea.
Vassena, G., Sgrenzaroli, M. (2007). Tecniche di rilevamento tridimensionale tramite laser scanner. Brescia: Starrylink.
Guidi, G., Russo, M., Beraldin, J.A (2010). Acquisizione e modellazione poligonale, McGraw-Hill.
Birn, J., (2006). Digital Lighting and Rendering. Berkley, New Riders.
Figure 17. From point clouds to CAD model
Figure 18b. FeM after consolidation (addition linkage)
Figure 19b. Compression at the intrados after consolidation
Figure 20b. Compression at the extrados after consolidation
Figure 21b. Development of compression after consolidation
Figure 22b. Especially of arch after consolidation Figure 18a. FeM before consolidation (absence linkage)
Figure 19a. Compression at the intrados before consolidation
Figure 20a. Compression at the extrados before consolidation
Figure 21a. Development of compression before consolidation
Figure 22a. Especially of arch before consolidation