TOWARDS RULE-GUIDED CLASSIFICATION FOR VOLUNTEERED GEOGRAPHIC
INFORMATION
Ahmed Loai Ali1,3, Falko Schmid1,2, Zoe Falomir1, Christian Freksa1,2
1
Cognitive Systems Research Group, University of Bremen, Bremen, Germany 2
SFB/TR 8 Spatial Cognition, University of Bremen, Bremen, Germany 3
Information System Department, Faculty of Computers and Information, Assuit University, Assuit, Egypt {loai, schmid, zfalomir, freksa}@informatik.uni-bremen.de
Commission II, WG II/4
KEY WORDS:Volunteered Geographic Information (VGI), Spatial Data Quality, Spatial Data Mining, Classification
ABSTRACT:
Crowd-sourcing, especially in form of Volunteered Geographic Information (VGI) significantly changed the way geographic data is collected and the products that are generated from them. In VGI projects, contributors’ heterogeneity fosters rich data sources, however with problematic quality. In this paper, we tackle data quality from aclassificationperspective. Particularly in VGI, data classification presents some challenges: In some cases, the classification of entities depends on individual conceptualization about the environment. Whereas in other cases, a geographic feature itself might have ambiguous characteristics. These problems lead to inconsistent and inappropriate classifications. To face these challenges, we propose a guided classification approach. The approach employs data mining algorithms to develop a classifier, through investigating the geographic characteristics of target feature classes. The developed classifier acts to distinguish between related classes likeforest, meadowandpark. Then, the classifier could be used to guide the contributors during the classification process. The findings of an empirical study illustrate that the developed classifier correctly predict some classes. However, it still has a limited accuracy with other related classes.
1. INTRODUCTION
The advance of Web technologies (e.g. Web 2.0) and the in-creasing availability of hand-held location sensing devices (e.g. smart phones) empower the public to participate in mapping ac-tivities. Those activities, which were formerly conducted by map-ping agencies and cartographers, now attract volunteers. Collab-orative mapping is one form ofVolunteered Geographic Infor-mation(VGI), when a group of volunteers acts to collect, share, maintain, and use information about geographic features (Good-child, 2007). Among others, OpenStreetMap1(OSM), Google Mapmakers2and Wikimapia3are examples of collaborative map-ping projects which aim to produce a digital map of the world. During the last decade, VGI has played a significant role in the GIScience community. Various applications and services have been developed based on VGI data including – but not limited to – environmental monitoring, crisis management, urban planning, mapping services, etc.
Despite of the increasing dependency on VGI data, its question-able quality results – in some cases – in limited use (Elwood et al., 2012). Among other things, the lack of detailed information about data quality and the difficulty of applying traditional spa-tial quality measures for assessing the data are key reasons behind its questionable quality (Flanagin and Metzger, 2008, Elwood et al., 2012). Generally, multiple measures are used to describe the quality of spatial data from different perspectives such as com-pleteness, positional accuracy, thematic accuracy, logical consis-tency, and lineage. In this paper, we tackle the quality from a classification perspective. Classification is one facet of data qual-ity that influences thematic accuracy.
1www.openstreetmap.org 2www.google.com/mapmaker 3www.wikimapia.org
In most VGI projects, a large amount of data is contributed re-motely by tracking satellite images. The contribution method itself poses a classification challenge: whether a piece of land covered by grass is classified aspark, garden, meadow, orgrass, if a water body classified aspondorlake– the classification an-swers to these questions mainly depend on contributors’ perspec-tives and need some sense of locality. Moreover, some classes are semantically related (e.g.,parkorgarden), while others have ambiguous characteristics (e.g.,grass). Hence, in such cases an entity could be inappropriately classified resulting in problematic quality.
In this paper, we present an approach for rule-guided classifica-tion aiming to improve the quality of VGI data. The approach consists of two phases:LearningandGuiding. During the Learn-ingphase, the task is to learn the unique geographic character-istics that distinguish between related classes. Learning mainly depends on topological investigation of classes. During learning, data mining algorithms are applied to extract the characteristics of specific classes in form of a set of predictive rules. Based on the extracted rules, a rule-based classifier is developed that guides the contributors, during theGuidingphase, towards the most ap-propriate classes.
The paper is organized as follows: Section 2 presents a literature review of VGI data quality. Section 3 gives insight into the main factors behind the heterogeneous classifications in VGI data. Sec-tion 4 presents the proposed approach and its phases. SecSec-tion 5 presents an empirical study. The last section outlines the conclu-sions and the current state of the work.
2. VGI DATA QUALITY
In VGI, particularly in collaborative mapping, contributors act as sensors to collect, update, and share information about ge-ographic features. VGI employs the contributors’ locality and their willingness to contribute in order to produce rich spatial data sources (Goodchild, 2007). However, the quality of the re-sulting data is heterogeneous. With increasing utilization of VGI in GIScience activities and applications, data quality becomes a concern of highest priority (Flanagin and Metzger, 2008, Elwood et al., 2012).
VGI data is evaluated either by comparison with authoritative data or by intrinsic analysis following crowd-sourcing, social, or geographic approaches (Goodchild and Li, 2012). (Girres and Touya, 2010, Haklay, 2010, Neis et al., 2011, Jackson et al., 2013) compare VGI data against authoritative data sources in France, UK, Germany, and USA, respectively. They emphasize the quality of VGI data particularly in urban areas. In (Hecht and Stephens, 2014), authors conclude that VGI data quality de-creases with increased distance from urban areas. On the other side of research, (Bishr and Kuhn, 2007, Keßler et al., 2011, Neis et al., 2011, Mooney and Corcoran, 2012b, Barron et al., 2014) assess VGI data intrinsically. They asses VGI data by investigat-ing the meta-data like contributors’ mappinvestigat-ing activities and repu-tation, entities’ editing history, etc. Authors of (Neis et al., 2013) compare the development of contributors’ communities in differ-ent cities around the world indicating the relation between the communities and data quality. The work in (Barron et al., 2014) presents 25 fitness-for-purpose measures to assess VGI data in specific uses.
Towards improving data quality, (Pourabdollah et al., 2013) con-flate VGI data with authoritative data. In an attempt to improve the data quality at contribution time authors of (Vandecasteele and Devillers, 2013) provide an approach to guide contributors during the editing process aiming to improve the semantic data quality. Moreover, (Schmid et al., 2013) argue a task-specific interface approach toward acquiring higher data quality. In our previous work, we tackled the inconsistent classification prob-lem in (Ali and Schmid, 2014) and proposed a learning-based approach to detect the problematic classification of VGI in (Ali et al., 2014).
Most of the research investigates quality measures like positional accuracy and completeness, while this paper tackles the thematic accuracy from a classification perspective. Moreover, assessment of VGI data through a comparison approach is no longer appro-priate for the nature of VGI. As well as, more studies assess VGI data intrinsically following crowd-sourcing or social approaches, whereas we follow the geographic approach aiming to improve the data quality.
3. CLASSIFICATION CHALLENGES IN VGI
Classification ambiguity and vagueness in spatial data types are the fundamental sources beyond the problematic thematic accu-racy of VGI (Fisher, 1999, Devillers et al., 2010). Particularly, the loose classification mechanisms and the absence of integrity checking mechanisms result in heterogeneous data classification. In most VGI projects, contributors are heterogeneous; they have
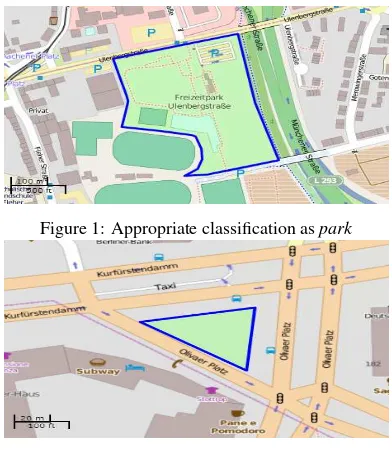
Figure 1: Appropriate classification aspark
Figure 2: Inappropriate classification aspark
diverse levels of knowledge about geography and cartography, and come from diverse cultures and educational backgrounds. On one hand, VGI harnesses the contributors’ heterogeneity towards developing rich data sources and preserving the concept of lo-cality; on the other hand, identical geographic features should be classified homogeneously as much as possible to support global applications (e.g. routing or map rendering). At the same time, there exist geographic entities that might appropriately belong to multiple classes (e.g. parkor garden). However, if the char-acteristics and the geographic context of an entity is taken into account, this entity would be more appropriately belong to one class rather than to the other(s).
In this paper, we defineappropriate classificationas assigning a given entity a class which highly reflects its intrinsic and ex-trinsic characteristics and matches its geographic context. E.g., Figures 1 and 2 illustrate the terms of appropriate and inappro-priate classifications, respectively. In Figure 1, the given entity contains some amusement facilities such as a playground, sport centers, and accessibility for walking. This entity is classified aspark, which typically expresses the characteristics of the en-tity. Here,parkrepresents the appropriate class of the entity. In contrast, in Figure 2 an entity represents a small piece of land covered by grass, located beside roads and roundabouts. The en-tity is classified aspark, despite it being too far from being used for amusement or entertainment. Here,parkis an inappropriate class andgrassmight be the appropriate class that truly reflects the characteristics of the entity. Hence, learning the intrinsic and extrinsic characteristics of a given geographic feature class is re-quired towards guiding and recommending the contributors dur-ing the classification process.
3.1 Ambiguous Classification
difficulties of classifying such of these entities; (2) the massive need for multiple classes for some entities; and (3) the demand for rule-guided classification. During remote classification, it is difficult, even for experts, to recognize the intrinsic properties of an entity to assign the most appropriate class. Thus recommen-dations and guides are both required particularly for non-expert contributors, which represent the majority in VGI projects.
We utilized OSM data, as a common example of VGI projects. In OSM, the classification is done by means of tags in form of key=value, where thekeyrepresents a classification perspec-tive and thevaluerepresents a class of that perspective. For ex-ample, tagleisure=park the keyleisureis associated with the set of entities that are used for entertainment purposes, while park represents one class between others likegarden, pitch, recreation, etc. There are no restrictions on the number of tags that are associated with an entity; each entity could be related to no tags or several tags with arbitrary combinations of tags (Mooney and Corcoran, 2012a). The flexibility of contribution mechanisms itself leads to problematic classifications. At the same time, OSM provides only recommendations of tags based on discussions between mappers communities. However, most contributors do not spend enough time to check the given recom-mendations. Moreover, particularly for non-experts, some rec-ommendations might be conceptually misinterpreted (e.g. wood orforestandlanduseorlandcover).
4. RULE-GUIDED CLASSIFICATION APPROACH TO IMPROVE CLASSIFICATION QUALITY
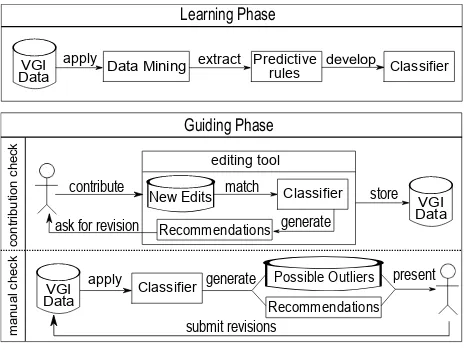
The proposed approach to improve the quality of classification exclusively depends on VGI data. We aim to develop a cation system able to guide the contributors during the classifi-cation process. Through guiding we aim to obtain data of con-sistent/homogeneous classification. Figure 3 illustrates the pro-posed approach, which consists of two phases: Learning phase (see Section 4.1) andGuiding phase(see Section 4.2).
Learning Phase
Figure 3: Guided classification approach
4.1 Learning Phase
The objective of theLearning phaseis mining VGI data to ex-tract a set of predictive rules. The rules describe the geographic characteristics of specific feature classes. The extracted charac-teristics have the form of:
head←body (1)
where the body describes the characteristics of an entity and the head points to the recommended (predicted) class. The
combina-tion of rules would be able to describe a specific feature class. Af-terwards, the extracted rules are organized into a rule-based clas-sifier, which consequently would be able to predict the most ap-propriate class for a given set of characteristics of an entity. The proposed approach maintains the locality principle. We assume that at country level a certain geographic feature should have the same characteristics; learning the characteristics of a specific fea-ture in China and applying the developed classifier in Germany may not make sense. During the learning process, we depend on topological investigations to understand the geographic context of target feature classes.
4.1.1 Topological Investigation Based on the first law of ge-ography (Tobler, 1970): “Everything is related to everything else, but near things are more related than distant things”, we investi-gate the topological relations between pairs of entities in order to understand the geographic context of specific classes of enti-ties. In short, this is to find the frequent relations between entities that uniquely distinguish each class. For example,parktypically contains playgrounds, pathways, etc., whereasgrassandmeadow contain less infrastructure; alsoparkis located within or near res-idential areas, whereasmeadowis typically located near farms and rural areas, etc.
We employ the 9-Intersection Model (9IM) (Egenhofer, 1995) to investigate the topological relations between pairs of entities. As shown in Figure 4, 9IM describes the topological relations be-tween pairs of entities as:disjoint, meet, overlap, covers, covered By, contains, inside, andequal. Basically, geographic features are represented by means of point, line, and polygon data ele-ments. In this work, the target classes are usually represented by polygon. Thus, we consider all possible topological relations be-tween polygon and other data elements;point, polygon-line and polygon-polygon.
inverse
Figure 4: The 8 topological relations of the 9-Intersection Model
At Figure 4, assume that the gray entities represents the target en-tities. We considerdisjoint, meet, overlap, contains, andcovers relations. Regardingdisjointrelation we analyze entities within distance of 10 meters far from target entities. Particularly, the dis-jointrelation gives insight about the external geographic context, while the others represent the relations resulting from the inter-sections of the interiors and boundaries of entities. We neglect theinside, covers, andequalsrelations for two reasons: (a)inside andcoversare inverse relations ofcontainsandcovered By, re-spectively; and (b) theequalrelation rarely occurs and does not add useful information for analysis.
features that are suggested by the OSM project on its Wiki page4. Due to the free contribution mechanism of the OSM project, the analysis results in more than 1,000 unique features, after filtering.
The mining process works to extract atomic rules in form of rule (1), which is translated into:
Class(X, C)←R(X, F) (2)
whereX represents a target entity,C is the predicted class and C ∈ {park, meadow, etc.},Ris one of the topological relations whereR ∈ {contains, meet, etc.}andFrepresents the set of frequent features that is mostly involved in a relationRwith en-tities of classC.
To extract such rules, we apply the Apriori algorithm (Agrawal et al., 1994). The Apriori algorithm is one of the common data mining algorithms that were initially developed to extract fre-quent item sets and to learn association rules from a transactional database (Witten and Frank, 2005). In this work, we particularly use a class association rule mining task, when rules have a pre-defined class (e.g. park) as their consequences (left side at rules (1) and (2)). Extracting interested rules among a large number of possibilities requires setting up some constraint parameters. Sup-port (supp) and confidence (conf) are two common constraints that used to define the thresholds for extracting and evaluating the interesting rules, as follows: [where 1=leisure playground and 15=highway footway]
support is used to filter the interesting patterns. It is defined as the percentage of entities that hold the body description. e.g.,supp(contains(X, [1, 15])) = 20%, means 20% of the entire entities contains playground and footways features.
confidence is used to evaluate the extracted rules. It is equal to the percentage of entities that hold the body description and consequently the head. e.g.,conf(Class(X, park)← contains(X, [1, 15])) = 80%, implies 80% of the entities hold the rule body is associated with classpark.
4.1.3 Classifier development The main idea of association rule mining has adapted to solve other problems such as classifi-cation problem resulting in associative classificlassifi-cation mining filed. Associative Classification(AC) is one branch of data mining that combines two mining tasks, associating rule mining and classifi-cation, to build a classifier based on a set of predictive association rule (Thabtah, 2007). Generally, developing a classifier based on a set of predictive rules consists of 4 steps:
Step 1 Find all interesting class association rules from a data set;
Step 2 Based on aconfidencethreshold, filter the extracted rules into a set of predictive association rules;
Step 3 Encode the rules into a classifier; then
Step 4 Evaluate the classifier on a test data set.
In geographic contexts, usually everything is possible (e.g., a building may be located in a desert, a highway crosses a resi-dential area or a public park, etc.). Besides, in VGI projects there exist unlimited unique features (See section 4.1.2). Thus, we set thesupportthreshold to 1% and consider patterns which occur with a frequency of more than 1% as frequent. During the learn-ing process, we are minlearn-ing to extract atomic rules per topological relation per class.
4http://wiki.openstreetmap.org/wiki/Map_Features
The extracted rules represent the output of Step 1. In the spatial context and due to the uncertainty of spatial data, the rules them-selves represent a challenge at Steps 2 and 3. The aim at Step 2 is to organize the extracted rules into a set of predictive asso-ciation rules for developing the classifier in Step 3. Hence, the difficulties come from the following points: (a) Step 1 results in rules of identical bodies associated with different heads (classes); (b) during Step 2, the higher the confidence threshold for filtering the interesting rules, the more possibility to dismiss useful infor-mation; (c) due to ambiguous classification (See section 3.1), an entity could plausibly belong to more than one class; and (d) due to geographic context, an entity could match with several atomic rules associated with different head (classes). In summary: How should we classify? By the majority of rules or by rules of higher confidence? In this paper, anappropriate classificationis that which truly reflects the characteristics of an entity.
4.2 Guiding Phase
During theGuiding phase, the aim is to enhance the classifica-tion quality of VGI by applying the developed classifier. The proposed approach presents two different ways of guiding: First, contribution checking, when the classifier is implemented in an editing tool. At contribution time, the tool informs the contribu-tor about the potential problem, based on the classifier. The edicontribu-tor provides the contributor with recommendations. Thereafter, the contributor considers the guidance provided and responds with correction (if required). Second, manual checking, when the clas-sifier is applied directly on an existing data set. The clasclas-sifier points out entities with problematic classification, which don’t match any of the predictive rules. The classifier generates the problematic entities combined with some recommendations. Af-terwards, both are presented for assessment and correction (if re-quired). Through both ways, the guiding could indirectly enrich the data source, when the contributors add more information to satisfy the recommended class.
5. EMPIRICAL STUDY
To evaluate the approach, we perform an empirical study. This study checks the ability of the developed classifier to distinguish between similar classes. During the study, we use the OSM data set of Germany dated December, 2013. Reasons behind selecting Germany for the study are the following: (1) active mappers com-munities; (2) no authoritative bulks are imported to data, so it still reflects the voluntary nature; and (3) several studies conclude the higher quality of OSM data in Germany relative to other places (Zielstra and Zipf, 2010, Ludwig et al., 2011, Neis et al., 2013). We extract all entities, that are represented by polygons and clas-sified asforest, garden, grass, meadow, park, orwood. The en-tities are extracted from the 10 most densest cities at Germanyto ensure active mappers communities and acceptable level of qual-ity. The cities are: Berlin, Bremen, Cologne, Dortmund, Dus-seldorf, Essen, Frankfurt, Hamburg, Munich, andStuttgart. The data set consists of 3,724forest, 3,030garden, 7,336grass, 4,277 meadow, 4,445park, and 1454woodentities. We processed each entity individually by analyzing the topological relations between pairs of entities within its geographic context. Each entity is de-scribed by a set of topological relations with other surrounded features and assigned to a specific class.
5.1 Learning Process
given class producing a set of predictive rules of the class. The rules represent the output of Step 1 (see Section 4.1.3).
We extract 9,193 rules; 4,100 describeforest, 215 describe gar-den, 745 describegrass, 506 describemeadow, 2,938 describe park, and 689 describewood.
5.2 Classification Hypothesis
As mentioned previously, the rules resulting from the learning process represent a challenge for developing the classifier. To overcome the mentioned difficulties, we do the following:
• Pruning: Redundant rules are removed based on the rules’ conf threshold. The rules with identical bodies are inte-grated into one rule assigned to the head (class) of higher conf.
• Filtering using theconfidencethreshold: The classifica-tion is done once by considering the entire rule set and once by considering rules withconf ≥50%.
• Grading 1st and 2nd recommendations: During the clas-sification process, we consider the 1st and 2nd recommended classes given by the predictive rules.
• Classification assumptions: Due to an unbalanced number of rules describing each class, depending on the majority of rules assigned to a specific class might be biased. Thus, we consider only rules with maximumconf per class to define 1st and 2nd potential classes.
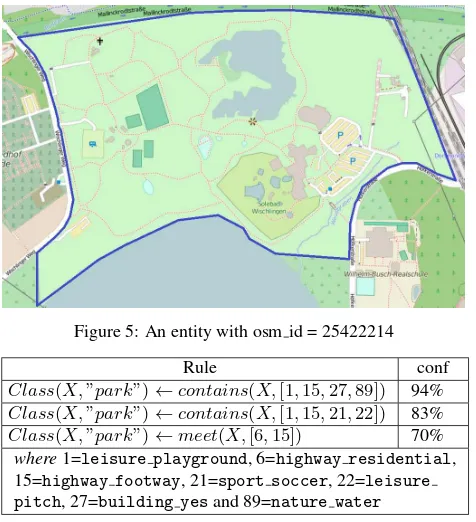
During the classification process, each entity is matched with the predictive rules. For example, Figure 5 shows an entity5 with osm id= 25422214. At writing time, the entity has 28 editing versions and is tagged withleisure=parkandname=Revierpark Wischlingen. It matches 401 rules: 232park, 132forest, 25 grass, 8meadow, 2wood, and 2garden. Table 1 shows some of the matched rules with this entity:
Figure 5: An entity with osm id = 25422214
Rule conf
Class(X,”park”)←contains(X,[1,15,27,89]) 94% Class(X,”park”)←contains(X,[1,15,21,22]) 83% Class(X,”park”)←meet(X,[6,15]) 70% where1=leisure playground, 6=highway residential, 15=highway footway, 21=sport soccer, 22=leisure pitch, 27=building yesand 89=nature water
Table 1: Matched rules for the entity with osm id = 25422214
5http://www.openstreetmap.org/way/25422214
Classification method
Accuracy
corrected classified ent. % max(conf)
per class
1st 14418 60
1st or 2nd 18333 75
max(conf) per classwhere conf≥50%
1st 12165 50
1st or 2nd 13487 55
not match
any rule 6276 25
Table 2: General accuracy of the proposed classifier
Regarding rulesconf, the top 50 rules haveconfrange form94% to 83%and all of them haveheadofClass(X,park). While considering 1st and 2nd recommended classes requires looking into the maximumconf per class. E.g., the same entity matches withpark,forest,grass,meadow,garden, andwoodclasses with descendingconf of94%, 65%,54%, 48%, 45%and 20% re-spectively. Hence, the given entity could belong topark(1st pre-diction) orforest(2nd prediction) classes rather than any other potential classes.
5.3 Results and Discussions
We depend on the accuracy (acc) measure to evaluate the results, where accuracy represents the percentage of corrected classified entities. Table 2 demonstrates results from applying different classification hypotheses. Due to the classification ambiguity 1st and 2nd recommended classes are considered.
First, we take into account the entire set of extracted rules. The classification is based on rules with the maximumconf per class; when classes of rules with the 1st and 2nd maximum conf are assigned to 1st and 2nd recommended classes, respectively. Con-sidering only the 1st recommended class, the classifier correctly classified 60% of entities. Whereas 75% of entities are correctly classified considering 1st or 2nd recommendations.
Second, we repeat the previous process, considering only rules withconf ≥50%. As Table 2 indicates, besides lower classifi-cation accuracies, a large number of entities does not match any rule. The clarification of that is the filtered rules are not able to cover all cases and do not give enough descriptions for the classes; some useful information might be hidden behind rules with lowconf. E.g.,Class(X, park) ←meet(X,[highway f ootway])hasconf of 38%. However this rule exactly exists in OSM Wiki recommendations6. To remove redundant rules, we do the pruning process (see Section 5.2). The 9,193 rules are re-duced to 5,826 rules, while the accuracies are remaining mostly the same.
Due to the unbalanced distribution of classes, depending on the overall accuracy might be biased. Thus, looking into more de-tails of the accuracy per class is important as well. Table 3 gives insight into the classification accuracy per class. According to Table 3,park, grass, and gardenhave higher classification ac-curacies (80-94 %, 72-87%, and 71-81%, respectively), whereas forest,meadowhave moderate accuracies with 38-67% and 42-58%. Whilewoodhas a noticeably lower accuracy. The entities ofpark, grass, andgardenmatch the 1st recommendations within 70% to 80%. They also match 1st or 2nd recommendations with higher accuracies between 81% to 94%. In contrast, entities of forest, meadow, andwoodmatch even 1st or 2nd recommenda-tions by an average of 46%.
The lower classification accuracy of the classwoodmight result from the limited number of entities in the training data set (1454).
Class Accuracy
corrected classified ent. % forest
(3724)
1st 1447 38
1st or 2nd 2501 67
garden (3030)
1st 2167 71
1st or 2nd 2472 81
grass (7336)
1st 5355 72
1st or 2nd 6424 87
meadow (4277)
1st 1826 42
1st or 2nd 2499 58
park (4445)
1st 3516 80
1st or 2nd 4216 94
wood (1454)
1st 107 7
1st or 2nd 221 15
Table 3: Proposed classifier accuracies per class
Thus, the generated rules have lowerconf; about 96% of the pre-dictive rules ofwood class hasconf <50%. Besides, at OSM Wiki7 different tagging approaches are presented forforestand wood. The same regardingmeadowclasses as90%of the ex-tracted rules hasconf<50%. In contrast, 21%, 15%, and 11% of rules describing the classesgarden, grass, andpark, respectively haveconf ≥75%. The various classification accuracies might return to dealing with VGI data itself; some features might be better mapped than others. Moreover, the training data set is not free of incorrect classified entities. We assumed the correctness of a large partition of data.
5.4 Evaluation
Due to the unavailability of an authoritative data for these types of features, we adopt two ways for the evaluation process. First, we visually investigate the results to check the recommendations given by the proposed approach. Figure 6 and 7 illustrate exam-ples of problematically classified entities and the recommended classifications. In Figure 6, the entity classified asgrass, whereas the recommended classification ispark; it contains sport areas, footways, etc. and is adjacent to a forest area, thus the appro-priate classification might bepark. While in Figure 7, the entity is wrongly classified asparkand the recommendation given is grass; it contains nothing and is located between roundabouts. The findings indicate that applying the proposed classifier and following the given recommendations might potentially result in an improved classification quality.
Second, we depend on the intrinsic properties (e.g. tags, version, mapper, etc.) and extract a data set for the validation process.
7http://wiki.openstreetmap.org/wiki/Tag:natural\ %3Dwood
Figure 6: An entity problematic classified asgrass, 1st recom-mendationpark
Figure 7: An entity problematic classified aspark, 1st recommen-dationgrass
For example, the proposed class appears to to correctly describe and classifyparkentities. Hence, we extract all entities that have names likeparkand are tagged byleisure=parkas a validation data set. The extraction done from the entire Germany data set resulted in 1,856parkentities. We applied the developed classi-fier on the extracted entities. The results show that 87% of en-tities are correctly classified by the 1st recommendation; 95% of the entities are correctly classified by the 1st or 2nd recom-mendation. The validation reflects the classifier’s is efficiency in distinguishing a specific class based on learning its intrinsic and extrinsic properties. Hence, applying the classifier on the entire parkentities of Germany would point out inappropriately classi-fied entities. The problematic classification might be relevant to incomplete mapping of an area or incorrect editing attitude of a contributor, which could be enhanced by applying the classifier at contribution time.
6. CONCLUSIONS
The increasing utilization of VGI for GIScience research results in a demand of higher data quality. Contributors’ diversities result in rich data sources, however with questionable quality. In this research, we are concerned withclassificationas a facet of data quality. Definitely, identical geographic features should be ho-mogeneously classified to support global applications. As a case study, we tackled the classification of grass-covered land, where a piece of land covered by grass could be classified aspark, gar-den, forest, etc. Classifications of these features are difficult and provide multiple challenges.
This paper presents an approach for rule-guided classification. The approach harnesses the availability of VGI data to learn the characteristics of specific feature classes. The proposed approach has two phases:LearningandGuidingphases. During the Learn-ingphase, we depend exclusively on the investigation of topo-logical relations to understand the geographic context of target classes. Data mining algorithms are applied resulting in a set of predictive rules, which describe the intrinsic and extrinsic charac-teristics of target classes. The rules are then organized into a clas-sifier. Whereas during theGuidingphase, the developed classifier could be applied in different ways guiding and recommending the contributors towards appropriate classification.
rules. In future work, we will focus on implementing theGuiding phase and measure the classification improvements based on the provided recommendations. We plan to study the OSM ontology (e.g., OSMonto (Codescu et al., 2011)) to determine whether the semantic distance between the ontological concepts could solve the ambiguity between similar classes.
ACKNOWLEDGMENT
This work is partially funded by the German Academic Exchange Service (DAAD), the German Research Foundation (DFG) through the Transregional Collaborative Research Center Spatial Cogni-tion SFB/TR 8, and the European Commission Marie Curie project COGNITIVE-AMI. We would like to thank the anonymous re-viewers for their valuable comments.
REFERENCES
Agrawal, R., Srikant, R. et al., 1994. Fast algorithms for mining association rules. In: Proc. 20th int. conf. very large data bases, VLDB, Vol. 1215, pp. 487–499.
Ali, A. L. and Schmid, F., 2014. Data quality assurance for Vol-unteered Geographic Information. In: Proc. of the 8th Interna-tional Conf. on Geographic Information Science, Springer Inter-national Publishing Switzerland, Vienna, Austria, pp. 126–141.
Ali, A. L., Schmid, F., Al-Salman, R. and Kauppinen, T., 2014. Ambiguity and plausibility: managing classification quality in volunteered geographic information. In: Proc. of the 22nd ACM SIGSPATIAL International Conf. on Advances in Geographic In-formation Systems, ACM, Dallas, TX, pp. 143–152.
Barron, C., Neis, P. and Zipf, A., 2014. A comprehensive frame-work for intrinsic OpenStreetMap quality analysis. Transactions in GIS 18, pp. 877 – 895.
Bishr, M. and Kuhn, W., 2007. Geospatial information bottom-up: A matter of trust and semantics. In: The European informa-tion society, Springer, pp. 365–387.
Codescu, M., Horsinka, G., Kutz, O., Mossakowski, T. and Rau, R., 2011. Osmonto – an ontology of openstreetmap tags. In: M. Schmidt and G. Gartner (eds), Proceedings of the SOTM-EU 2011 : 1st State of the Map - Europe Conference, pp. 55 – 65.
Devillers, R., Stein, A., B´edard, Y., Chrisman, N., Fisher, P. and Shi, W., 2010. Thirty years of research on spatial data quality: achievements, failures, and opportunities. Transactions in GIS 14(4), pp. 387–400.
Egenhofer, M. J., 1995. On the equivalence of topological rela-tions. International Journal of Geographical Information Systems 9, pp. 133–152.
Elwood, S., Goodchild, M. F. and Sui, D. Z., 2012. Researching Volunteered Geographic Information: Spatial data, geographic research, and new social practice. Annals of the Association of American Geographers 102(3), pp. 571–590.
Fisher, P. F., 1999. Models of uncertainty in spatial data. Geo-graphical information systems 1, pp. 191–205.
Flanagin, A. J. and Metzger, M. J., 2008. The credibility of Vol-unteered Geographic Information. GeoJournal 72(3-4), pp. 137– 148.
Girres, J.-F. and Touya, G., 2010. Quality assessment of the french OpenStreetMap dataset. Transactions in GIS 14(4), pp. 435–459.
Goodchild, M. F., 2007. Citizens as sensors: the world of volun-teered geography. GeoJournal 69(4), pp. 211–221.
Goodchild, M. F. and Li, L., 2012. Assuring the quality of Volun-teered Geographic Information. Spatial statistics 1, pp. 110–120.
Haklay, M., 2010. How good is Volunteered Geographic Infor-mation? a comparative study of OpenStreetMap and Ordnance Survey datasets. Environment and planning. B, Planning & de-sign 37(4), pp. 682.
Hecht, B. and Stephens, M., 2014. A tale of cities: Urban bi-ases in Volunteered Geographic Information. In: Proceeding of the 8th International Conference on Weblogs and Social Media (ICWSM), Michigan, USA.
Jackson, S. P., Mullen, W., Agouris, P., Crooks, A., Croitoru, A. and Stefanidis, A., 2013. Assessing completeness and spatial error of features in volunteered geographic information. ISPRS International Journal of Geo-Information 2(2), pp. 507–530.
Keßler, C., Trame, J. and Kauppinen, T., 2011. Tracking edit-ing processes in Volunteered Geographic Information: The case of OpenStreetMap. In: Identifying objects, processes and events in spatio-temporally distributed data (IOPE), workshop at confer-ence on spatial information theory, Vol. 12.
Ludwig, I., Voss, A. and Krause-Traudes, M., 2011. A com-parison of the street networks of Navteq and OSM in Germany. In: Advancing Geoinformation Science for a Changing World, Springer, pp. 65–84.
Mooney, P. and Corcoran, P., 2012a. The annotation process in OpenStreetMap. Transactions in GIS 16(4), pp. 561–579.
Mooney, P. and Corcoran, P., 2012b. Characteristics of heavily edited objects in openstreetmap. Future Internet 4(1), pp. 285– 305.
Neis, P., Zielstra, D. and Zipf, A., 2011. The street network evo-lution of crowdsourced maps: OpenStreetMap in Germany 2007– 2011. Future Internet 4(1), pp. 1–21.
Neis, P., Zielstra, D. and Zipf, A., 2013. Comparison of Vol-unteered Geographic Information data contributions and commu-nity development for selected world regions. Future Internet 5(2), pp. 282–300.
Pourabdollah, A., Morley, J., Feldman, S. and Jackson, M., 2013. Towards an authoritative OpenStreetMap: conflating osm and os opendata national maps road network. ISPRS International Jour-nal of Geo-Information 2(3), pp. 704–728.
Schmid, F., Frommberger, L., Cai, C. and Dylla, F., 2013. Lowering the barrier: How the What-You-See-Is-What-You-Map paradigm enables people to contribute volunteered geographic in-formation. In: Proc. of the 4th Annual Symposium on Computing for Development, ACM, Cape Town, South Africa, pp. 8–18.
Thabtah, F., 2007. A review of associative classification mining. The Knowledge Engineering Review 22(01), pp. 37–65.
Tobler, W. R., 1970. A computer movie simulating urban growth in the detroit region. Economic geography 46, pp. 234–240.
Vandecasteele, A. and Devillers, R., 2013. Improving volun-teered geographic data quality using semantic similarity measure-ments. ISPRS-International Archives of the Photogrammetry, Re-mote Sensing and Spatial Information Sciences 1(1), pp. 143– 148.
Witten, I. H. and Frank, E., 2005. Data Mining: Practical Ma-chine Learning Tools and Techniques. 2nd edn, Morgan Kauf-mann, San Francisco.