RECONSTRUCTION OF SCAFFOLDING COMPONENTS FROM
PHOTOGRAMMETRIC POINT CLOUDS OF A CONSTRUCTION SITE
Y. Xu a,c,*, J. He a,b, S. Tuttas a, U. Stilla a
a
Photogrammetry & Remote Sensing, TU München, 80333 München, Germany - (yusheng.xu, sebastian.tuttas, stilla)@tum.de b School of Resources and Environmental Science, Wuhan University, Wuhan, P. R. China
c
College of Surveying and Geo-Informatics, Tongji University, 200092, Shanghai, P. R. China
Commission III, WG III/4
KEY WORDS: Scaffolding components, Photogrammetric point clouds, 3D shape descriptor, Object recognition, Object modelling
ABSTRACT:
This paper presents a data-driven workflow for the detection of scaffolding components from point clouds. The points belonging to the scaffolding components are identified and separated from the main building structures and two basic elements, namely the toeboard and the tube, are reconstructed. The workflow has four main processing steps. Firstly, the raw point clouds are preprocessed by statistical filtering and voxel girding. In the second step, the planar surfaces of the building surface and scaffoldings are extracted via RANSAC and then grouped by their parallelity and distance to separate the building façade. In the third step, the 3D shape descriptor FPFH and random forest classification algorithm are applied to classify the point data of building façades into classes belonging to different elements. Finally, by the use of linear fitting algorithm and matching using SHOT shape descriptor, the tubes and toeboards are reconstructed with their geometric parameters. It is shown that the points belonging to these objects are identified and then reconstructed with cylinder and cuboid models. The final results show that over 60% of the tubes and nearly 90% of the toeboards are reconstructed in the investigated façade, and more than 40% of the reconstructed objects are well rebuilt.
*
Corresponding author.
1. INTRODUCTION 1.1 Motivation
In the fields of Architecture, Engineering and Construction/ Facility Management (AEC/FM), the demand for efficient and accurate progress monitoring of construction site has dramatically grown in recent decades for popular specialized applications in work progress control, productivity improvement, security assurance, accident investigation, collaborative communications, etc. (Turkan et al., 2012).
Normally, traditional progress tracking approaches depend highly on visual inspection and require extensive manual collection of data and analysis of various documents. Such progress monitoring methods therefore not only rely heavily on the personal skills and the experiences of professionals and but also require a lot of time. To solve this problem, the automatic construction site monitoring is developed with the application of 2D imaging, photogrammetry and Terrestrial Laser Scanning (TLS) in recent years (Turkan et al., 2012). Among all these techniques, the as-built Building Information Model (as-built BIM) generated from point clouds is utilized more and more widely due to its 3D feature and high flexibility for fast updating (Tang et al., 2010).
Nevertheless, the raw datasets of the generated point cloud usually contain many secondary and temporary objects, for example, scaffolding components. The scaffold components, which are commonly formed by thin structures like tubes and boards, are located very close to the building and share some similarities with the main body of building in size, color and
height. As a result of these properties, scaffold components may cause difficulties during the rebuilding of as-built BIM of the main building structure due to occlusions, similarities and disturbances. Therefore, if the scaffold components can be detected and reconstructed prior to the processing of the dataset of main building structure, the rebuilding of the as-built BIM will be more accurate and efficient. Moreover, since the scaffolds are commonly used to assist the construction and the maintenance of buildings, by judging the status of the reconstructed scaffolds, the professionals can also make an appropriate evaluation of the aggregate scheduling for the construction project.
The purpose of this work is to detect and reconstruct the scaffolding components from photogrammetric point cloud generated by stereo matching of a construction site with complex environment, in order to make a good preparation for the further rebuilding of as-built BIM and provide auxiliary information on the monitoring of the construction process.
1.2 Related work
Previous work about the reconstruction of scaffolds components using point cloud is scarce. Most of the related work mainly focuses on the rebuilding of as-built BIM from point clouds (Pătrăuceana et al., 2015; Xiong et al., 2013; Tang et al., 2010) or the comparison between as-built and as-planed BIM (Tuttas et al., 2014; Rankohi and Waugh, 2014). A preliminary investigation was made (own citation) to detect the scaffolding components in the construction site based on projection and Min-cut segmentation, with impressive results achieved. And based on Scan-vs-BIM system, some applications of point ISPRS Annals of the Photogrammetry, Remote Sensing and Spatial Information Sciences, Volume II-3/W5, 2015
clouds in tracking specified construction objects like Mechanical, Electrical and Plumbing (MEP) components (Bosché et al., 2014) and temporary or secondary objects like shoring, rebar are also developed (Turkan et al., 2014).
Beyond these work mentioned above, there are also many research work has been done in the field of shape or object detection and reconstruction from point cloud. Klein et al. (2007) detected basic shapes from unorganized point clouds by decomposing the point cloud into a structure of shapes and a set of remaining points. By means of statistical analysis and persistent histogram features estimation, Rusu et al. (2008) obtained the 3D object map in a household environment from the point cloud. Moreover, in Bosché (2010) the object recognition is performed based on a threshold on the ratio of the covered area to the entire surface of the object. Additionally, Rottensteiner (2012) gave a review of local supervised classifiers and statistical models for the object extraction from LiDAR points in urban areas. Then, Niemeyer et al. (2014) detected the building object from point clouds via integrating the random forest classifier into conditional random field framework. Based on the precious work, Polewski et al. (2015) demonstrates that the local 3D shape descriptors and local supervised classifiers can be used to efficiently detect segments of fallen trees in LiDAR point clouds.
At present, most of the existing methods related to monitoring construction site depend heavily on BIM. How to develop a simple but effective workflow to identify and rebuild scaffold components from point clouds without BIM is worth of research.
1.3 Contribution and structure of the paper
In this paper improved approaches for the detection of the scaffolding components based on the methods in (own citation) are given and put forward a detailed procedure of the recognition and modelling of two basic elements in the scaffolds: the tube and the toeboard, which are exhibited in Figures 1a and 1b. The overall methodology is described in Chapter 2. Firstly, the approaches for the preprocessing of the point cloud are explained in Section 2.2. Afterward, Section 2.3 devotes the methods for division of the building façades, namely the detection of the scaffolding components, while the process of classification of different kinds of elements in the scaffolds is described in Section 2.4. Then the methods of recognizing and rebuilding the objects are developed in Section 2.5. In Chapter 3, the experiments shown, with the introduction of datasets (Section 3.1) and discussion and evaluation of the results (Section 3.2 and 3.3), followed by a conclusion and an outlook in Chapter 4.
Figure 1. a) Real photo of scaffolds, b) toeboards and tubes in the scaffolds.
2. METHODOLOGY 2.1 Workflow
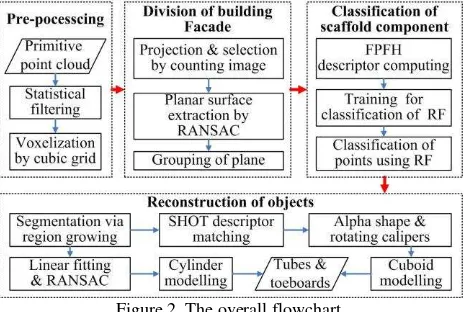
In general, the overall workflow for the detection and modelling of the scaffolds can be divided into four main steps. The first step is to make a preprocessing of the raw point clouds, in which a statistical removal algorithm is utilized to filter the outliers, followed by a voxelization process, aiming at to downsample and structure the point dataset. In the second step, the voxelized point clouds are projected to the ground, and intensities of pixels in the projected 2D imagery are counted in order to find the local maximum areas representing the points of scaffolds and building structures. The planar surfaces representing the building surface and scaffoldings are extracted by the random sample consensus (RANSAC) based model fitting algorithm and then merged and grouped by the parallelity and Euclidean distance between surfaces. The building surface and corresponding scaffolds are grouped together as a building façade. Afterwards, a 3D shape descriptor: fast point feature histogram (FPFH) is applied to the point data of building façades in order to obtain the features of different elements. With the help of random forest (RF) classification method, the points belonging to different types of objects are identified. Finally, by the use of RANSAC algorithm and signature of histograms of orientations (SHOT) (Salti et al., 2014) shape descriptor, the linear and planar objects are recognized, respectively, with their geometric parameters obtained. Figure 2 gives an overall workflow with involved methods and algorithms.
Figure 2. The overall flowchart.
2.2 Preprocessing of point cloud
The preprocessing of the point clouds aims at refining and structuring the primitive point clouds data. In detail, the objectives of the preprocessing of point cloud is twofold. On one hand, since the photogrammetric point clouds may introduce more errors compared with that from TLS, the outliers in the raw dataset should be removed. On the other hand, due to the large amount and the uneven distribution of points, a voxelization process is required to organize point cloud (Moravec, 1996), which will reduce the amount and discretize the point clouds in a uniformly spaced 3D grid data structure.
To remove the sparse outliers, a statistical analysis on the neighborhood of each point is conducted (Rusu et al., 2011). For each point, the mean distances from it to all its neighbors are computed. Assume that the distribution of points is Gaussian with a standard deviation, those points whose mean ISPRS Annals of the Photogrammetry, Remote Sensing and Spatial Information Sciences, Volume II-3/W5, 2015
distances are beyond the interval defined by the global distance This voxelization can distribute the density of points uniformly to avoid the overly dense and sparsely sensed points in specific areas.
2.3 Division of the building façades
The division of the building façades aims to distinguish and extract the points of main building body, including the points of the structures of the building and the adjacent scaffolding components, from the points in the construction site. The division consists of three core phases: (i) The projection and selection of the points, (ii) the extraction of planar surfaces and (iii) the grouping of the planar surfaces.
2.3.1 The projection and selection of the points: The projection of the point cloud is a conversion from 3D point data to 2D projected data by projecting the point clouds on the ground. As a cubic voxel grid has already been established in the preprocessing step, hence the point can be directly projected to the ground along the perpendicular direction. The number of pixels in length and width can be computed by dividing a pre-Here, the ceil() searches for the minimal integer which is larger
or equal to the calculation results. Two calculated pixel numbers determines the size of the 2D image. In this way, each point is projected in a unique bin definitely by the pixel on the 2D image, which is named after the counting image. However, each bin in the form of pixel on the counting image perhaps records many points or nothing depending on the pixel size. The larger the pre-defined pixel is, the more points each bin may contain. Too many or too few points in a pixel are both counterproductive to the assessment of the intensity. For the application of this work, an appropriate pixel size is about triple diameter of the vertical tube section. This pixel size guarantees that a single vertical tube can be projected into pixels with limited neighbours, with its features kept and disturbances limited.
For the selection, assuming that the projected points in the ground of main structure of the building and scaffold components (e.g. walls, tubes and boards) have a higher density when compared with the disturbing object. Thus, in the projected image, pixels are selected according to its intensity, namely the number of points falling into it. Large number means higher intensity and higher possibility of being selected. The points corresponding to the pixels with high intensity are expected to be selected as the points of main building body. For this work, the local maximum intensity is regarded as the most appropriate threshold for the selection of intensity. A sliding window with size of 33 is applied to the counting image to calculate the local maximum intensity following Equation 2:
1,2,3 1,2,3
2.3.2 The extraction of planar surface: After the projection and selection of the points, an extraction algorithm of planar surfaces is employed to the points of main building body. In this phase, an assumption is made that the major façades of the as-applied. Furthermore, considering the major façades always have a vertical direction, a constraint with a vertical direction is also added to the plane fitting process.
2.3.3 The grouping of the planar surface: The vertical planar surfaces which belong to the same façade should be grouped together as an entire as-built building façade. The grouping process is conducted on the basis of the parallelism and Euclidean distance. Normals of the plane will be calculated and to judge whether the planar surfaces are parallel or not, and the distance between them will decide whether they belong to the same façades or not. As shown in Figure 3, the relationship between the wall surface and the inner and outer rows of the scaffolds can also be rebuilt and labelled during the grouping process. For each extracted planar surface, they will firstly be grouped by the directions of their norms, and then verified and labelled by the distances between the parallel surfaces.
Figure 3. The schematic depiction of the grouping of the planar surfaces.
2.4 Classification of scaffolding components
With respect to the classification of the scaffolding components, its aim is to distinguish different kinds of basic elements forming the scaffolds. For this work, our emphasis is put on two basic elements in the scaffolds, namely the vertical tubes and the toeboards, which are the basic and typical elements in the scaffolds. To obtain these two basic elements from the whole point datasets with disturbing background, we use a supervised classification strategy with random forest algorithm to discriminate the elements.
For the sake of the features used in classification, a 3D shape descriptor FPFH (Rusu et al., 2008) is employed to train the random forest classifier in order to distinguish between the points belonging to certain kinds of elements and other points.
The random forest classifier (Breiman, 2001) is a combination of N tree-structured classifiers in which each classifier is created by randomizing vector sampled independently from the input vectors, and each decision tree vote uniformly for selecting the ISPRS Annals of the Photogrammetry, Remote Sensing and Spatial Information Sciences, Volume II-3/W5, 2015
most popular class to classify the input vectors (Pal, 2005). The random forest classifier employed in this study consists of using a combination of geometric features at each node to grow a tree. In the training, bagging method is used for each feature combination to generate a training dataset by randomly drawing with replacement N examples, where N is the size of the original training set (Breiman, 1996). For the classification process, if random forest is the average of the results from all the decision trees.
Figure 4. The illustration of the principle of random forest.
In regard to the FPFH descriptor, it is a simplified version of the point feature histogram (PFH), aiming at overcoming its drawbacks of high computational cost. The FPFH considers only the connections directly between the center key point and its neighbors, ignoring additional links between neighbors. This simplification make the complexity down from O(nk2) to O(nk). For each pair, the Darboux frame is computed from their normal vectors. With this frame, the difference between the normal vectors can be encoded with 3 angular variables, resulting in 33 bins in a feature histogram.
2.5 Recognition and rebuilding of objects
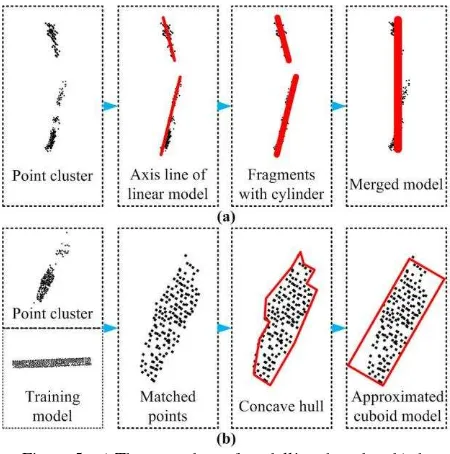
The recognition and modelling of the objects is designed to recognize and label each object in the candidate points of certain kinds of elements, and then represents them with regular geometric models. To make the recognition process more different approaches are designed to recognize them considering the various geometric characteristic of these two elements: (i) For tube, it is regarded as cylinder with length and radius. Like the aforementioned plane fitting, in the modelling of tubes, the RANSAC algorithm is used to fit the axis line of the model, and then the cylinder model is rebuilt with given radius. After the rebuilding of models, small fragments are merged together to form a completed tube object. (ii) For toeboard, it is deemed to
be cuboid with thin thickness. In the reconstruction of toeboards, the candidate points used for the modelling have to be firstly recognized from the point cluster by the use of SHOT shape descriptor and feature matching. The matching is conducted between points in the SHOT feature space, with Manhattan distance measured. Afterwards, the projection, alpha shape and rotating calipers algorithm are introduced to obtain the shape plane, shape boundary and convex polygon, respectively. In Figure 5, brief schematic diagrams are illustrated to explain the different procedures of modelling for tubes and toeboards.
Figure 5. a) The procedure of modelling the tube, b) the procedure of modelling the toeboard.
Some prior knowledge about the tubes and toeboards, such as radius and thickness, is also utilized to optimize the boundary of objects. The radius of tube is fixed to 4 cm, while the thickness of toeboard is set to 5 cm.
3. EXPERIMENTS 3.1 Datasets and construction site
In this study, a construction site in Munich is selected as experimental site, with an area on the ground of 2300 m2 and consisting of three main façades being triangular in shape. The photogrammetric point clouds are generated from a structure from motion system and stereo matching method developed by Tuttas et al. (2014), in which the VSfM Software (Wu, 2013) and SURE (Rothermel et. al., 2012) are also used. In the following data processing steps, Point Cloud Library (PCL) (Rusu et al., 2012) is also used. In Figure 6a, an example for the image taken on the investigated construction site is shown (Tuttas et al., 2014). The dense photogrammetric point clouds created from the images are shown in Figure 6b. In total, there are 81 images used and 33 million points generated. The coordinate system of the point data is perpendicular to the earth ground. It can be seen from Figure 6b that, the point clouds contain a lot of noise and many disturbing objects nearby the main body of building. Moreover, the points are sampled with very different point densities, ranging from 312 thousand pts/m2 to 83 thousand pts/m2. The average distance between the inner scaffold row and the building surface is approximately [0.3m, ISPRS Annals of the Photogrammetry, Remote Sensing and Spatial Information Sciences, Volume II-3/W5, 2015
0.6m], while that between outer row and the scaffold is about [1.1m, 1.4m].
Figure 6. a) The image of the construction site taken from the crane, b) the dense point cloud generated from the images.
3.2 Results and Discussion
3.2.1 The preprocessing results: After the statistical filtering and voxelization, the datasets has been condensed to 855 thousand points, seeing Figure 7. Here, the size of the cubic chosen for the voxel gird is 4 cm, and also the point densities have been evenly reduced to around 16 thousand pts/m2.
Figure 7. a) The original photogrammetric point cloud, b) the reduced point clouds after the statistical filtering and
voxelization.
After the projection, the main structure of building, including mainly the structure of walls and the scaffolding components, shows apparent light patterns in the counting image in Figure 8a representing the high densities and revealing the high overlap of points in the perpendicular direction reflected by the main façade of building. Figure 8b gives the outcome of the selection of points of main building body from the whole point cloud by the use of counting image. Though a voxelization process is done, seen in Figure 8b, total amounts of points in each façade are still different. Thus, in this work the façade with largest amount of points (hypotenuse) is chosen as our main targets.
Figure 8. a) The projected counting image, b) the selected points of main building body by using the counting image.
3.2.2 The separated building façades: As aforementioned, the planar surfaces, including building surfaces, the inner and outer rows of scaffolds, are extracted with plane fitting algorithm, and then grouped to form the building façades. In Figure 9, we can see the extracted result of one of the main building façades, in which Figure 9a displays an original image of the façade for comparison and the others show the extracted and grouped points of this façade. The red points represent the building surface, while the green and blue ones are the points belonging to the inner and outer rows of scaffolds, respectively. It can be seen from the figures that, the main part of this façade is separated and labelled. However, in the divided façade, there are also hollows and points wrongly labelled due to the occlusion and the fitting errors. For example, the missing part in the middle left along perpendicular direction in Figure 9b and the wrongly labelled blue points in Figure 9d. The Figures 9e and 9f display the separated scaffolding components and building surface, respectively.
Figure 9. a) The original image of the building façade, b)-d) the grouped façade formed by the extracted planar surfaces, e) the
scaffolding components, f) the building surface.
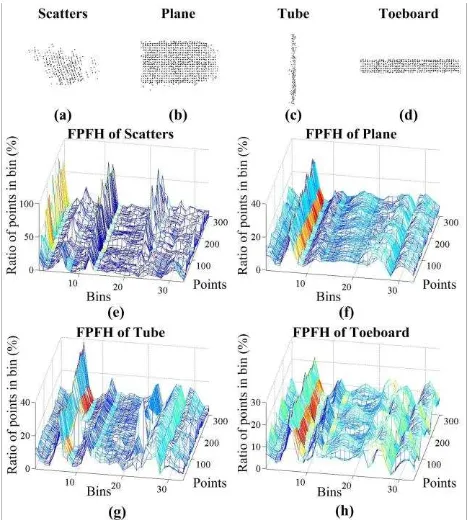
3.2.3 The classification of scaffolding elements: In this study, four kinds of representative objects are chosen in the point clouds of scaffolds, namely the scatters, the plane, the toeboard and the tube, in order to classify all the point dataset of the grouped façade. The scatters are the irregular point clusters with no specific shape, which is regarded as disturbing object. The planes are a common component of scaffolds, while the tubes and toeboards are our targets.
An illustration of examples of these four kinds of objects and their corresponding feature histograms of 300 points in the FPFH hyperspace calculated by FPFH descriptor is exhibited in Figure 10. It can be easily seen from Figures 10e - 10h that, their FPFH features have obvious distinctions. For the points lying in different objects, the peaks in the histogram shows different distributions and various value, while for the points of same objects, the histograms of each points reveal very similar distribution and tendencies, which can facilitate the classification process
Figure 10. Different kinds of objects (up) and their FPFH (down), a) and e) scatters, b) and f) plane, c) and g) tube, d) and
h) toeboard.
In Figure 11, the results of the classification using random forest and FPFH feature are given. It can be seen from Figures 11a and 11b that, the majority of the points belonging to the toeboard and tube have been successfully distinguished, but there are also some points been classified into wrong classes. It is noticeable that in Figure 11a, there are many points that should not be classified as “toeboard” but be wrongly identified. One of the explanations is that although the FPFH features of toeboard and plane can be distinguished, the plane and toeboard are quite similar in geometry theoretically. The toeboard can be regarded as a special kind of plane with thin thickness and narrow shape, so they are easily to be misclassified. And also, four kinds of classes cannot cover all types of objects in the scaffolds.
3.2.4 The recognition and modelling results: After the classification, the classes of points belonging to toeboard and tube are selected for the segmentation. The region growing segmentation results are also shown in Figure 11 in the form of color maps, where different colors represent different segmented point clusters. Nevertheless, the segmented point clusters also contain lots of disturbing points or ambiguous part as seen in Figure 11. For instance, the slant linear clusters in Figure 11a, which represent ladders in real scaffolds, should not be used for the further reconstructions. Hence, a matching process aiming at extracting the candidate points from the point cluster for the reconstruction is needed.
For matching, two point sets of class toeboard are selected manually from the whole point cloud to use as training samples. In Figure 12, an example of the matching between the training sample and the point cluster using the SHOT shape descriptor is given. It is clear that most of the candidate points can be matched from the point cluster, but the points neighboring the disturbing parts can hardly be correctly matched, for instance, the hollow part of the red points in Figure 12c. Figure 13 shows
comparisons between the rebuilt objects (already sampled by red points) and the original point clusters (the blue points).
Figure 11. Classifiacation and segmentation results, a) points of toeboards, b) points of tubes.
Figure 12. Matching of candidate points for toeboard modelling, a) the training sample, b) the point cluster used,
c) the matched candidate points. ISPRS Annals of the Photogrammetry, Remote Sensing and Spatial Information Sciences, Volume II-3/W5, 2015
Figure 13. Examples of reconstructed objects, a) for toeboard. b) for tube.
The final modelling results are given in Figure 14. In Figure 14a, the green points are original points of the divided building façade, while blue points represent the single reconstructed models, more exactly, the fragments of objects. Similarly, in Figure 14b, the red points show the merged objects, while the green background points are the original points of the separated building façade. For tubes, the rebuilt objects are mainly discontinuous fragments, with their directions slightly biased due to the disturbing errors. For toeboards, the errors are mainly caused by the segmentation process, in which the segmented clusters result in the discontinuity and the wrongly segmented points lead to the uncertainty of boundaries. As a consequence, a merging process is applied to combine and unify these fragments together. The geometric characteristics of the scaffolds, for example, the perpendicular direction of the tubes, facilitate the design of geometric constraints during the merging.
Figure 14. The matching results of the façade, a) the reconstructed objects (blue) and the original point clouds (green), b) the merged reconstructed objects (red) and the
original point cloud (green).
3.3 The evaluation of performance: To evaluate the performance of the proposed workflow, the number and the quality of reconstructed objects are regarded as two significant evaluation criterions. The number of reconstructed objects reflects the effectiveness of the proposed workflow. Here, both the numbers of the directly reconstructed objects and the result after merging process are counted. For the investigated façade used in Figure 14, Table 1 gives a statistical result.
Tubes Toeboards
True 108 60
Before
merging 53 49% 35 58%
After
merging 68 63% 52 87%
Table1. The number of reconstructed objects
Meanwhile, the quality of the reconstructed objects will give an assessment of the accuracy for the proposed approaches. Here, the quality of reconstruction can be divided into three levels: well reconstructed objects, badly reconstructed objects and failed ones. For the well reconstructed object, it is correctly identified and more than 75% of itself is reconstructed with an acceptable accuracy (the errors of geometric parameters is smaller than 25%). The badly reconstructed objects are those who is correctly identified but only 25% to 75% parts is reconstructed or the errors of its geometric parameters range from 25% to 50% . With regard to the failed ones, it means that the objects cannot be reconstructed or wrongly identified. Those object with its reconstructed part less than 25% and geometric error larger than 50% are also accounted as failed ones. Table 2 gives a manual evaluation result of the reconstructed objects after merging in the investigated façade shown in Figure 14.
Tubes Toeboards
Total 68 52
Well 39 57% 21 40%
Badly 21 31% 22 42%
Failed 8 12% 9 18%
Table2. The statistic of quality of reconstructed objects
It can be seen from the tables that, before the merging, only one-half of the objects are reconstructed. Then, by means of merging process, more than 60% of the tubes and approximately 90% of the toeboards can be successfully reconstructed in the investigated façade. As for the quality of outcomes, about 60% of the tubes are well reconstructed, while the value of that for toeboards is only 40%. In contrast, there are still 31% of the tubes and 42% of the toeboards are reconstructed in an inferior status with incompletion or large errors. Besides, the reconstructions of 12% of the tubes and 18% of the toeboaeds are failed, which is mainly due to the incorrect matching, lack of candidate point and rebuilding errors. It is worth to note that the merging process contributes a lot the final reconstruction, which can partly overcome the uncertainty of insufficient points and systematic errors caused by rebuilding.
4. CONCLUSIONS AND FUTURE WORK In this work, a workflow of identifying and rebuilding the scaffolding components is introduced for monitoring of the ISPRS Annals of the Photogrammetry, Remote Sensing and Spatial Information Sciences, Volume II-3/W5, 2015
construction site. The results indicate that the proposed approaches are competent to the identification and reconstruction of two basic scaffolding elements: tubes and toeboards. By the use of involved methods and algorithms, the points belonging to these objects are correctly identified and then rebuild with cylinder and cuboid models. Over 60% of the tubes and nearly 90% of the toeboards are finally reconstructed in the investigated façade, and more than 40% of the reconstructed objects are rebuilt with a good quality. However, there are also some drawbacks, such as the missing information during the preprocessing and the projection process, the errors due to the classification and the inaccuracies when reconstruct the objects.
In future, our work will focus on the classification of points and the recognition of objects, the performance of which can largely influence the final reconstruction. The performance evaluation should be further investigated. Furthermore, more types of objects in scaffolds will also be taken into consideration. The acquisition of photogrammetric point cloud needs to be optimized as well, because there are some parts in the cloud where points are insufficient in terms of coverage or accuracy. This part of work is now working in progress.
REFERENCES
Bosché, F., 2010. Automated recognition of 3d cad model objects in laser scans and calculation of as-built dimensions for dimensional compliance control in construction. Advanced Engineering Informatics, 24(1), pp. 107–118.
Bosché, F., Ahmed, M., Turkan, Y., Haas, C. T., and Haas, R., 2015. The value of integrating Scan-to-BIM and Scan-vs-BIM techniques for construction monitoring using laser scanning and BIM: The case of cylindrical MEP components. Automation in Construction, 49, pp. 201-213.
Breiman, L., 1996. Bagging predictors. Machine Learning , 24(2), pp. 123-140.
Breiman, L., 2001. Random forests. Machine learning, 45(1), pp. 5-32.
Moravec, H. P., 1996. Robot spatial perceptionby stereoscopic vision and 3d evidence grids. Technical Report CMU-RI-TR-96-34, Carnegie Mellon University, Robotics Institute.
Niemeyer, J., Rottensteiner, F. and Soergel, U., 2014. Contextual classification of LiDAR data and building object detection in urban areas. ISPRS Journal of Photogrammetry and Remote Sensing, 87, pp. 152-165.
Pal, M., 2005. Random forest classifier for remote sensing classification. International Journal of Remote Sensing, 26(1), pp.217-222.
Pătrăucean, V., Armeni, I., Nahangi, M., Yeung, J., Brilakis, I. and Haas, C., 2015. State of research in automatic as-built modelling. Advanced Engineering Informatics. (in press)
Polewski, P., Yao, W., Heurich, M., Krzystek, P. and Stilla,U. , 2015. Detection of fallen trees in ALS point clouds using a Normalized Cut approach trained by simulation. ISPRS Journal of Photogrammetry and Remote Sensing. (in press)
Rankohi, S. and Waugh, L., 2014. Image-based modeling approaches for projects status comparison. In: CSCE 2014 General Conference.
Rothermel, M., Wenzel, K., Fritsch, D. and Haala, N., 2012. SURE: Photogrammetric Surface Reconstruction from Imagery. In: LC3D Workshop, Berlin.
Rottensteiner, F., 2012. Advanced methods for automated object extraction from LiDAR in urban areas. In: IEEE 2012 Geoscience and Remote Sensing Symposium (IGARSS), International, pp. 5402-5405.
Rusu, R. B., Marton, Z. C., Blodow, N., Dolha, M., & Beetz, M., 2008. Towards 3D point cloud based object maps for household environments. Robotics and Autonomous Systems, 56(11), pp. 927-941.
Rusu, R. B., 2010. Semantic 3d object maps for everyday manipulation in human living environments. KI-Künstliche Intelligenz, 24(4), pp. 345-348.
Rusu, R. B. and Cousins, S., 2011. 3d is here: Point cloud library (PCL). In: 2011 IEEE International Conference on Robotics and Automation (ICRA), pp. 1-4.
Salti, S., Tombari, F. and Di Stefano, L., 2014. SHOT: unique signatures of histograms for surface and texture description. Computer Vision and Image Understanding, 125, pp. 251-264.
Schnabel, R., Wahl, R. and Klein, R., 2007. Efficient RANSAC for Point Cloud Shape Detection. In: Computer graphics forum, 26(2), pp. 214-226.
Tang, P., Huber, D., Akinci, B., Lipman, R. and Lytle, A., 2010. Automatic reconstruction of as-built building information models from laser-scanned point clouds: A review of related techniques. Automation in construction, 19(7), pp. 829-843.
Turkan, Y., Bosché, F., Haas, C. T. and Haas, R., 2012. Automated progress tracking using 4d schedule and 3d sensing technologies. Automation in Construction, 22, pp. 414–421.
Turkan, Y., Bosché, F., Haas, C. T. and Haas, R., 2014. Tracking of secondary and temporary objects in structural concrete work. Construction Innovation: Information, Process, Management, 14(2), pp. 145–167.
Tuttas, S., Braun, A., Borrmann, A. and Stilla, U., 2014. Comparison of photogrammetric point clouds with bim building elements for construction progress monitoring. In: Int. Arch. Photogramm. Remote Sens. Spatial Inf. Sci., Vol. XL-3, pp. 341–345.
Wu, C., 2013. Towards Linear-Time Incremental Structure from Motion. In: 2013 International Conference on 3D Vision, Seattle, WA: pp. 127-134.
Xiong, X., Adan, A., Akinci, B. and Huber, D., 2013. Automatic creation of semantically rich 3D building models from laser scanner data. Automation in Construction, 31, pp. 325-337.