DEVELOPMENT OF A NOVEL SYSTEM TO MEASURE A CLEARANCE
OF A PASSENGER PLATFORM
M. Shimizu a, *, J. Oizumi a, R. Matsuoka a, H. Takeda a, H. Okukura b, A. Ooya b, A. Koike b a
Kokusai Kogyo Co., Ltd., 2-24-1 Harumi-cho, Fuchu, Tokyo 183-0057, Japan - (masato_shimizu, junya_oizumi, ryuji_matsuoka, hiroshi1_takeda)@kk-grp.jp b
East Japan Railway Company, Kawamukocho 1-48, Utsunomiya, Tochigi 321-0965, Japan - (h-okukura, a-ooya, aki-koike)@jreast.co.jp
Commission V, WG V/3
KEY WORDS: Measurement, System Development, Passenger Platform, Rail, Laser Scanner, Point Cloud Processing
ABSTRACT:
Clearances of a passenger platform at a railway station should be appropriately maintained for safety of both trains and passengers. In most Japanese railways clearances between a platform and a train car is measured precisely once or twice a year. Because current measurement systems operate on a track, the closure of the track is unavoidable. Since the procedure of the closure of a track is time-consuming and bothersome, we decided to develop a new system to measure clearances without the closure of a track. A new system is required to work on a platform and the required measurement accuracy is less than several millimetres. We have adopted a 3D laser scanner and stop-and-go operation for a new system. The current systems on a track measure clearances continuously at walking speed, while our system on a platform measures clearances at approximately ten metres intervals. The scanner controlled by a PC acquires a set of point data at each measuring station. Edge points of the platform, top and side points of two rails are detected from the acquired point data. Finally clearances of the platform are calculated by using the detected feature points of the platform and the rails. The results of an experiment using a prototype of our system show that the measurement accuracy by our system would be satisfactory, but our system would take more time than the current systems. Since our system requires no closure of a track, we conclude that our system would be convenient and effective.
* Corresponding author
1. INTRODUCTION
Clearances of a passenger platform at a railway station should be appropriately maintained for safety of both trains and passengers. In most commuter lines of Japanese railways a platform gap between a train car and the edge of a platform is approximately 50mm for safety and convenience of passengers. Rails shift gradually as trains run repeatedly. Therefore the measurement of clearances is conducted precisely at regular intervals such as once or twice a year in most Japanese railways.
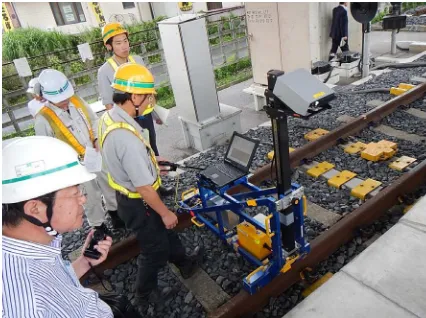
Before noncontact systems to measure a clearance by active stereo were developed several years ago (Kobayashi et al., 2003, Aoyama et al., 2007), contact systems which measure a clearance mechanically by pushing a roller on board a cart to the edge of a platform had been utilized in Japan. Figure 1 shows one of the current noncontact systems to measure a clearance by a laser point projection type of active stereo.
Because both the previous contact measurement systems and the current noncontact measurement systems operate on a track, the closure of a track is unavoidable. The procedure of the closure of a track is time-consuming and bothersome. Moreover most of measurements by the previous system or the current systems are conducted at midnight.
Accordingly we decided to develop a new system to measure a clearance of a platform without the closure of a track. A new system is required to work on a platform and secure a space
1.20m wide from the edge of a platform for traffic safety. Moreover a new system should be operated easily by a nonprofessional similarly to the current systems. The required measurement accuracy is less than several millimetres.
2. OUTLINE OF A CURRENT SYSTEM
The current system shown in Figure 1 is composed of a 2D range scanner of a laser point projection type of active stereo, a note-type PC, an odometer, a battery, and a hand cart. Specifications of the current system are shown in Table 1.
The scanner of the current system measures distances between the scanner and points on the surface of a platform. Since the
Figure 1. Current measurement system
cart having the scanner on board is placed on two rails of a track, a distance and a height from the centre of the track to the edge of the platform can be calculated. Measurement of a clearance by the current system is usually taken at intervals of 0.5m along the track. Moreover the current system can measure a clearance at any point. The odometer of the current system measures a longitudinal distance from the first measuring point to each measuring point.
The major problem of the current system is that it needs the closure of a track in order to measure a clearance of a platform. Another smaller problem of the current system is the inaccuracy of the longitudinal position of a measurement, because idling of the wheel of the odometer occurs sometimes.
3. OUTLINE OF OUR NEWLY DEVELOPED SYSTEM
We decided to develop a new system to measure a clearance of a platform without the closure of a track that is the major problem of the current system.
3.1 Requirements to a New System
Requirements to a new system to measure a clearance of a platform are summarized as follows:
(1) A system is required to work on a platform and secure a space 1.20m wide from the edge of a platform for train traffic safety.
Figure 2 shows a cross section of a typical platform of Japanese commuter lines. The gauge of most of Japanese railways except Shinkansens is 1,067mm, which is one of the narrow gauges. Standard horizontal and vertical clearance values in most commuter lines in Japan are 1,485mm and 1,100mm respectively. There is tactile paving on almost all the passenger platforms in Japan and a new system should not work on tactile paving in principle.
(2) Hardware of a system should be as compact as one or two persons can easily carry the hardware.
The hardware of the current system can be carried onto a track by two persons.
Figure 2. Cross section of a platform (unit: mm) Measuring method active stereo
(laser point projection) Laser class Laser class 2 (680 - 695nm) Measuring range 0.5 - 1m from the scanner Measuring interval 0.5m
Measuring speed ≤ 4km/h (at walking speed) Measuring resolution 1mm
Dimensions (expanded) 1600 × 560 × 1470 mm W × D × H (collapsed) 1400 × 560 × 740 mm
Weight Approx. 38kg
Table 1. Specifications of the current measurement system
(3)A system should be operated easily by a nonprofessional. The current system can be operated easily by a non-professional without any special training.
(4)The measurement accuracy of a system should be less than several millimetres.
The effective measurement accuracy of the current system is estimated to be approximately three millimetres.
(5)Hardware of a prototype of a system should be available in the market.
We decided to adopt hardware components available in the market in order to reduce costs and time to develop a new system.
3.2 Features of Our New System
We designed a new system based on the above mentioned requirements. Major features of our new system are as follows:
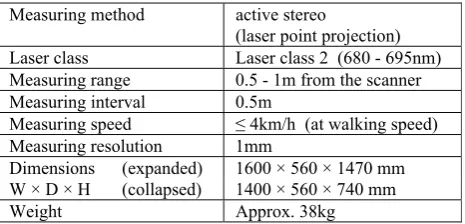
(1)A 3D laser scanner FARO Focus3D X330 based on the phase shift principle is adopted as measuring equipment. Focus3D X330 produced by FARO Technologies, Inc. is compact and can acquire precise point clouds accurately enough to accomplish the required accuracy at a range of 10m. Table 2 shows the specifications of Focus3D X 330.
(2)Stop-and-go operation is adopted for our new system. Figure 3 illustrates the stop-and-go operation of our new system.
The current system on a track measures clearances continuously at walking speed, while our new system on a platform measures clearances intermittently. Our new system provides measurement results of clearances at intervals of 0.5m along the track the same as the current system. Moreover our system is able to measure a clearance more frequently.
(3)Main hardware components of our system are a 3D laser scanner FARO Focus3D X330, a note-type PC, a battery, and a hand cart.
The scanner is controlled via Wi-Fi by the PC and the acquired data are transferred into the PC. Figure 4 shows a prototype of our new system.
Figure 3. Stop-and-go operation of our new system to measure clearances of a platform (unit: mm)
Range 0.6m - 330m
Measurement speed up to 976,000 points/second
Ranging error ±2mm
Laser class Laser class 1 Field of view (vertical) 300°
(horizontal) 360°
Step size (vertical) 0.009° (40,960 points on 360°) (horizontal) 0.009° (40,960 points on 360°) Weight 5.2kg
Size 240 x 200 x 100mm
Multi-sensor GPS, compass, height sensor, dual axis compensator Scanner control via touchscreen display and
Wi-Fi
Table 2. Specifications of FARO Focus3D X 330
Figure 4. Prototype of our new system
3.3 Measurement Process by Our New System
Figure 5 shows the process to measure clearances of a platform by our new system.
(0)Prior to the first measurement marking of each measuring station is conducted. Measuring stations are usually located at intervals of ten metres.
(1)An operator carries the hardware to the first measuring station. Here the hardware is assembled and the software is started.
(2)A set of point data is acquired by the scanner controlled by the PC via Wi-Fi at each measuring station. The acquired data are transferred into the PC via Wi-Fi.
(3)Edge points of the platform and top and side points of two rails are detected from the acquired point data. Clearances of the platform are calculated by using the detected edge points of the platform and the detected top and side points of the rails. If the calculated clearance is out of the predefined threshold, a warning message will be displayed on the PC screen.
(4)The operator moves the hardware to the next measuring station and starts acquisition of point data. Measurement is executed at every pre-marked measuring station.
(5)After processing at the last measuring station is finished, the geospatial registration of point data acquired at each measuring station is performed by using overlapped point data acquired at two adjacent measuring stations. Then an
inventory of the clearances of the whole platform is made.
(6) Finally the software is terminated and the hardware is disassembled. Then the operator returns from the last measuring station.
3.4 Algorithm to Calculate a Clearance of a Platform
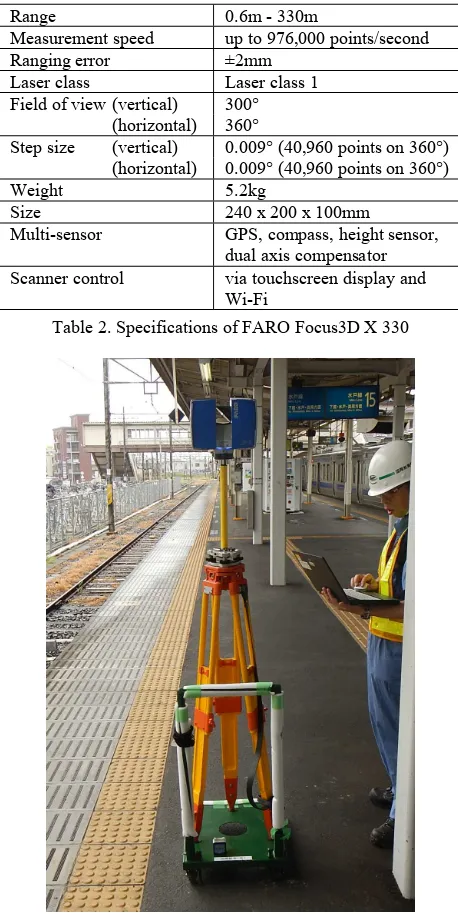
3.4.1 Clearance of a platform: A clearance of a platform in the paper is composed of a distance from the centre of a track and a height above the level of two rails as Figure 6 shows. There is a difference in elevation between two rails in most curved tracks and the level of the two rails is out of the horizontal. Accordingly the centre line of the track that passes through the middle point of the inner sides of the two rails is not perpendicular. The edge EP of the platform and the inner side SF of the far rail and the tops TN and TF of the near and far rails are utilized in order to calculate a clearance in our system. Since a gauge that is a distance between the inner sides of the rails is given, the measurement of the inner side of the near rail is unnecessary. Clearances of a platform are calculated from the acquired point data according to Figure 7.
Figure 5. Measurement process by our new system
Figure 6. Clearance of a platform
Figure 7. Process of calculating clearances
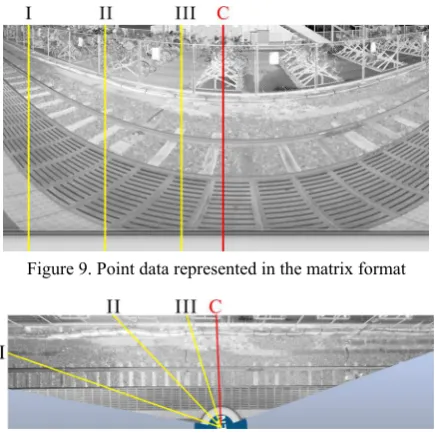
3.4.2 A set of point data acquired by the 3D scanner: The direction of the primary scan of Focus3D X 330 is vertical and the direction of the secondary scan is horizontal as Figure 8 shows. The process of acquired point data follows the sequence of the scanning.
Figure 9 and Figure 10 show intensities of a set of point data obtained by the scanner. The point data in Figure 9 are represented in the matrix format of columns and rows, while those in Figure 10 are represented on the plan.
The laser points of the primary scan lines I to III are shown in
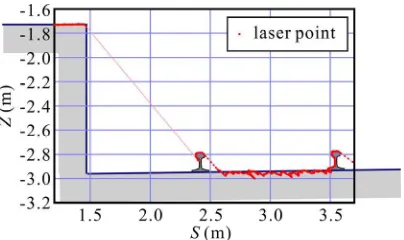
Figure 11 and those of the primary scan line C are shown in Figure 12. S in Figure 11 and Figure 12 means a horizontal distance from the scanner, while Z in those figures means a vertical coordinate where the origin of the vertical coordinate is the centre of the scanning.
Figure 11 and Figure 12 indicate that the edges of the platform and the tops and sides of the two rails would be able to be detected from the acquired point data. However the horizontal distances S of the edges of the platform and the tops and sides of the two rails vary according to the direction of a primary scan line.
Figure 8. Primary and secondary scans of Focus3D X 330
Figure 9. Point data represented in the matrix format
Figure 10. Point data represented on the plan
(a) Primary scan line I
(b) Primary scan line II (c) Primary scan line III
Figure 11. Laser points of the primary scan lines I to III (S: horizontal distance from the scanner, Z: vertical coordinate)
From now on we assume that laser points of each scan line are arranged in anticlockwise order as Figure 13 shows.
3.4.3 Detection of an edge point of a platform: Figure 14 shows laser points on the platform of the primary scan line C. In Figure 14 one can find an imaginary point which Focus3D X 330 sometimes provides. We need to eliminate such imaginary points in processing point data acquired by Focus3D X 330.
Figure 15 shows one of typical platform edge copings with tactile paving utilized in Japan. The fact that the scanner can acquire spatially discrete data as Figure 14 shows and the fact that the platform edge coping has a chamfer as Figure 15 shows make it difficult to estimate the position of the edge of the platform necessary to calculate a clearance of the platform.
The last point on the platform can be easily detected, because the distance between the last point on the platform and the next point out of the platform becomes considerably larger than that between another two adjacent points as shown in Figure 11 and Figure 12.
On the other hand points on the platform except points on the chamfer of the edge coping provide an approximate line of the platform surface. The approximate surface line, the detected last point on the platform, and the size of the chamfer are utilized to estimate the position of a virtual edge of the platform which will be used to calculate a clearance as Figure 14 shows.
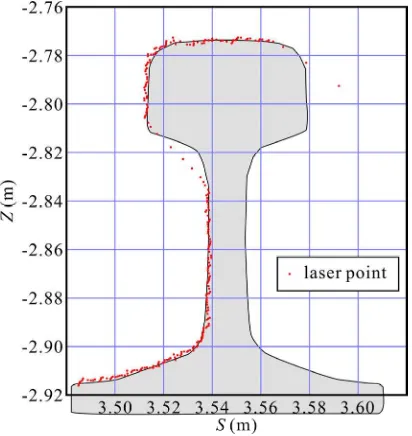
3.4.4 Detection of top and side points of a rail: Figure 16 and Figure 17 show laser points on the surfaces of the near rail and the far rail of the primary scan line C respectively. Imaginary points by the scanner are found once again in both Figure 16 and Figure 17. The far side of every rail is not normally observed by the scanner.
We estimate an approximate line segment of the top surface of each rail by using laser points supposed to be laid on the top surface of the rail. The midpoint of the approximate line segment is treated as a top point of the rail which will be utilized to calculate the clearance.
In a similar way, we estimate an approximate line segment of the side surface of each rail by using laser points supposed to be laid on the side surface of the rail. The higher endpoint of the approximate line segment is treated as a side point of the rail. The side point of the far rail will be utilized to determine the centre line of the track. Although it is not necessary to estimate the side point of the near rail, the estimation is conducted to detect some observation errors as Figure 19 shows.
3.4.5 Feature points extracted from the point data: Hereafter the virtual edge of the platform, the top points and the side points of the near and far rails estimated from the point data of each primary scan line are called feature points. A clearance of the platform at a measuring point is calculated by using a set of feature points located in the neighbourhood of the measuring point.
Figure 12. Laser points of the primary scan line C
Figure 13. Order of laser points of a primary scan line
Figure 14. Laser points on the platform of the scan line C
Figure 15. Platform edge coping with tactile paving
Figure 18 shows feature points estimated from the acquired point data shown in Figure 9. Red dots in Figure 18 represent the estimated virtual edges of the platform, while blue dots in Figure 18 represent the estimated side points of the near and far rails.
3.4.6 Calculation of a clearance: A piecewise linear function of the centre of the track is estimated by using the side points of the far rail and the given gauges. Length of each line segment is 0.5m to 1.0m depending on the curvature of the track.
When we calculate a clearance of the platform at a certain point, we first extract a line segment of the centre of the track which is the nearest to the given point. Then a set of neighbouring feature points of the extracted line segment is rotated so the extracted line segment is the Y-axis. Next approximate lines of the virtual edges of the platform and the top points of the near and far rails are estimated. Finally a clearance of the platform at
the measuring point is calculated by using the three intersections of the three approximate lines and the X-Z plane.
3.5 Experiment in a real train station
An experiment using a prototype of our system was conducted in a real train station to investigate the performance of the system. The experiment was conducted at 17 measuring stations of a platform as shown in Figure 2 and Figure 4. A round of measurement at a measuring station took approximately five minutes.
3.5.1 Measurement results: Table 3 shows the statistics of differences in distance and height between measured values by the current system and those by our new system.
Since the current system measures clearances at 0.5m intervals, there are basically at least 21 differences of measured values at each measuring station. In Table 3 n shows the number of Figure 16. Laser points of the near rail of the scan line C
Figure 17. Laser points of the far rail of the scan line C
Figure 18. Virtual edges of the platform (red dots) and side points of the rails (blue dots)
Station Kilometrage Distance Height
n d d h h
No. 02 0,019.00 22 −0.5 2.7 0.3 1.1
No. 03 0,024.00 23 −1.8 2.7 0.0 1.2
No. 04 0,029.00 23 −0.7 2.8 −0.2 1.2 No. 05 0,034.00 23 1.7 2.7 −0.4 1.1 No. 06 0,039.00 23 0.8 2.2 −1.0 1.4 No. 07 0,044.00 23 −1.1 3.2 −1.3 2.9 No. 08 0,049.00 23 −3.0 3.9 −2.7 3.4 No. 09 0,054.00 23 −4.1 4.8 −3.4 3.9 No. 10 0,064.00 23 −1.5 2.3 −2.1 2.3 No. 11 0,074.00 23 −1.5 2.6 −3.0 3.3 No. 12 0,084.00 23 −3.1 3.3 −3.6 3.8 No. 13 0,094.00 23 −2.9 3.1 −3.3 3.5 No. 14 0,104.00 23 −2.6 3.0 −2.4 2.7 No. 15 0,114.00 21 −2.1 2.7 −1.4 1.9 No. 16 0,124.00 23 −1.4 1.9 −0.7 1.3 No. 18 0,144.00 23 −2.1 2.8 −2.3 2.6 No. 19 0,154.00 19 −4.4 4.7 −2.3 2.9
Total 384 −1.8 3.1 −1.8 2.6
Table 3. Statistics of differences in distance and height of measured values between the current system
and our new system
measured values, d and
d are the mean and the standard
deviation of differences in distance respectively, and hand h
are the mean and the standard deviation of differences in height respectively.
The results of the experiment shown in Table 3 indicate that the measurement accuracy by our system would be satisfactory.
3.5.2 Problems of measurement in a real station: Figure 19 shows point data acquired at the measuring station No. 19. There is an invalid part found in the right side of Figure 19, because a passenger intruded into the observation area. The intrusion of a passenger can be easily detected by measurement results as Figure 19 shows. This problem can be avoided by careful watching of the observation area in a measurement.
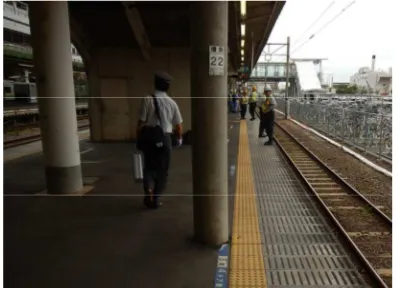
A pole near the edge of the platform shown in Figure 20 obstructed a measurement. Such a pole makes it unable to set up the hardware at an appropriate measuring spot and disturbs an observation of the scanner as well. A staircase also obstructs a measurement. This problem can be solved by selecting an appropriate spot as a measuring station.
However sometimes there is no place to secure a space 1.20m wide from the edge of a platform. In this case setting up the hardware nearer to the edge of the platform is not a solution of this problem, because the scanner has a dead angle of the observation just under the scanner and the edge of a platform would be unable to be observed. Therefore in order to suppress the downward dead angle of the scanner we produced other hardware where the scanner is suspended from a balance pole as Figure 21 shows. The disadvantage of this hardware is approximately 6kg heavier than the hardware where the scanner is set up normally as Figure 4 shows. The weight of this suspend type is nearly the same as the current system. It is unnecessary to modify the software according to the change of the hardware.
4. CONCLUSION
We have developed a new system to measure a clearance of a platform. Our system adopts a 3D laser scanner and stop-and-go operation. There are two types of hardware. One is the lighter hardware where the scanner is set up normally as Figure 4 shows. The other is the heavier hardware where the scanner is suspended from a balance pole as Figure 21 shows, but it can reduce influences given by an obstacle such as a pole or a staircase. The current measurement systems work on a track with the closure of a track, while our system works on a platform without the closure of a track.
The results of the experiment indicate that the measurement accuracy by our system would be satisfactory, but our system would takes more time than the current systems. Since our system requires no closure of a track, we conclude that our system would be convenient and effective.
We will investigate whether our system with a suspended scanner can measure clearances of a platform with platform screen doors between the platform and the track.
REFERENCES
Aoyama, T., Nakamura, D., and Saito, T., 2007. Development of New Platform Clearance Gauge Measuring Equipment, JR EAST Technical Review, No. 9, pp. 63-66.
Kobayashi, M., Yamada, Y., Nagata, F., and Mori, Y., 2003. Development of Structural Gauge Measurement System for Platform by Optical Cutting Method, Proceedings of 2003 JSCE Annual Meeting, No. 6, pp. 479-480.
Figure 19. Point data acquired at the measuring station No. 19
Figure 20. Obstacle pole to measurement
Figure 21. Hardware with a suspended scanner