Ž .
Aquaculture 185 2000 101–120
www.elsevier.nlrlocateraqua-online
Growth and protein turnover in Atlantic salmon
ž
Salmo salar L. ; the effect of dietary protein level
/
and protein particle size
Harald Sveier
a,), Arnt Johan Raae
b, Einar Lied
ca
NorAqua InnoÕation AS, N-4335 Dirdal, Norway
b
Institute of Molecular Biology, Høyteknologisenteret, N-5000 Bergen, Norway c
Institute of Nutrition, Directorate of Fisheries, Box 185, N-5804 Bergen, Norway
Accepted 21 October 1999
Abstract
In modern fish feeds, the protein sources consist of denaturated finely ground ingredients. From the literature, it has been reported that use of coarsely chopped, but not denaturated, fish as the dietary protein source gave better growth performance and protein utilisation. Growth, feed
Ž
utilisation and protein turnover using two different fish meal particle sizes micro- or
coarse-. Ž .
grounded at three dietary protein concentrations 30%, 35%, and 45% were studied in individu-ally tagged Atlantic salmon in a 3-month growth experiment. At the end of the experimental period,14C-L-lysine was injected intraperitonally and dorsal muscle samples were taken at 2- and 4-h post-injection. Incorporation of 14C-L-lysine into muscle protein, RNA, DNA and water soluble protein was analysed from samples of muscle tissue. Only small effects on growth rate, feed conversion rate, protein and energy retention, and nitrogen and fat digestion were found. During the growth experiment, large individual variations in growth rates were observed, which did not correlate to the initial body weight. The total RNA content expressed as RNA amount per
Ž .
unit of DNA RNA:DNA ratio did not reflect the specific RNA activity, and individual growth rate was not correlated to the specific RNA activity or RNA:DNA ratio and only poorly to the relative incorporation rate of amino acids. Growth rate was, however, correlated to the relative efficiency of protein synthesis. The results indicate that the protein catabolism is more important
)Corresponding author. Tel.:q47-51-61-1700; fax:q47-51-61-6112.
Ž .
E-mail address: [email protected] H. Sveier .
0044-8486r00r$ - see front matterq2000 Elsevier Science B.V. All rights reserved.
Ž .
for net protein deposition and growth than protein anabolism.q2000 Elsevier Science B.V. All
rights reserved.
Keywords: Fish meal; Particle size; RNA:DNA ratio; Protein synthesis; Specific RNA activity; Individual
growth rate
1. Introduction
Modern fish feeds comprise finely ground ingredients bonded together during the gelatinisation of starch when exposed to mechanical shear, steam and pressure in the
Ž
extrusion process. The question has been raised on whether the physical state e.g.,
.
particle size or friability of food particles may affect growth and feed utilisation by
Ž .
affecting the gastrointestinal transit time Jobling, 1986, 1988; dos Santos et al., 1993 .
Ž .
Sveier et al. 1999 examined the effect of feeding diets consisting of fish meal ground into three different particle sizes at two different protein concentrations on growth, feed utilisation and gastrointestinal transit time, and found no significant effects except for the evacuation time in the stomach. Gastric emptying rate or solubility of the protein has
Ž
been shown to affect utilisation of dietary protein dos Santos and Jobling, 1991; Espe and Lied, 1994; Espe et al., 1992, 1999; Schuhmacher et al., 1997, de la Higuera et al.,
. Ž .
1998 . Boirie et al. 1997 demonstrated that the rate of absorption of amino acids from the gut from a casein or whey protein-based diets affects protein synthesis within the whole body protein catabolism and oxidation of amino acids.
The major part of the weight increase is related to the deposition of protein. The protein accretion is a balance between protein anabolism and catabolism. Protein catabolism occurs through different mechanisms and there is no clear method for
Ž
estimating total protein catabolism in whole body or selected tissues Houlihan et al.,
.
1993 . The extent of protein synthesis is, in principle, correlated to the amount of
Ž .
ribosomal RNA rRNA which contributes approximately 85% of the total cellular RNA species, available amino acids and it is under endocrine control. The concentration of
Ž . Ž . Ž .y1 Ž
total ribonucleic acid RNA can be expressed as mg RNA g tissue while mg
. Ž .y1
water soluble protein mg RNA is an index for ribosomal activity. The RNA:DNA ratio reflects the amount of RNA per cell and is a more reliable quantification compared to the grams of tissue. The RNA content in white muscle tissue has been shown to be
Ž
directly related to protein synthesis and growth in a number of species Goldspink and
.
Kelly, 1984; Houlihan et al., 1993; Valente et al., 1998 . The specific RNA activity and the protein synthesis efficiency can be measured in animals using the flooding dose method where the incorporation of a labelled amino acid into newly synthesised protein
Ž .
is measured Garlick et al., 1980 . The efficiency of RNA translation may change
Ž .
significantly after a meal Lyndon, 1990 . Only a few studies have compared direct
Ž
protein synthesis measurement and RNA concentration in fish tissues Houlihan et al.,
.
1993 .
( )
H. SÕeier et al.rAquaculture 185 2000 101–120 103
effects of these factors on growth, protein turnover, specific RNA activity and feed utilisation. Further, the individual variation and response on the same factors was investigated.
2. Material and methods
2.1. Experimental conditions
The experiment was carried at NorAqua Innovation research station in Dirdal in the
Ž . Ž
Southwestern part of Norway. Atlantic salmon Salmo salar L. of the NLA Norsk
.
Lakseavl, Kyrksæterøra, Norway strain, hatched in February 1996, and smolted during the autumn 1996 was used. Groups of 20 fish were adapted to the experimental conditions for 4 weeks prior to the experiment. Initially, 18 fish averaging 336"41 g
Žns324, 1 STD were randomly assigned to 18 tanks with a water volume of 0.5 m .. 3
The six experimental diets were randomly assigned to the tanks using three replicates
Ž .
per diet. Seawater salinity 30.0"1.1‰ at 7.6"0.28C was used throughout the experiment. Temperature and salinity were recorded daily, while the oxygen saturation in the water outlet was recorded and adjusted weekly to ensure a minimum level of 7 mg ly1
. The fish were exposed to continuous light from smoltification until the end of the experiment.
The fish were fed in excess three times daily using automatic feeders for 96 days.
Ž . Ž .
First meal from 2000 to 2100 h 20% , second meal from 0200 to 0300 h 20% and
Ž .
third meal from 0700 to 0800 h 60% . A mechanical system for collecting uneaten feed was installed at the outlet of each tank. The collection system was a moving mesh belt,
Ž
which removed the uneaten feed from the outlet water and into a collection box Sveier
.
et al., 1997 .
2.2. Diet composition
Ž .
The fish meals used in diet formulation were the same as that of Sveier et al. 1999 .
Ž
The fish meals used were produced from the same batch of herring Clupea harengus,
.
L. fillet by-product by The Norwegian Herring Oil and Meal Industry Research Institute, Bergen, Norway. After processing, the fish meal was milled and separated into
Ž . Ž
two parts by sieving. The batches consisted of coarse 3–5 mm and micronised 78%,
.
0.3–0.1 mm particle sizes. The chemical composition of the crude fish meal met the specification of Norse-LT94w as defined by the Norwegian Herring Oil and Meal Industry Research Institute.
Ž .
Each protein particle size was tested at three protein levels 30%, 35%, and 45% at a
Ž .
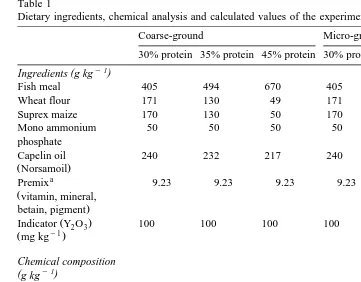
Table 1
Dietary ingredients, chemical analysis and calculated values of the experimental diets
Coarse-ground Micro-ground
30% protein 35% protein 45% protein 30% protein 35% protein 45% protein
y1
( )
Ingredients g kg
Fish meal 405 494 670 405 494 670
Wheat flour 171 130 49 171 130 49
Suprex maize 170 130 50 170 130 50
Mono ammonium 50 50 50 50 50 50
phosphate
Capelin oil 240 232 217 240 232 217
ŽNorsamoil.
a
Premix 9.23 9.23 9.23 9.23 9.23 9.23
Žvitamin, mineral,
Fat Soxhlet 241 263 269 280 287 282
Ash 65 79 110 69 79 105
Water 78 31 58 93 72 61
b
Rest 312 238 107 257 176 107
Calculations
y1 c
Ž .
Gross energy MJ kg 22.1 23.7 23.3 22.6 23.5 23.5
y1 d
Ž .
Starch g kg 216 165 63 216 165 63
a Ž . Ž .
Vitamins and minerals according to or higher than recommended by NRC 1993 . Betain 78.6% : 0.128% of diet; Charphyll pink: 0.3581% of diet.
b Ž .
RestsNFEs100yproteinqfatqashqwater .
c
Calculated using the following values: Fat: 39.5 MJ kgy1, Protein: 23.7 MJ kgy1, Carbohydrate: 17.2 MJ
kgy1. d
Calculated based on the prescription using 57% starch in wheat flour and 70% starch in suprex maize.
2.3. Fish sampling and sample treatment
Ž .
The fish was labelled intraperitoneally with a passive integrated transponder PIT tag
ŽBioSonics, Seattle, WA, USA. ŽCohen et al., 1989 4 weeks before the experiment.
started. Prior to the experiment, feed was withheld for 4 days. Three samples each of five individuals were randomly removed and used for initial whole body analysis of fat and protein. The remaining 18 fish per tank were then weighed individually, and the corresponding PIT tag recorded. At the end of the experiment, faeces was stripped from
Ž .
( )
H. SÕeier et al.rAquaculture 185 2000 101–120 105
Ž
for analyses of fat in cutlet according to the Norwegian quality cut NQC, NS 9401,
.
1994 and measurement of body traits.
For measurement of fractional protein synthesis rate, a modification of Garlick’s
Ž .
method was used Garlick et al., 1980 . The remaining fish were fed for 2 weeks. From each tank four to six fish were kept in ice water for 5 min before weighing and injected
U y1 14 Ž
intraperitonally with 2 mCi 100 g body weight C-L-lysine Du Pont de Nemours,
.
Belgium . Two or three fish from each tank were killed by a blow on the head 2 or 4 h after isotope injection. A muscle sample was removed from a segment of the epaxial muscle under the dorsal fin and immediately frozen. Epaxial muscle tissue samples were
Ž .
analysed for radioactivity in both trichloroacetic acid TCA soluble and non-soluble fractions, and values obtained were used to calculate protein deposition and efficiency of protein synthesis. The dose and sampling time were determined in a preliminary experiment to detect the period of time where there was a linear incorporation of
14
C-L-lysine, using fish from the same batch as the experimental fish. The sample was also used for analysis of RNA, DNA and water soluble protein.
All samples for chemical analysis were taken as pooled samples per tank except RNA, DNA, soluble protein and14C-lysine which was analysed on an individual basis.
2.4. Chemical analyses
The diets were analysed in duplicate for dry matter, protein, fat and ash. Protein
ŽN=6.25 in feeds was determined colorimetrically in micro Kjeldahl digests according. Ž .
to Crooke and Simpson 1971 . Fat was determined gravimetrically after extraction with ethyl acetate, dry matter after drying at 1058C for 24 h and ash after combustion at 5508C for 16 h. Protein in fish and faeces was analysed with a nitrogen gas analysator
ŽPerkin Elmer Series II Nitrogen analyzer 2410. according to the manufacturer’s
Ž .
manual. Fat in the cutlet NQC and faeces was analysed gravimetrically after extraction
Ž .
with ethyl acetate. Yttrium oxide Yt O2 3 in feed and faeces was analysed using ICP-MS by the Institute of Nutrition, Directorate of Fisheries, Bergen, Norway. RNA
Ž . Ž .
and DNA were measured according to Boer 1975 and Raae et al. 1988 using ethidium bromide. Water soluble protein in the same samples were measured essentially
Ž .
by Biuret method Dawson et al., 1986 .
Isotope activity was measured in muscle homogenates, in the precipitate and in the supernatant after treatment with 20% TCA. The samples were solubilised in Soluene-350 overnight and counted in a scintillation counter in Hi Ionic Fluor according to Berge et
Ž .
al. 1994 .
2.5. Calculation and statistics
Ž .
Specific growth rate SGR was calculated as:
SGRs100 lnW
Ž
ylnW.
ny12 1
where W and W are the initial and final weight, respectively, and n is the number of1 2
Ž . Ž .
Feed intake FI was calculated as Helland et al., 1996 :
FIs
Ž
feed offered.
yŽ
feed collected. Ž
corrected for dry matter loss.
=
Ž
collection efficiency.
y1 Ž .Feed conversion ratio FCR was calculated as:
y1
FCRsFI B
Ž
2qBdeadyB1.
where B and B are the biomass at the start and end, respectively, and B1 2 dead is the biomass of the dead fish.
Ž .
Dressing out percentage DOP was calculated as:
DOPs
ž
1yŽ
BW BWy1.
/
100 gutted unguttedwhere BWgutted and BWungutted are the weights of gutted and ungutted unbled fish, respectively.
Ž .
Productive protein value PPV was calculated as:
PPVs
Ž
P2yP PI1.
y1where P and P are estimates of protein content of the biomass at the start and end of1 2
the experiment and PI is the protein intake.
Ž .
Productive energy value PEV was calculated as:
PEVs
Ž
E yE EI.
y1 2 1where E and E are estimates of energy content of the biomass at the start and end of1 2
the experiment, and EI is the energy intake.
Ž .
Apparent digestibility AD was calculated as:
y1
ADs100 1
ž
yŽ
IfeedNfaeces. Ž
IfaecesNfeed.
/
where Ifeedand Ifaeces are the concentrations of marker in the feed and faeces, and Nfeed
Ž
and Nfaecesare the nutrient concentrations in the feed and faeces, respectively Austreng,
.
1978 .
Protein synthesis efficiency was calculated as incorporation of14C-Lys into muscle
Ž . Ž .
tissue protein according to Garlick et al. 1980 and Carter et al. 1993 .
()
H.
S
Õ
eier
et
al.
r
Aquaculture
185
2000
101
–
120
107
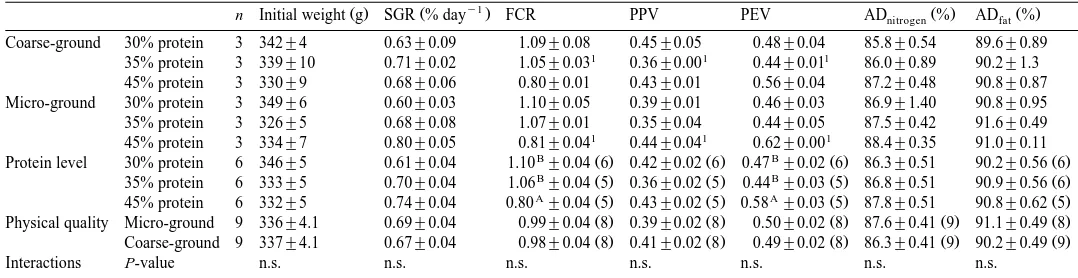
Table 2
Ž .
Growth and feed utilisation expressed as SGR, FCR, PPV, PEV, apparent digestibility of nitrogen and fat ADnitrogenand ADfat . Values are presented for the ground grades as mean"s.e., for protein level and physical quality as least squares means"SEM
y1
Ž . Ž . Ž . Ž .
n Initial weight g SGR % day FCR PPV PEV ADnitrogen % ADfat %
Coarse-ground 30% protein 3 342"4 0.63"0.09 1.09"0.08 0.45"0.05 0.48"0.04 85.8"0.54 89.6"0.89
1 1 1
35% protein 3 339"10 0.71"0.02 1.05"0.03 0.36"0.00 0.44"0.01 86.0"0.89 90.2"1.3 45% protein 3 330"9 0.68"0.06 0.80"0.01 0.43"0.01 0.56"0.04 87.2"0.48 90.8"0.87 Micro-ground 30% protein 3 349"6 0.60"0.03 1.10"0.05 0.39"0.01 0.46"0.03 86.9"1.40 90.8"0.95 35% protein 3 326"5 0.68"0.08 1.07"0.01 0.35"0.04 0.44"0.05 87.5"0.42 91.6"0.49
1 1 1
45% protein 3 334"7 0.80"0.05 0.81"0.04 0.44"0.04 0.62"0.00 88.4"0.35 91.0"0.11
B Ž . Ž . B Ž . Ž .
Protein level 30% protein 6 346"5 0.61"0.04 1.10 "0.04 6 0.42"0.02 6 0.47 "0.02 6 86.3"0.51 90.2"0.56 6
B Ž . Ž . B Ž . Ž .
35% protein 6 333"5 0.70"0.04 1.06 "0.04 5 0.36"0.02 5 0.44 "0.03 5 86.8"0.51 90.9"0.56 6
A Ž . Ž . A Ž . Ž .
45% protein 6 332"5 0.74"0.04 0.80 "0.04 5 0.43"0.02 5 0.58 "0.03 5 87.8"0.51 90.8"0.62 5
Ž . Ž . Ž . Ž . Ž .
Physical quality Micro-ground 9 336"4.1 0.69"0.04 0.99"0.04 8 0.39"0.02 8 0.50"0.02 8 87.6"0.41 9 91.1"0.49 8
Ž . Ž . Ž . Ž . Ž .
Coarse-ground 9 337"4.1 0.67"0.04 0.98"0.04 8 0.41"0.02 8 0.49"0.02 8 86.3"0.41 9 90.2"0.49 9
Interactions P-value n.s. n.s. n.s. n.s. n.s. n.s. n.s.
1
Ž . Ž .
Protein degradation rate Kd sKSyK ; Muscle massg s whole body wet weight
Ž . Ž .Ž .
60% Lied, pers.med. ; Protein synthesised: KS muscle mass . Protein catabolismsProtein anabolismyK .d
Ž .Ž .
Deposited proteins muscle mass K .d
Ž .
Relative protein synthesis efficiency: Deposited proteinrprotein synthesised 100. Relative amino acid incorporation rate per hour on tank level was calculated as:
pmol 14C lysine ypmol 14C lysine 2y1.
Ž
4 h 2 h.
For correlation of the individual relative amino acid incorporation rate with the individual SGR, the relative amino acid incorporation per hour was calculated as:
pmol 14C lysine 2y1and pmol 14
C lysine 4y1.
Ž
2 h.
Ž
4 h.
The specific RNA activity was calculated as:
Relative amino acid incorporation rate per hour RNAy1.
Ž
.
All data related to feed levels were statistically processed by a general linear model
ŽGLM procedure. The data were tested for interaction between protein level and protein.
particle size; when no interaction effects was found, it was removed from the model.
Ž .
Where significant P-0.05 differences were achieved a Tukey HSD multiple range test was used to rank the means. All data are presented as average"SEM. Regression analysis of individual data was performed using simple regression tested for best-fitted
Ž
model. Multiple regression was tested. The software Statgraphics, version 3.1 Statistical
.
Graphics, Manugistics, MD, USA. was used.
3. Results
3.1. Fish meal and diet quality
The chemical and biological quality of the fish meal used in the experiments met the
w Ž
specifications of Norse-LT 94 defined by the Norwegian Herring Oil and Meal
( )
H. SÕeier et al.rAquaculture 185 2000 101–120 109
Table 3
Ž .
Body composition expressed as DOP, protein in whole fish, fat in cutlet NQC and change in body fat per kilogram of growth. Values are present for the ground grades as mean"S.E., for protein level and physical quality as mean"SEM Coarse-ground 30% protein 3 10.6"1.1 16.9"0.1 9.8"0.6 13.5"3.1 35% protein 3 11.4"0.2 16.7"0.1 9.6"0.4 9.8"0.6 45% protein 3 11.2"0.2 17.2"0.2 8.7"0.6 8.5"2.0 Micro-ground 30% protein 3 10.4"0.4 16.1"0.4 10.4"0.6 15.1"0.9 35% protein 3 10.6"0.8 16.6"0.1 9.9"0.3 11.6"1.7
Physical quality Micro-ground 9 10.4"0.4 16.5 "0.1 10.2"0.3 10.6"1.0
B
Coarse-ground 9 11.1"0.4 16.9 "0.1 9.4"0.3 13.0"1.0
Interactions P-value n.s. n.s. n.s. n.s.
Significant differences within protein levels are denoted with capital letters and between protein levels with small letters.
.
Industry Research Institute, Bergen, Norway except for slightly lower protein and higher ash content due to the higher bone content from the herring by-product used as
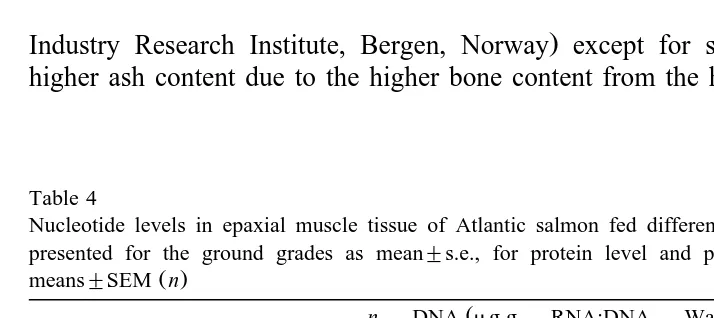
Table 4
Nucleotide levels in epaxial muscle tissue of Atlantic salmon fed different experimental diets. Values are presented for the ground grades as mean"s.e., for protein level and physical quality as least squares
Ž .
means"SEM n
Ž
n DNA mg g RNA:DNA Water soluble Specific RNA
y1.
muscle ratio protein:RNA activity
y1 y1
Žmgmg . Žpmol hmg .
Coarse-ground 30% protein 3 5.7"1.3 7.3"2.5 4.1"0.7 0.04"0.04 35% protein 3 7.1"0.8 4.2"0.5 8.3"3.0 0.05"0.02
Physical quality Micro-ground 9 7.0"0.6 4.0"0.8 4.7"1.1 8 0.08"0.015
Ž .
Coarse-ground 9 6.2"0.6 6.2"0.8 5.8"1.1 8 0.04"0.015
Interactions P-value n.s. n.s. n.s. n.s.
Ž .
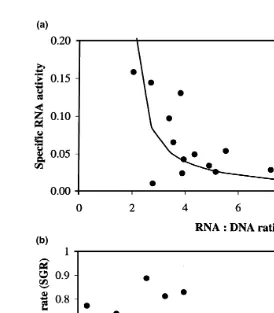
Fig. 2. a Correlation between RNA concentration in muscle expressed as RNA:DNA ratio and the specific
14 Ž y1.
RNA activity measured as the incorporation of C-L-lysine into muscle protein per unit RNA pmolmg
Ž Ž .y1 . Ž . Ž y1.
Ys1y17.71q10.74 X , rs0.575, Ps0.019 . b Specific RNA activity vs. SGR % day . All data on tank levels.
the raw material source. The experimental diets showed no major difference between
Ž .
calculated and analysed values Table 1 .
3.2. Growth and feed utilisation
Growth and feed utilisation data are presented in Table 2. Fish body weight increased
Ž .
by about 90% on average during the experiment. SGR and protein retention PPV data were not affected by dietary protein level or fish meal particle size. FCR and energy
Ž .
retention PEV data were significantly affected by dietary protein level, but not fish
Ž . Ž y1. Ž y1. Ž .
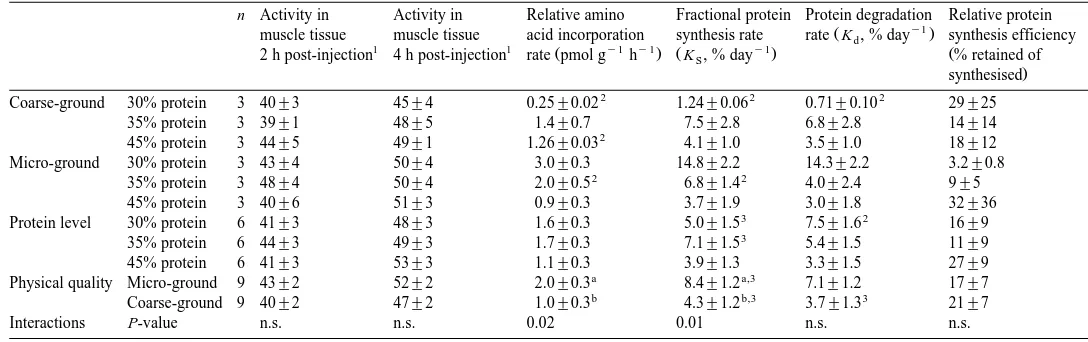
Fig. 3. a Specific RNA activity pmol mg vs. SGR % day achieved using individual data. b
Ž y1. Ž
RNA:DNA ratio vs. specific RNA activity pmol mg using individual data Ys0.277y0.186 Xq
2 3 . Ž . Ž
0.041 X y0.0028 X , rs0.785, Ps0.000 . c Water soluble protein:RNA vs. specific RNA activity pmol
y1. Ž 0.553 .
( )
()
Incorporation of amino acids in terms of14C-L-lysine in epaxial muscle tissue of Atlantic salmon fed experimental diets. Values are presented for the ground grades as
mean"s.e., for protein level and physical quality as mean"SEM
n Activity in Activity in Relative amino Fractional protein Protein degradation Relative protein
y1
Ž .
muscle tissue muscle tissue acid incorporation synthesis rate rate K , % dayd synthesis efficiency
1 1 Ž y1 y1. Ž y1. Ž
2 h post-injection 4 h post-injection rate pmol g h K , % dayS % retained of
.
Interactions P-value n.s. n.s. 0.02 0.01 n.s. n.s.
Significant differences between physical qualities are denoted with small letters.
( )
H. SÕeier et al.rAquaculture 185 2000 101–120 113
Ž .
meal particle size. The higher the dietary protein and energy level, the lower the FCR value observed. Digestion of nitrogen and fat was not affected by protein level or fish meal particle size. There was no correlation between initial weight and SGR achieved in
Ž .
this experiment Fig. 1 .
3.3. Body traits
The body trait data are listed in Table 3. Whole body protein content was not influenced by the protein level, but there were significantly higher protein levels in the group fed the coarse-ground fish meal. Whole body fat deposition was not affected by
Ž .
the protein level or fish meal particle size. DOP and fat in cutlet NQC showed no significant effect of protein level or fish meal particle size.
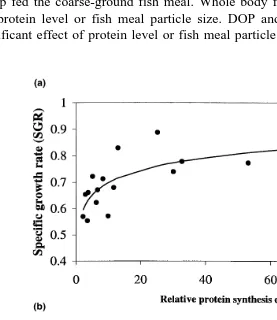
Ž . Ž . Ž y1. Ž
Fig. 4. a Relative protein synthesis efficiency % vs. SGR % day Ys0.542q0.068 ln X, rs0.741,
. Ž . Ž Ž .y1. Ž y1. Ž
Ps0.001 . b Relative amino acid incorporation rate pmol g t vs. SGR % day Ys0.827y0.144 X,
.
3.4. Nucleic acids and protein turnoÕer
The amount of RNA expressed as the RNA:DNA ratio and specific RNA activity was
Ž .
not influenced by fish meal particle size or protein level Table 4 . There was a
Ž .
correlation between specific RNA activity and RNA:DNA ratio Fig. 2a until the RNA:DNA ratio reached a level of about 4. Beyond an RNA:DNA ratio of 4, there were only minor changes. There was no correlation between the specific RNA activity and
Ž .
SGR Fig. 2b .
Regression analysis using the individual data showed no correlation between specific
Ž .
RNA activity and SGR Fig. 3a . However, a high correlation between specific RNA
Ž .
activity and RNA:DNA ratio up to an RNA:DNA ratio of about 3 Fig. 3b was observed. A high correlation between the specific RNA activity and water soluble
Ž .
protein:RNA ratio as an index of ribosomal activity was found Fig. 3c .
3.5.14C-lysine incorporation and protein turnoÕer
The relative efficiency of protein synthesis measured as incorporation of14C-L-Lys,
Ž .
was not influenced by protein level or the fish meal particle size Table 5 . There was,
Ž .
however, a high correlation with growth Fig. 4a . Dietary protein level did not affect the incorporation of 14C-L-Lys into muscle, but there was a significant effect on the
Ž .
physical qualities of the fish meal Table 5 . Using data from individual fish, a negative
14 Ž .
correlation between SGR and C-L-Lys incorporation rate was observed Fig. 4b .
4. Discussion
In the present experiment, normal growing fish, which were offered feed in excess, was studied. Although the overall growth performance may be considered as acceptable, a large variation in individual growth rate was observed, which did not correlate to the
Ž .
initial weight Fig. 1 . Normally, a negative correlation between SGR and fish size would be expected; fish with a low SGR may therefore be considered as slow growers. A large variation in individual growth rate have also been reported by McCarthy et al.
Ž1992 and Houlihan et al. 1993 . More differentiated information may therefore be. Ž .
generated when analysis is done on an individual level in addition to tank or treatment level.
The SGR was slightly, although not significantly, lower in fish fed the 30% protein
Ž .
diet as compared to those fed the 35% and 45% protein diets. Sveier et al. 1999 found no such effect using the same high and low dietary protein levels, but they used larger
Ž .
fish initial weight of about 700 g . This may indicate that 35% dietary protein for salmon weighing 300 g or higher is sufficient to support maximum growth. The lack of enhanced growth in salmon fed the coarse-ground fish meal is in agreement with Sveier
Ž . Ž .
( )
H. SÕeier et al.rAquaculture 185 2000 101–120 115
The feed conversion rate is in accordance with results previously reported for salmon
Ž .
of a similar body size Juell et al., 1994; Aksnes, 1995; Sveier et al., 1999 . Dietary protein level, but not fish meal particle size, significantly affected FCR. It may be argued whether this is a dietary energy effect or due to a change in the
protein:carbo-Ž . Ž . Ž .
hydrate ratio. Hillestad and Johnsen 1994 , Aksnes 1995 and Wathne 1995 have previously demonstrated a reduced FCR with increased dietary energy levels. Using the
Ž .
same low and high protein diets as in the present experiment, Sveier et al. 1999 showed that the higher FCR found in the low protein group was mainly caused by a lower dietary energy level.
The lack of effect on the PPV of the coarse-ground fish meal as compared to a finely
Ž . Ž .
ground meal disagrees with the findings of dos Santos et al. 1993 . Sveier et al. 1999 found no effect on the PPV using different protein levels or fish meal particle sizes. dos
Ž .
Santos et al. 1993 used moist pellets in which the protein source was not denaturated. Denaturation of the protein molecule destroys the tertiary protein structure and exposes the polypeptide chain for more efficient protolytic degradation. This may be one reason for the lack of agreement between the results found in the present study and those of dos
Ž .
Santos et al. 1993 .
The fat content of all experimental diets were the same. The protein sparing effect of energy is related to fat. PEV was significantly higher in the high protein group as compared to the two other dietary protein levels. This may indicate that the high protein diet contained more energy than needed to support maximum growth. The higher energy level in the diet was not fully compensated with decreasing FCR. The fish did not fully compensate for the lower dietary protein level with increased feed intake. As long as SGR did not correlate to protein intake, the results showed a protein sparing effect of
Ž .
starch. This is similar to the results obtained by Hemre et al. 1995 .
Nitrogen or fat digestibility was not influenced by fish meal particle size or fish meal
Ž .
level. Sveier et al. 1999 reported a reduced digestibility of fat in the coarse meal as
Ž . Ž .
compared to the micro-ground fish meal. Aksnes 1995 and Hemre et al. 1995 found a significant reduction in fat digestibility, but not in protein digestibility when the starch
Ž .
level was 22% or higher. Hemre et al. 1995 , however, used smaller fish held at a lower water temperature.
Whole body protein level was significantly higher in the fish fed the coarse-ground fish meal as compared to those fed the micro-ground fish meal. This may indicate a higher protein retention although the PPV value was not significantly different. The reason for this is unclear. DOP, whole body fat deposition, and fat in cutlet, were not influenced by dietary treatment. Although the fish nearly doubled their body weights, a 12-week growth period is too short a period to expect significant changes in body traits when feeding diets with relative small differences in energy content.
4.1. Protein turnoÕer
water soluble protein:RNA ratio, and relative efficiency of protein synthesis. Net protein deposited is the difference between protein anabolism and catabolism. The extent of protein synthesis or anabolism correlates to the amount of active RNA species in the cell. In addition, the cellular content of amino acids and factors regulating gene activity
Že.g., endocrine factors affects protein synthesis. The quantity of RNA or the RNA:DNA.
ratio reflects the gene transcription capacity of the cells. The total amount of RNA may be difficult to standardise while the RNA:DNA ratio refers to the RNA content per cell, as the cellular DNA content is constant. The amount of RNA has been used as an index
Ž . Ž
of growth in fish larvae Raae et al., 1988 and in several fish species Bulow, 1987;
.
Houlihan et al., 1993 . Large differences in the efficiency of RNA content, as correlated
Ž .
to growth, have been reported Houlihan, 1991 .
In the present study, protein synthesis has been measured as the incorporation rate of
14
C-L-Lys into muscle protein. Some assumptions have been made in the calculation of
protein synthesis. Specific activity of lysine was not analysed in the present experiment, but as lysine is absolutely essential, it is not transaminated into other amino acids
ŽJungermann and Møhler, 1980 . Excess lysine may, however, be metabolised into.
carbon containing metabolites, which may be reutilized for dispensable amino acids synthesis. This may be incorporated into protein and thereby give an overestimation of the lysine incorporation in the TCA precipitate. Any14C containing metabolic products of 14C-Lys may be overlooked, consider the short time from injection to sampling
Žmaximum 4 h . Owen et al. 1999 have summarised the assumptions for using labeled. Ž . Ž .
amino acid incorporation as a measurement for protein synthesis: 1 that the presence of the high intracellular concentration of a single amino acid does not itself affect the rate
Ž .
of protein synthesis; 2 that the labeled amino acid equilibrates rapidly with the
Ž .
intercellular free pool; 3 that the enrichment of the intercellular free poll remains
Ž .
elevated and stable over the incorporation time or shows a slow linear decline; and 4 that the enrichment of body protein with the labelled amino acids is linear over the incorporation time. All this assumptions have been taken into consideration when
Ž .
modifying the flooding dose method described by Garlick et al. 1980 .
On treatmentrgroup level, no significant effects of protein level or physical qualities on the nucleotide and protein turnover parameters examined were found except for the amino acid incorporation rate. On the other hand, there was no effect on growth rate,
Ž
which should be the net result of any change in nucleotide and protein turnover Bulow,
.
1987; Houlihan et al., 1993; de la Higuera et al., 1998; Valente et al., 1998 .
The RNA:DNA ratio as an indicator of protein synthesis potential and growth may be
Ž . Ž .
argued. Yang and Dick 1993 , Bergeron and Boulhic 1994 and Mclaughlin et al.
Ž1995 found a poor correlation between RNA:DNA ratio and growth. On the other.
Ž . Ž . Ž .
hand, Sveier and Raae 1992 , Foster et al. 1993 , Grant 1996 , and Rooker and Holt
Ž1996 found a positive correlation. Mclaughlin et al. 1995 concluded that it was. Ž .
difficult to measure any short time affect on growth using the RNA:DNA ratio. In the present experiment, the specific RNA activity did not change when the
Ž . Ž .
( )
H. SÕeier et al.rAquaculture 185 2000 101–120 117
Ž .
protein:RNA in the cell Fig. 3c which clearly shows the correlation between the two
Ž .
methods for measurement of protein synthesis. Goldspink and Kelly 1984 used RNA:water soluble protein as an index of the ribosomal capacity for protein synthesis. The results from the present experiment support their results. Growth or weight increase is, however, not necessarily correlated with the specific RNA activity or ribosomal capacity as shown in the present study.
Ž .
The specific RNA activity Figs. 2b and 3a gave only poor or no correlation with
Ž .
SGR, but the relative efficiency of protein synthesis correlated well with SGR Fig. 4a . The results showed that with increasing protein synthesis efficiency, the increase in SGR
Ž .
was reduced Fig. 4a . This indicates that an increase in relative protein synthesis
Ž .
efficiency was mainly caused by a decrease in protein catabolism. Carter et al. 1993 found a positive correlation between RNA content and growth using fewer fish.
Ž .
Sveier et al. 1999 reported a slower gastric evacuation time when using
coarse-Ž .
ground compare to micro-ground fish meal t50s14.8 and 10.8 h, respectively . The uptake of 14C-L-lysine after intraperitonal injection may be considered as fast, 50% of
Ž .
the lysine was found in the muscle tissue 4-h post-injection Table 5 . The significantly higher relative amino acid incorporation rate found using micro-grounded fish meal
ŽTable 5 therefore might be due to a better relationship between the supply of amino.
acids arising from the digested meal and the intraperitonal injection of lysine into the
Ž .
muscle cells. This is supported by de la Higuera et al. 1998 , who found a significant affect of dietary amino acid absorption pattern on protein synthesis rate.
The data from individual fish of relative amino acid incorporation rate into muscle
Ž .
protein showed a weak negative correlation with SGR Fig. 4b . This indicates that no systematic correlation exists between protein synthesis measured over a period of 2 h and growth rate measured over 12 weeks in a fish population. The lack of correlation indicates that it is the protein catabolism and not the protein anabolism that is controlling the growth rate in fish. In the method used for measuring the amino acid incorporation rate, the 14C-L-Lys was not given in excess. This implicates that the
incorporation rate measured was a result of the given state of nutrition, genetical and endocrinological status of the fish, and not the maximum incorporation rate possible to achieve. In our opinion, the method used is suitable to detect any treatment effects.
Large variation in feed intake andror protein turnover within a fish population has
Ž . Ž .
been reported by McCarthy et al. 1992 and Houlihan et al. 1993 . Protein synthesis parameters as nucleotides or the flooding dose method done over a short period of time may therefore not be a good parameter for measurement of long-term growth.
5. Conclusion
present experiment indicates that growth rate is mainly controlled by protein catabolism and to a lesser degree by protein anabolism.
Acknowledgements
Marinne Kaland Gjesdal and Leif Pedersen are thanked for taking care of the experimental fish in a conscientious way. The skilled analytical assistance of Edel Erdal, Anita Birkenes and Bjørn Olav Kvamme is greatly appreciated. The authors are grateful to Marit Espe for valuable discussions and comments on the manuscript.
References
Aksnes, A., 1995. Growth, feed efficiency and slaughter quality of salmon, Salmo salar L., given feeds with different ratios of carbohydrate and protein. Aquacult. Nutr. 1, 241–248.
Austreng, E., 1978. Digestibility determination in fish using chromic oxide marking and analysis of contents from different segments of the gastrointestinal tract. Aquaculture 13, 265–272.
Berge, G.E., Lied, E., Espe, M., 1994. Absorption and incorporation of dietary free and protein bound
ŽU14C -lysine in Atlantic cod Gadus morhua . Comp. Biochem. Physiol. 109A, 681–688.. Ž .
Bergeron, J.P., Boulhic, M., 1994. RNA–DNA ratio and evaluation of the nutritional state and growth rate of
Ž .
saltwater fish larvae — experimental analysis of the Dover sole Solea solea L. . ICES J. Mar. Sci. 51, 181–190.
Boer, G.J., 1975. A simplified microassay of DNA and RNA using ethidium bromide. Anal. Biochem. 65, 225–231.
Boirie, Y., Dangin, M., Gachon, P., Vasson, M.-P., Maubois, J.-L., Beufrere, B., 1997. Slow and fast dietary`
proteins differently modulate postprandial protein accretion. Proc. Natl. Acad. Sci. 94, 14930–14935. Bulow, F.J., 1987. RNA–DNA ratios as indicators of growth in fish: a review. In: Summerfelt, R., Hall, G.
ŽEds. , Age and Growth of Fish. Iowa State Univ. Press, Ames, IA, pp. 45–64..
Carter, C.G., Houlihan, D.F., Buchanan, B., Mitchell, A.I., 1993. Protein–nitrogen flux and protein growth
Ž .
efficiency of individual Atlantic salmon Salmon salar L. . Fish Physiol. Biochem. 12, 305–315. Cohen, S.A., Meys, M., Tarvin, T.L., 1989. The Pico-Tag R Method. Millipore, Millford, MA, USA, 123 pp. Crooke, W.M., Simpson, W.E., 1971. Determination of ammonium in Kjeldahl digest of crops by an
automated procedure. J. Sci. Food Agric. 22, 9–10.
Dawson, R.M.C., Elliott, D.C., Elliott, W.H., Jones, K.M., 1986. In: Data for Biochemical Research.. Clarendon Press, Oxford, p. 542.
de la Higuera, M., Garzon, A., Hidalgo, M.C., Peragon, J., Cardenete, G., Lupianez, J.A., 1998. Influence of´ ´ ´˜
temperature and dietary-protein supplementation either with free or coated lysine on the fractional protein-turnover rates in the white muscle of carp. Fish Physiol. Biochem. 18, 85–95.
Ž
dos Santos, J., Burkow, I.C., Jobling, M., 1993. Patterns of growth and lipid deposition in cod Gadus morhua
.
L. fed natural pray and fish based feeds. Aquaculture 100, 173–189.
dos Santos, J., Jobling, M., 1991. Gastric emptying in cod, Gadus morhua L.: emptying and retention of indigestible solids. J. Fish Biol. 28, 187–197.
Espe, M., Haaland, H., Njaa, L.R., 1992. Autolysed fish silage as a feed ingredient for Atlantic salmon
ŽSalmon salar . Comp. Biochem. Physiol. 103A, 369–372..
Ž .
Espe, M., Lied, E., 1994. Do Atlantic salmon Salmo salar utilize mixture of free amino acids to the same extent as intact protein sources for muscle protein synthesis? Comp. Biochem. Physiol. 107A, 249–254.
Ž .
( )
H. SÕeier et al.rAquaculture 185 2000 101–120 119
Foster, A.R., Houlihan, D.F., Hall, S.J., 1993. Effects of nutritional regime on correlates of growth rate in
Ž .
juvenile Atlantic cod Gadus morhua . Comparison of morphological and biochemical measurements. Can. J. Fish. Aquat. Sci. 50, 502–512.
Garlick, P.J., McNurlan, M.A., Preedy, V.R., 1980. A rapid and convenient technique for measuring the rate of protein synthesis in tissues by injection of3H phenylalanine. Biochem. J. 217, 507–516.
Goldspink, D.F., Kelly, F.J., 1984. Protein turnover and growth in the whole body, liver and kidney of the rat from the foetus to senility. Biochem. J. 217, 507–516.
Grant, G.C., 1996. RNA–DNA ratios in white muscle tissue biopsies reflect recent growth rates of adult brown trout. J. Fish Biol. 48, 1223–1230.
Helland, S.J., Grisdale-Helland, B., Nerland, S., 1996. A simple method for the measurement of daily feed intake of groups of fish in tanks. Aquaculture 139, 157–163.
Hemre, G.-I., Sandnes, K., Lie, Ø., Torrissen, O., Waagbø, R., 1995. Carbohydrate nutrition in Atlantic salmon, Salmon salar L.: growth and feed utilization. Aquacult. Res. 26, 149–154.
Hillestad, M., Johnsen, F., 1994. High-energyrlow protein diets for Atlantic salmon: effects on growth, nutrient retention and slaughter quality. Aquaculture 124, 109–116.
Ž .
Houlihan, D.F., 1991. Protein turnover in ectotherms and its relationship to energetic. In: Gilles, R. Ed. , Advances in Comparative and Environmental Physiology 7 Springer-Verlag, Berlin, pp. 1–43.
Houlihan, D.F., Mathers, E.M., Foster, A., 1993. Biochemical correlations of growth rate in fish. In: Rankin,
Ž .
J.C., Jensen, F.B. Eds. , Fish Ecophysiology. Chapman & Hall, London, pp. 45–71.
Jobling, M., 1986. Gastrointestinal overload — a problem with formulated feeds? Aquaculture 51, 257–263. Jobling, M., 1988. A review of the physiological and nutritional energetics of cod, Gadus morhua L., with
particular reference to growth under farmed conditions. Aquaculture 70, 1–19.
˚
Juell, J.E., Bjordal, A., Ferno, A., Huse, I., 1994. Effect of feeding intensity on food intake and growth of¨
Atlantic salmon, Salmo salar L., in sea cages. Aquacult. Fish. Manage. 25, 453–464. Jungermann, Møhler, 1980. Biochemie. Springer-Verlag, Berlin.
Lyndon, A.R., 1990. Protein synthesis in fish in relation to oxygen consumption and free amino acids. PhD thesis. University of Aberdeen, 98 pp.
McCarthy, I.D., Carter, C.G, Houlihan, D.F., 1992. Individual variation in consumption in rainbow trout using
Ž .
radiography. In: Kaushik, S.J., Luquet, P. Eds. , Fish Nutrition in Practice. INRA, Paris, pp. 85–88. Mclaughlin, R.L., Ferguson, M.M., Noakes, D.L.G., 1995. Concentrations of nucleic acids and protein as
Ž .
indices of nutritional status for recently emerged brook trout SalÕelinus fontinalis . Can. J. Fish. Aquat.
Sci. 54, 848–854.
NRC, 1993. Nutrient Requirements of Fish. National Academy Press, Washington, DC.
NS 9401, 1994. Atlantic salmon. Reference sampling for quality measurements. Norges Standardiseringsfor-bund, Postboks 7020 Homansbyen, 0306 Oslo, Norway.
Owen, S.F., McCarthy, I.D., Watt, P.W., Ladero, V., Sanchez, J.A., Houlihan, D.F., Rennie, M.J., 1999. In
Ž .
vivo rates of protein synthesis in Atlantic salmon Salmo salar L. smolts determined using a stable isotope flooding dose technique. Fish Physiol. Biochem. 20, 87–94.
Raae, A.J., Opstad, I., Kvenseth, P., Walther, B., 1988. RNA, DNA and protein during early development in
Ž .
feeding and starved cod larvae Gadus morhua L. . Aquaculture 71, 231–247.
Rooker, J.R., Holt, G.J., 1996. Application of RNA–DNA ratios to evaluate the condition and growth of larval
Ž .
and juvenile red drum Sciaenops ocellatus . Mar. Freshwater Res. 47, 283–290.
Ž .
Schuhmacher, A., Wax, C., Gropp, J.M., 1997. Plasma amino acids in rainbow trout Oncorhynchus mykiss fed intact protein or a crystalline amino acid diet. Aquaculture 151, 15–28.
Sveier, H., Hølland, P.M., Krogedal, P., 1997. A rapid and simple method for quantification of excess of feed
Ž .
from experimental tanks. In: First Cost 827 Workshop on Voluntary Food Intake in Fish. Aberdeen, Scotland.
Ž .
Sveier, H., Raae, A.J., 1992. Optimal timing for first feeding in Atlantic salmon Salmo salar L. alevins; effect of different hatching substrates correlated to growth and RNA and DNA metabolism. Aquacult. Eng. 11, 93–106.
Sveier, H., Wathne, E., Lied, E., 1999. Growth, feed and nutrient utilisation and gastrointestinal evacuation
Ž .
time in Atlantic salmon Salmo salar L. ; the effect of dietary fish meal particle size and protein
Valente, L.M.P., Gomes, E.F.S., Fauconneau, B., 1998. Biochemical growth characterization of fast and slow-growing rainbow trout strains: effect of cell proliferation and size. Fish Physiol. Biochem. 18, 213–224.
Ž .
Wathne, E., 1995. Strategies for directing slaughter quality of farmed Atlantic salmon Salmo salar with emphasis on diet composition and fat deposition. Dr. Scient thesis 1995: 6, Agricultural University of Norway. ISSN 0802-3220.
Yang, X.W., Dick, T.A., 1993. Effects of dietary fatty acids on growth, feed efficiency and liver RNA and
Ž .