PRELIMINARY ESTIMATION OF POSTSEISMIC DEFORMATION PARAMETERS
FROM CONTINUOUS GPS DATA IN KOREA PENINSULA AND IEODO AFTER THE
2011 TOHOKU-OKI MW9.0 EARTHQUAKE
Wan Anom Wan Arisa*, Tajul Ariffin Musaa, Hungkyu Leeb, Yunsoo Choib, Hasu Yoonb
aUTM-Geomatics Innovation Research Group. Univerisiti Teknologi Malaysia, Malaysia bSchool of Civil, Environmental and Chemical Engineering, Changwon National University, Korea
Department of Geoinformatics, University of Seoul, Korea
KEY WORDS: Korea Peninsular, Tohoku-Oki earthquake, postseismic deformation.
ABSTRACT:
This paper describes utilization of GPS data in Korea Peninsula and IEODO ocean research station for investigation of postseismic deformation characteristic after the 2011 Tohoku-oki Mw9.0 Earthquake. Analytical logarithmic and exponential functions were used to evaluate the postseismic deformation parameters. The results found that the data in Korea Peninsula and IEODO during periods of mid-2011 – mid-2014 are fit better using logarithmic function with deformation decay at 134.5 ±0.1 days than using the exponential function. The result also clearly indicates that further investigation into postseismic deformation over longer data span should be taken into account to explain tectonic deformation over the region.
1. INTRODUCTION
The Mw=9.0 Tohuku earthquake of 11th March 2011 is considered
amongst the largest aftershocks ever recorded in Pacific coast of Northeastern Japan since a decade. Rupture along the ~500km (310 mi) fault zone was found start from the epicenter (38.297°N, 142.372°E) near the 129km of Sendai, Honshu, Japan and continuously towards the southwestward at a speed of about 2.5 km/s (Ammon et al. 2011). This earthquake caused significant coseismic deformation not only in the Japanese islands (Nishimura, 2011; but also on the Eurasia and Amuria continent ~ 3000 km away from the earthquake epicenter (Wang et al. 2011). Ha et al. (2014) and Ha et al. (2012) have found that Korea Peninsula moved 2.8 cm on average eastward due to the Tohoku-oki earthquake. The results were based on regional GPS stations measurement from 2000-2008, and March 11-18, 2011.
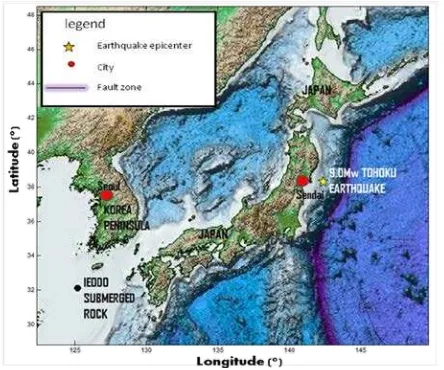
Figure 1. The location of 2011 9.0Mw earthquake epicenter (32.122N, 138.026E), ~1,310km from Seoul City, Korea Peninsula and ~1,530km from IEODO submerged rock.
The impact from the earthquake into tectonic deformation was continuously recorded by a network of CORS in Korea Peninsula and IEODO ocean research station in the East China Sea. The data did not record the significant displacement during the coseismic of the earthquake, but may capture the ongoing process of postseismic deformation in Northeast Asia after the 2011 Tohoku-oki earthquake. This paper describes an attempt to estimate postseismic deformation parameters for the 2011 Tohoku-oki event by utilizing GPS time-series analysis as produced by ten continuously operation reference stations (CORS) from the national geographic information institute of Korea (NGII) and IEODO ocean research stations (located approximately 149km southwest from Mara Island). Simple analytical logarithmic and exponential postseismic model were used to fit with the GPS time-series. This investigation provides a preliminary insight into seismic cycle and dynamics of Korea Peninsula and East China Sea in general.
2. DATA AND METHODS OF ANALYSIS
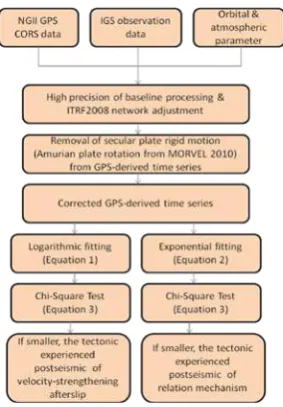
This section provides discussion on the data selection and methodology for quantifying postseismic deformation in Korea Peninsula after the effect of 2011 Tohoku-oki earthquakes. Figure 2 demonstrate work-flow of the work and description of the work is explained as follows;
2.1 GPS Data & High Precision Time Series Generation
stations. This data limitation of the NGII and IEODO stations has been explained in Lee et al. (2015).
Figure 2. Work-flow of the work.
Figure 3. Location of NGII GPS CORS Network.
The GPS data has been processed by using high precision processing technique adopting Quasi-Ionosphere-Free (QIF) strategy. The processing used three steps of processing. First step is data preparation for raw phase and pseudorange data, station initial coordinate, receiver and antenna information for each site, satellite orbits information and earth rotation parameters. Second, each parameter was modeled to solve phase ambiguity for the baseline vector estimation. Finally, geodetic daily positioning solution in terms of geocentric Cartesian coordinate (X, Y, Z) were determined for each NGII and IEODO stations by connecting the network to the IGb08. To this end, minimum constraint approach was performed by the use of thirty-five International GPS Service (IGS) stations globally distributed on the earth surface. Small global map in the Figure 4 illustrates distribution of GPS network used in the study.
In order to ensure that only post-seismic time series due to the 2011 Tohoku-oki earthquake for further tectonic analysis, the daily solution of GPS network in IGb08 consisting of in 1200 days is used for generating position time series has to be corrected by removing linear plate rigid motion parameter. This can be done by using parameter of rotation pole proposed by MORVEL 2010 (63.170oN, -122.820oE, 0.297o/Ma). The MORVEL model was calculated based on high-quality data such as earthquakes slip directions that averaged plate directions over decades to centuries, transform fault azimuths that averaged directions over hundreds of thousands of years, and spreading rates motion (DeMets et al. 2010).
The corrected coordinate time series were then plotted using in-house MATLAB programming scheme namely; GRBCRD in order to generate the postseismic time-series for the Tohoku-oki earthquake event. With the GRBCRD, daily position files in Cartesian coordinates were then converted to local planar coordinate (i.e., northing and easting in horizontal components and ellipsoidal height (up)). This will allow for plotting coordinate time series in both components separately. The
later for estimating the deformation parameter after the earthquake.
2.2 Co- and Postseismic Deformation Parameters Estimation
A non-linear minimization scheme using least-square estimation method was performed to estimate the postseismic deformation parameter simultaneously. Two types of postseismic process considered independently are; velocity-strengthening afterslip, which follows a logarithmic decay (Kreemer et al, 2006; Marone et al., 1991);
) / 1 ln( )
(t c a t τlog
u = + + (1)
and a relation mechanism, which follows an exponential decay (Kreemer et al., 2006; Savage and Prescott, 1978);
) 1 ( )
( t/τexp e a c t
u = + − − (2)
In (1) and (2), t is time since the earthquake, u(t) is the position (north and east), c is the total co- and postseismic offset, a is the amplitude associated with the decay, and
log
2.3 Statistical Analysis
Goodness-of-fit statistical test is a method that provides a useful measure of significance of the difference between two models. It was performed to evaluate the suitability of both postseismic processes for the earthquake event and to compares how well
two different models fit a set of data.
χ
2 is a sum of squares of weighted residuals defined as (Stein and Gordon, 1984) as follows;∑
= −= N
i m
m
i t u
i t u i t u
1
2 0
2
) ( ) (
)) ( ) ( ) ( ) ( (
χ
(3)
Where u(t)0 is the observation position of sitei, u(t)m is the
calculated position of site i from the postseismic model (logarithmic or exponential function models), and N is the total number of observations. A good model should have a minimum
reduced
χ
2which indicates the best fitting of deformationmodel estimation.
3. RESULTS AND ANALYSIS
This section provides results and analysis of the preliminary findings as follows;
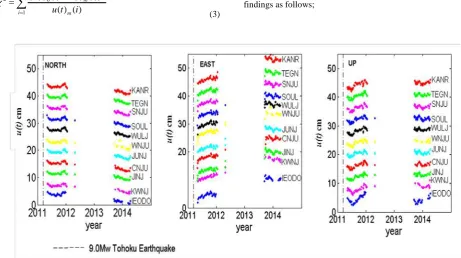
Figure 3: Daily time series of 3-dimensional coordinate of NGII and IEODO stations before removing linear plate motion.
Table 1. Postseismic parameter of logarithmic decay function
Site
Position in ITRF2008 Logarithmic1 terms
Lat (oN) Long (oE) C
1
east (cm)
C1north (cm) a
1
east (cm)
a1north (cm)
T1log
(days)
2
χ
1KANR 37.7709 128.8682 -1.555 0.233 0.809 0.722 164.197 1.765 TEGN 35.9063 128.8020 -1.386 0.399 0.932 0.309 131.581 1.121
SNJU 36.3792 128.1445 -1.287 0.264 0.786 0.223 129.639 1.059 SOUL 37.6297 127.0797 -1.600 0.214 0.729 0.202 116.558 1.733
WULJ 36.9920 129.4130 -1.533 0.201 0.897 0.713 161.301 0.649 WNJU 37.3372 127.9471 -1.504 0.154 0.862 0.325 129.248 3.077
JUNJ 35.8435 127.1351 -1.499 0.083 0.755 0.464 143.996 1.852 CNJU 36.6269 127.4612 -1.535 0.254 0.430 0.159 110.966 1.004
JINJ 35.1731 128.0497 -1.418 0.225 0.889 0.165 129.853 1.460 KWNJ 35.1784 126.9102 -1.525 0.327 0.626 0.116 111.052 1.703
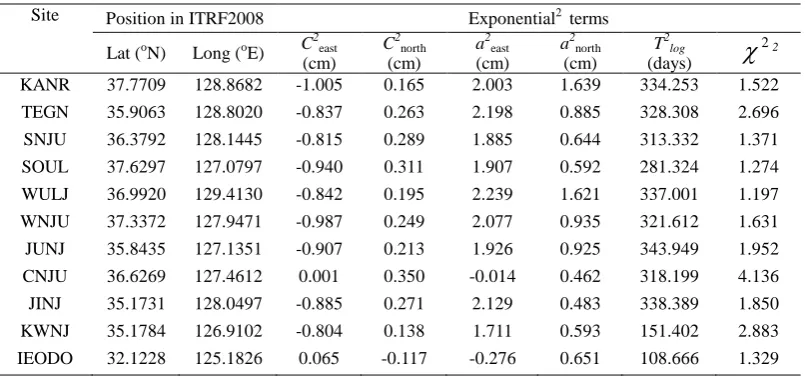
Table 2. Postseismic parameter of exponential decay function
Site Position in ITRF2008 Exponential2 terms
Lat (oN) Long (oE) C
3.1 GPS-derived Time Series Analysis
From the high-precision processing of daily solutions between 2011- mid-2014, ambiguity resolution showed results above 75%. Positional Root Means Square (RMS) error for all stations was below 1mm for horizontal components and between 1.5 and 2cm for the height components. Figure 3 shows daily solution (GPS-derived time series plot) resulted from NGII CORS in three components of East, North and Up (GRS80 ellipsoidal height). The accuracy of Up component does not meet the required geodetic specification, thus further geodynamics analysis will be mainly for horizontal.
3.2 Postseismic Deformation Parameter
Using the corrected daily solutions, the coordinate time series matched with the logarithmic and exponential functions. The postseismic parameters of logarithmic and exponential functions for each NGII and IEODO stations are shown in Table 1 and Table 2, respectively. During the calculation, the results shows
that the averaged
τ
log is 134.5 ± 0.1 days while,288.7±0.1days, respectively. Meanwhile, the estimated geodetic coseismic offsets and postseismic amplitudes for the earthquake range between stations from several centimeters to millimeters.
Based on the best matching component of logarithmic and exponential function above, the results indicated that postseismic parameters for each GPS site have different goodness-of-fit results. Station WNJU indicates the maximum chi-square value of logarithmic decay function. Meanwhile, CNJU produced the the highest chi-square value of exponential decay function. It can be suspected due to poor fitting model of the functional models for the data. The finding shows that the misfit in chi-square term was obtained for GPS coordinate time series using the models of logarithmic function that was 0.5 smaller than that of the exponential function.
This showed that for the 134.5 days after the earthquake, deformation mechanism was dominated by velocity-strengthening afterslip deformation due to the Tohoku-oki
This could indicate that the postseismic deformation of the Tohoku-oki earthquake was not only caused by a single mechanism of velocity-strengthening afterslip, but also influenced by the other mechanism of postseismic deformation, such as viscoelastic relation, for GPS data of 100days onwards.
4. CONCLUSION
This paper presents the analysis of the postseismic deformation parameter estimations from the GPS data in Korea Peninsula and IEODO submerged rock. The study demonstrates that the data enabled to estimate the postseismic deformation parameters. The results concluded that GPS data in Korea Peninsula and IEODO during the period of mid 2011 – mid-2014 are very well matched using logarithmic function with smaller average misfit of -2.1 times compared to matching using exponential function. The decay time of postseismic deformation of 134.5 days indicates that other mechanism of postseismic deformation should be taken into account rather than a single physical mechanism of afterslip only.
ACKNOWLEDGEMENTS
This research has been financially supported by Korea Hydrographic and Oceanographic Administration and the National Research Foundation of Korea (NRF-2014R1A1A2056133).
REFERENCES
Charles J. Ammon, Thorne Lay, Hiroo Kanamori, & Michael Cleveland 2011, A rupture model of the 2011 off the Pacific coast of Tohoku-oki Earthquake. Earth Planets Space, 63, 693– 696, 2011. doi:10.5047/eps.2011.05.015.
Ha J., Park K.-D., Won J., & Heo M.B. 2014, Investigations into Co-seismic Deformation and Strain in South Korea Following the 2011 Tohoku-oki Earthquake using GPS CORS Data. KSCE Journal of Civil Engineering (2014) 18(2):634-638. Copyright ⓒ2014 Korean Society of Civil Engineers. DOI 10.1007/s12205-014-0453-y.
Ha J., Park K.-D., Won J. & Heo M. –B. 2012, GPS-based Analysis of the Crustal Deformation of the Korean Peninsula due to the Tohoku-Oki Earthquake. Geophysical Research Abstracts.
Vol. 14, EGU2012-13947, 2012. EGU General Assembly 2012 Kreemer, C., G. Blewitt, Hammond, W. C. and Plag H.-P. 2006, Global deformation from the Great 2004 Sumatra-Andaman earthquake observed by GPS: Implication for rupture process and global reference frame, Earth Planets Space, 58 (141-148).
Lee, Hungkyu, Musa, Tajul Ariffin, Choi, Yunsoo, Yoon, Hasu & Lee, Dong-In, 2015, Retrieval and Analysis of Integrated Water Vapor from Precise GPS Data Processing at IEODO Ocean Research Station. Journal of the Korean Society of Surveying, Geodesy, Photogrammetry and Cartography. Vol. 33, No. 6, 475-483, 2015. http://dx.doi.org/10.7848/ksgpc.2015.33.6.475.
Marone, C. J., C., H. Scholz, and Bilham, 1991, On the mechanics of earthquake afterslip, J. Geophys. Res., 96, 8441-8452.
Nishimura, T., 2011, Pre-, co-, and post-seismic deformation of the 2011 Tohoku-oki earthquake and its implication to a paradox in short-term and long-term deformation. Journal of Disaster Research. 2014, 9(3): 294-302.
Savage, J. C., Prescott, W.H. 1978, Asthenosphere readjustment and the earthquake cycle, J. Geophys, Res., 83, 3369-3376.