APPLYING AN INTEGRATED ROUTE OPTIMIZATION METHOD AS A SOLUTION
TO THE PROBLEM OF WASTE COLLECTION
Abdul Hakim Salleh, Mohd Sanusi S. Ahamad and Mohd Suffian Yusoff
School of Civil Engineering, Universiti Sains Malaysia, Engineering Campus,14300 Nibong Tebal , Pulau Pinang, Malaysia.
[email protected], [email protected] and [email protected]
KEY WORDS: GIS, Multiple Criteria, Waste collection route, Analytical Hierarchy Process, Shortest path
ABSTRACT
Solid waste management (SWM) is very subjective to budget control where the utmost expenses are devoted to the waste collection’s travel route. The common understanding of the travel route in SWM is that shorter route is cheaper. However, in reality it is not necessarily true as the SWM compactor truck is affected by various aspects which leads to higher fuel consumption. Thus, this ongoing research introduces a solution to the problem using multiple criteria route optimization process integrated with AHP/GIS as its main analysis tools. With the criteria obtained from the idea that leads to higher fuel consumption based on road factors, road networks and human factors. The weightage of criteria is obtained from the combination of AHP with the distance of multiple shortest routes obtained from GIS. A solution of most optimum routes is achievable and comparative analysis with the currently used route by the SWM compactor truck can be compared. It is expected that the decision model will be able to solve the global and local travel route problem in MSW.
1. INTRODUCTION
Solid waste management is certainly a global problem and many countries is facing this problem daily at the various levels of development. The increase in urbanization and development leads to larger quantities of waste materials that require very serious management control (Periathamby et al., 2009). Malaysia is known as one of the rapidly developing country in Asia and is also facing the increase in waste generation. Together with the worldwide economic instability, the waste management must be taken into deeper study and as a whole.
One of the branches in solid waste management is the waste collection, which represent the largest portions of the solid waste management budgets. The increase in waste generated throughout the surrounding forces higher frequency of solid waste truck to visit every corner of the land (Johari A. et al. 2014) and taking on larger management costs.
Due to the irreversible and rapid urbanization in Malaysia, there is no solution except to get used to with the situation. Von Lina Lau, (2004) states that the problem is indeed still present and being influenced by factors such as low collection coverage due to the inaccessibility of vehicles, irregular collection services and inadequate equipment used for waste collection. Thus, improving the high expenses of the waste collection and optimizing the management cost is very much needed.
This paper presents an ongoing research on applying route optimization method as a solution to the core problem of waste collection. It is based on various criteria that contributes to the inefficiencies of the vehicle working process, i.e the solid waste truck or the compactor. Through the optimization of routes based on a list of criteria and subcriteria in Table 1, the probability of improving the
compactor and waste collection workflow is high and will also improve various other current expenses.
2. SOLID WASTE COLLECTION SYSTEM (SWCS)
It is hard to deny that waste collection engulfed very large of the waste management budget. A complete waste collection cost is not simply the expenses on the fuel that moves the fleet of waste compactor. It also covers from the maintenance of the truck such as the engine oil, tires, hydraulic liquid and lubricants; to the driver that normally requires at least three (3) operators for a single compactor. Among the expenses, this research paper highlights the fuel consumption of waste collection cost as it is a reducible and act as the main factor to some other reducible factors. One of the most eminent ways in reducing the consumption of fuel is through implementing the shortest path. A shortest path method, especially through GIS tools helps to save up to thousands (RM) per month. In theory, shortest paths may seem the best solution, but in reality, the implementation of shortest path to the compactor can also be the shortest path to many other road users. In other words, the compactor will have higher tendencies to move into traffic congestion. The main idea of the paper is that, the shortest route does not necessarily results in the least fuel consumption. Therefore, to be more real-world solution, several significant real situations must be taken into considerations in solving the problem.
2.1 Proposed Approaches to SWCS
There are many aspects that need to concentrate when dealing with the waste management. The increasing trend of waste volume produced nationwide make it more challenging and requires a thorough study. As for this research, the main focus is on the route optimization and the multiple criteria
Table 1. List of research factor and criteria
The waste collection route is one of the most important factors that always need to be updated. Continuous housing and industrial development force the waste management authority to plan ahead of schedule. If not, an unnecessary amount of the budget could be wasted. Therefore, it is best for the authority to apply the most appropriate route optimization methods. Currently, there are various methods being proposed and studied in achieving the most efficient route for the waste collection process. All of these methods were made to fill the gaps of problem or flaws that are present in the current methods.
In MCDM practice, it must have the multiple aspects and criteria. Through the involvement of a variety of criteria from many aspects, a more practical results can be obtained from the calculations or algorithm. There are many multicriteria methods that were used in waste management, but most of it is to find the best site for waste dumps or landfill. (Sener,S. et al.,2010; Jafari,S. et al., 2010; Afshari,M.,2014; Kara,C., 2012; Ibrahim, E.H., 2011), are a few examples of MCDM landfill site selection studies.
Research by Ahmed & Asmael (2009) focussed on the new optimal route for Baghdad city road construction, linking between two locations Alkadomiyah and Algria’at. The research applies the Analytical Hierarchy Process (AHP) method to produce weights of four (4) criteria through pairwise comparison. The criteria are soil, distance, slope and land use. The derived weight was applied in the GIS based analysis, to produce an optimum route between four (4) paths with the consideration that save money, time and effort.
Hazardous materials (HAZMATs) transportation requires serious security setting in its travelling route. The safety in terms vehicle collisions and potential exposure to the public, and cost are the main considerations in the truck routing. Huang (2006) used five (5) factors in his research i.e. exposure, socioeconomic impact, risks of hijack, traffic conditions and emergency response. These factors were also being pairwise compared and weights were obtained through AHP and is further analyzed using GIS technology. The results show that the final recommended and the most effective route.
This research presents a new route optimization method which takes into account multiple number of criteria in a multiple optimized route. In specific, these criteria will determine the best route for the compactor based on the route optimization used using AHP and Geographical Information System (GIS) analysis tools.
Nowadays, the vehicles commonly used to collect waste in residential and small industrial area are the compactor. The compactor can fill up to ten of tons of waste in a single trip. Starting from a depot and end up at the landfill site before returning back to the depot, the compactor faced many on road disturbance which contributes to the inefficiency of its movement.
The hypothetical concept of this study claimed that the shortest route may or may not be the most optimized route for the compactor. Burhamtoro et.al, (2013) states that “the cost of transporting waste should consider the traffic conditions of the working areas inevitably affecting the vehicle speed. Shortest route in most cases will be affected by traffic congestion as most drivers would prefer to use it. But by spending more time in slow traffic, a significant amount of fuel will be wasted (HumanitarianResponse, 2013).
Moving in slow traffic forces the driver to frequently changing gear, brake and accelerate, thus consuming more fuel (Haworth, and Symmons, 2001). In addition, the weight of the vehicle also gives impact as the heavier the vehicle, the more fuel is required in moving the vehicle (Archer et. al, 2008). As in this study, the compactor which is already heavy on its own weight, but will be heavier as more waste is collected. Therefore, the most optimized route for the compactor is the route that gives optimal impact on the fuel consumptions.
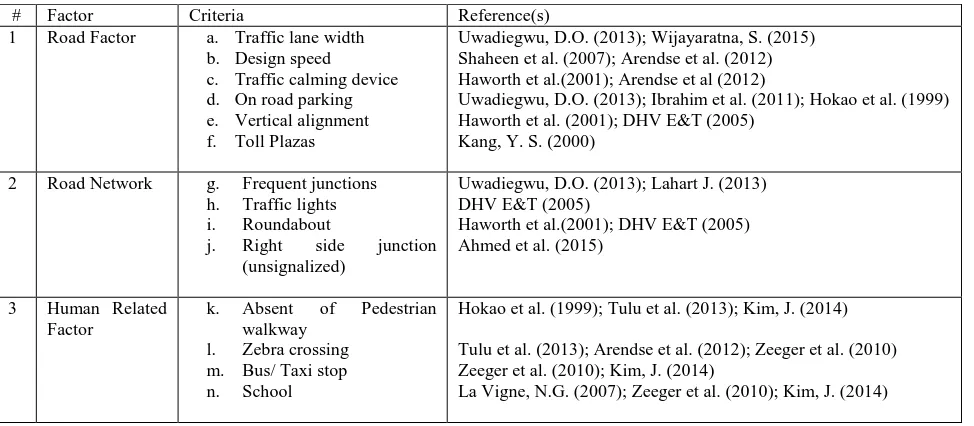
In order to address such matters, a number of criteria were selected based on its potential of creating disturbance to the compactor movement. The criteria were selected solely based on its characteristic in affecting a smooth vehicle movement. There are three (3) factors and a total of fourteen (14) criteria altogether.
# Factor Criteria Reference(s)
1 Road Factor a. Traffic lane width b. Design speed
c. Traffic calming device d. On road parking e. Vertical alignment f. Toll Plazas
Uwadiegwu, D.O. (2013); Wijayaratna, S. (2015) Shaheen et al. (2007); Arendse et al. (2012) Haworth et al.(2001); Arendse et al (2012)
Uwadiegwu, D.O. (2013); Ibrahim et al. (2011); Hokao et al. (1999) Haworth et al. (2001); DHV E&T (2005)
Kang, Y. S. (2000)
2 Road Network g. Frequent junctions h. Traffic lights i. Roundabout
j. Right side junction (unsignalized)
Uwadiegwu, D.O. (2013); Lahart J. (2013) DHV E&T (2005)
Haworth et al.(2001); DHV E&T (2005) Ahmed et al. (2015)
3 Human Related Factor
k. Absent of Pedestrian walkway
l. Zebra crossing m. Bus/ Taxi stop n. School
Hokao et al. (1999); Tulu et al. (2013); Kim, J. (2014)
Tulu et al. (2013); Arendse et al. (2012); Zeeger et al. (2010) Zeeger et al. (2010); Kim, J. (2014)
2.2 Multicriteria Decision Making (MCDM)
All the criteria will be analyzed through AHP - multicriteria decision making methods. The AHP is a multicriteria decision analysis that have been widely used and refined since its introduction by Thomas L. Saaty in 1970s. Instead of stating that a decision made is correct, AHP helps the researcher or decision makers to find and understand the best decision that suits the research objective together with the understanding of the problems. It can organize and analyze psychological based complex decisions in various fields of study and represent it in mathematical form.
The source of numeric which represents the intensity of importance is obtained from a questionnaire or interview sessions with the respondent. The fundamental scale of the intensity is presented in Table 2. The numeric value shows the intensity of the importance of one criteria over the other.
Intensity of Importance
Definition
1 Equally importance
2 Weak or slight
3 Moderate importance
4 Moderate plus
5 Strong importance
6 Strong plus
7 Very strong or demonstrated importance
8 Very, very strong
9 Extreme importance
Table 2. The AHP Scale (Saaty, 2008)
Once the decision maker systematically assigned the elements or criteria to be compared in two at a time, the process of transferring of information from the psychological aspects of the mathematical form is started. This process is known as pairwise comparison and it involves numerical value. The numerical value represents the intensity of the importance of one criterion to the other. The pairwise comparison of criteria was made in a form of questionnaire and is going to be answered by whom, who affected by the criteria or the experts in that particular field. In this research, the respondent will be the solid waste management decision maker and the compactor driver. It can also be extended to any heavy truck driver as the criteria is related.
The decision makers’ preferences are evaluated to produce the criteria weight together with the consistency test. In this research, it represents the initial weight.
2.3 Route Optimization
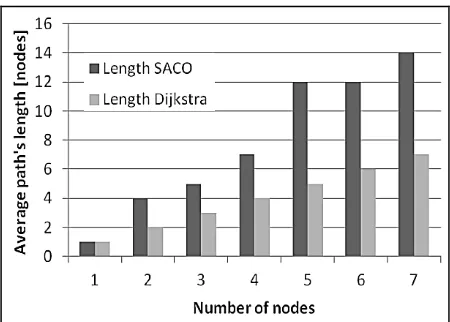
With the weight of each criteria, the route optimization stage will then be initiated. The route optimization stage will begin with the finding of multiple route of shortest paths. There are two categories of shortest path algorithms, one with graph only and the other with an addition of artificial intelligent. The comparison is clearly made between the Dijkstra’s algorithm (first category) and Simplified Ant Colony Optimization (second category) by Mariusz Dramski. Dijkstra’s algorithm was chosen as the suitable algorithm by its straightforwardness based on two parameters – average time of finding a solution and the length of found path. Mariusz represents the finding in Figure 1.
Figure 1. SACO vs Dijkstra – paths (Mariusz D., 2012)
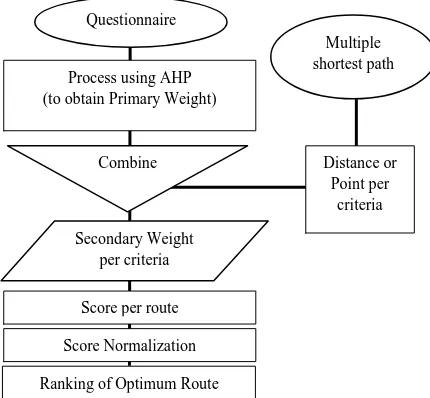
The multiple shortest path of Dijkstra’s algorithm obtained will be processed together with the weight of criteria obtain in AHP. The weight of each criteria will be combined with the route by the presence of the criteria on the route and the secondary weight of the criteria will be produced through distances of its segment. But if the criteria are absent, there will be no secondary weight of that particular route segment.
2.3.1 Scoring calculations: The purpose of the scoring calculations is to produce the rating of optimal routes referring to the criteria that are available throughout the shortest path. The fundamental variables of the criteria in the scoring calculation are the primary weight value of criteria obtained from the AHP and the distance value obtained from the Dijkstra’s shortest path of ArcGIS software. At the end of the calculations, the total value of secondary weight which has been normalized is obtained. These total value of secondary weight is the score, which determines the rating of the routes. Highest value of score represents the most disturbed route, thus not an optimized route. .
2.3.2 Types of secondary weight calculation: The secondary weight can be in three forms – directly proportional, inversely proportional or point value. The directly proportional calculation is where the distance and the weight of criteria increases as the value of variable road distance grew larger. The weight will becomes larger and more significant as the road distance is longer. Based on the list of criteria in Table 1, the criteria used in the directly proportional intensity calculation are Traffic Lane Width, Designed Speed, On Road Parking, Vertical Alignment, Absent of Pedestrian Walkway.
The second type of secondary weight calculation is the inversely proportional. This calculation is inversely proportion to the value of the road distance. The smaller the value of the road distance, the higher the value of weight. The criteria in Table 1 involved in the inversely proportional calculation are Frequent Junctions, Traffic Lights, Traffic Calming Devices, Right Side Junction, Zebra Crossing, and Bus/Taxi Stop.
These criteria were sorted into the calculation categories based on the road distance guidance provided by Malaysian Public Works Department (JKR) and its potential in creating traffic flow disturbance without value of distance.
2.3.3 Types of road distance value: The value of variable road distance is divided into two i.e. based on criteria road segment (start to end) and distance between two similar criterion (Figure 2). The road distance based on criteria road segment can be simply explained in terms of its distance from the very beginning of the criteria until it reach or surpass the distance guidance provided. This type of road distance calculates the secondary weight based on the segment itself without having any relation with another similar criteria. For example, according to JKR, the distance of vertical alignment which is equals to or more than 4% must not be more 3km. Therefore, when the vertical alignment of more than 4% is not yet reach 3km in distance, the secondary weight will remain zero (0), no disturbance.
For the second type of distance calculation, the distance is based on the distance between two similar criterion. The advantage of this method is the distance between two similar criterion is directly captured, thus easier to be analysed. But if the total number of the similar criteria is odd, then the distance is selected in two ways – start with the first criterion or start with the second criterion. The selected ways is the one with higher value of weight, which represents higher amount of road disturbance. For example, one of the criteria that falls into the second type of distance calculation is the traffic light. In the result of a shortest path stated that the total number of traffic light is eleven (11), which is odd in number. The distances will be captured on both ways at its beginning, the distance from 1-2, 3-4,…9-10, with the remaining traffic light number 11; and the distance from 2-3, 4-5,…,10-11, which ends at the last traffic light. From these two ways of distance captured, the highest value of road disturbance will be used.
Furthermore, the JKR also mentioned a few distance of which relates one criterion to another. Thus, brings the
secondary weight calculation to a second dimension calculation. Although it is not available for all the listed criteria, but the weight of such disturbance should also be taken into considerations. For example, the JKR mentioned that the zebra crossings should be located not less than 250m from any signalized intersections. Therefore, after the first dimension of distance were captured, secondary screening process must be initialized to detect and capture any available second dimension relationship. Through this method, results in high accuracy can be retained.
Lastly, the total of all secondary weights is calculated using simple addition process throughout the shortest path route. Then from the total weight value, the normalization process of the value is applied.
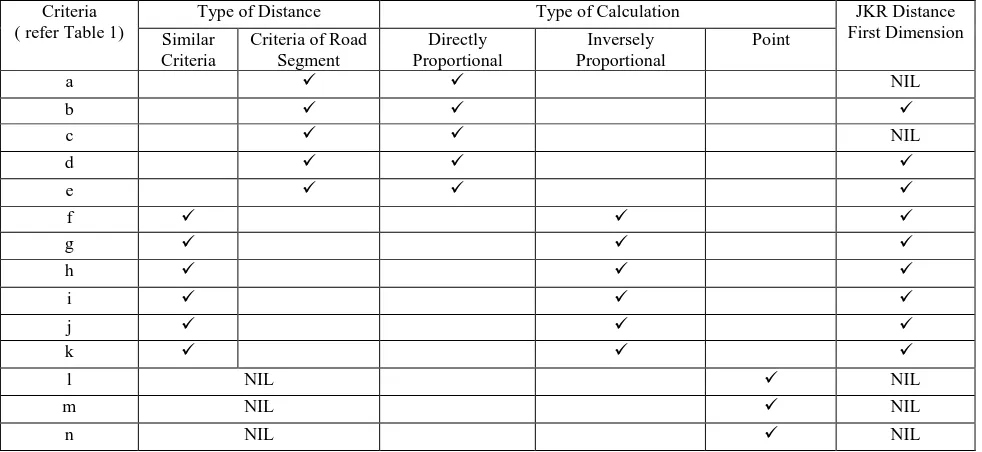
2.3.4 Controlled calculations: Controlled calculations is the calculation of the secondary weight based on the availability of distance value. As previously mentioned, there are two types of calculation which based on distance – the directly proportional and inversely proportional of distance by segment and distance between two similar criterion. There are also first and second dimensions that need to be covered. Criteria
( refer Table 1)
Type of Distance Type of Calculation JKR Distance
First Dimension Similar
Criteria
Criteria of Road Segment
Directly Proportional
Inversely Proportional
Point
a NIL
b
c NIL
d
e
f
g
h
i
j
k
l NIL NIL
m NIL NIL
n NIL NIL
The controlled calculations is calculated using Microsoft Excel in the form of single path, where there are a series of dummy criteria being compiled together with distance value. The are three variables which is being tested – the primary weight value of a criteria, the distance limitations provided by JKR and the distance under condition which is the true distance on land but being limited by the value of distance limitations of JKR.
Begin with the directly proportional where as the value of distance increases, the value of the secondary weight or the intensity of disturbance increases. The formula that is being applied is as follow:
(1)
Next is the inversely proportional where as the value of distance increases, the value of the secondary weight decreases. The formula for the inversely proportional is as follow:
(2)
Then as for the point, which does not related to any distances. The formula is as follow:
(3)
where = Secondary weight = Primary weight = Distance limitations = Distance under conditions
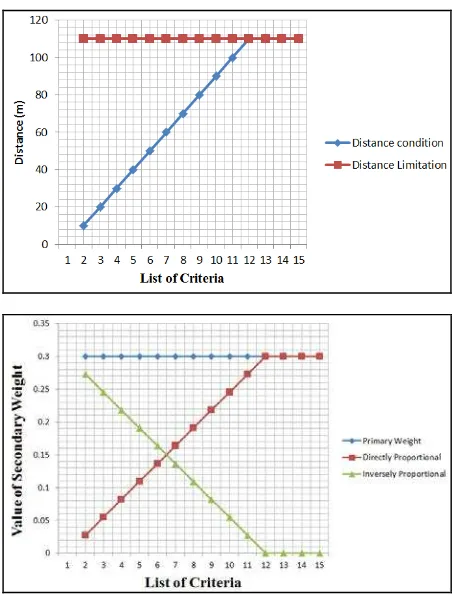
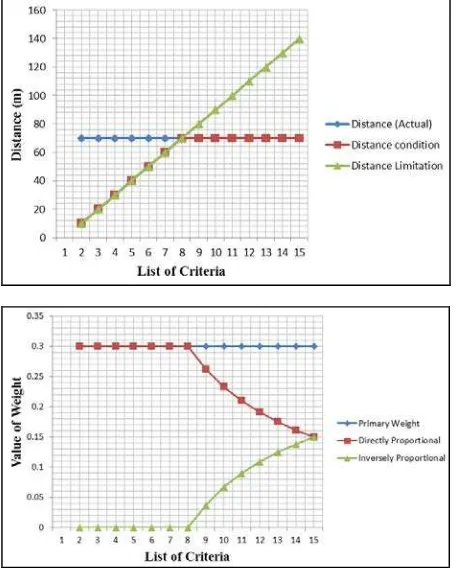
The first test is the test on value of distance under condition where the distance value is set to increase consistently while the limitations and primary weight is set to a fixed value. The results obtained are as follow:
Figure 3. (Above) Fixed Distance Limitations Vs Increasing Distance Condition. (Below) Fixed Primary Weight Vs Results of Directly Proportion and Inversely Proportion of Secondary Weight
From the Figure 3, the results of directly proportion and inversely proportion of secondary weights shows that value of distance condition effects the value of secondary weights. As the distance condition reach the value of distance limit, the secondary weight of directly proportion reaches its maximum value while inversely proportion reaches its minimum value.
Next, the second test focused on the value of primary weight. The primary weight is set to increase consistently for both directly and inversely proportion, while the value of distance condition and distance limits were set to a fixed value. The results obtained are as follow:
Figure 2.Flow in finding secondary weight
or
or
Weights Value per criteria from AHP (Primary Weight)
Directly Proportional
Indirectly Proportional
Value of Road Distance Criteria
Road Segment
Between two similar
criterion
Secondary Weight Obtained from
Derived into
or Point
In the form of
Figure 4. (Above) FIxed Distance Limits Vs Fixed Distance Conditions. (Below) The trend of graph of both directly and inversely is consistently increased
From the Figure 4, this is a pure test of primary weight effects on the secondary weight. Due to the consistent distance limits and condition, both the secondary weight of directly and inversely react the same manner, which is consistently increase.
Lastly is the test on the distance limitations. The distance limitation is set to increase consistently while the primary weight and actual distance is set to fixed value. The results obtained are as follow:
Figure 5. (Above) Fixed Actual Distance Vs Increase Distance Limit. (Below) Secondary Weights as the result of trend of Distance under Condition
From the Figure 5, the value of secondary weight begins with a consistent set of value until the value of distance condition
is separated from the distance limitation. Thus creates a decrease in weight for the directly proportional formula and increase in weight for the inversely proportion.
2.3.5 Scores: Scores is the sum of all secondary weight values of a single path. Scores represent the total disturbance that a single path had. Therefore, high score value as compared to other means that it is not an optimized route. A lower score is more prefereable. The formula to obtained the score of a single path is as follow:
(4)
where S = Scores of the single path
n = number of set of criteria captured in a path k = constant increment of secondary weight,
= value of secondary weight
2.3.6 Normalizing of score: Through the iteration of Dijkstra’s shortest path algorithm, a multiple shortest route will be obtained. Each of these shortest route will bring a different compilation of road condition and environment, thus producing different scoring values. If all the intensity values are simply added, then there will be a possibility that the longer route, will always have the highest score and not being chosen as the optimized route. Therefore, a normalization method of the total secondary weight values among the multiple shortest route is essential. This is to ensure the high accuracy of the results is sustained.
There are two (2) common types of normalization method i.e. the z-score normalization and min-max normalization method. These methods ensure that various conditions or cases can be solved in its finest way. The min-max method is a single set of value normalization, but the study obtained multiple set of values from the multiple shortest route. Therefore, the normalization method that is used in this research is the standardization or the z-score method. This method puts the various range of secondary weight values from multiple sets of shortest path route into a standard form through the mean and standard deviation. The results will be a numeric value which can be compared with one to another without having any bias, especially in terms of ‘long route high score cases’.
2.4 Challenges
2.5 Research Contributions.
Most of the current route optimization methods focus on the mathematical aspect of the algorithm itself. The main target of this research is to view the route optimization of waste collection in a different perspective. This research focus on the various criteria that will contribute to the inefficiency of waste collector movement and embed it together with multiple optimized routes to see which of them has the least on the road disturbance or the lowest final score. The results will be further analyzed in terms of its speed, time and fuel consumptions between the optimized routes. The key objectives is to identify the factors that affect the smooth travel of a waste compactor. Then, a model in route optimization method based on multiple on-road disturbance criteria will be build where the analysis is focused on speed, time and fuel consumptions for optimal route.
The research was planned to solved route optimization for local waste management authority. From the initial work on normalization process (ranking of optimum route) will determine the condition of disturbance along the routes under study and recommended the ideal route to reduce the fuel consumption. The research will then make comparison of the current route distance that is being practiced by the local waste management authority with the most optimized multicriteria route distance obtain through the Dijkstra’s algorithm.. This result will determines the level of benefits to the local waste management authority, whether positively or negatively, based on the choice of routes obtained, with an assumption that the road is totally flat and no road disturbance occurred. The analysis will be based on time, speed, and fuel consumption.
In addition, instead of assuming that the travel of the compactor is free from any disturbance, the study takes into consideration of the actual expenses that were faced by the local waste management authority and compared with the most optimized route obtained, including the multiple road disturbance factors or criteria, in terms of time, speed and fuel consumption. The differences will be presented in the form of percentage and calculated for its time based benefits, such as the improvement of expenses that can be achieved in a year, on fuel consumption and maintenance of the compactor.
3. CONCLUSIONS
This research is focused on the development of new aspects of Multicriteria Search Problem (MSP) through the use of actual situations instead of mainly focused on the mathematical aspects. The model can be tested in any waste collection compactor travel route, thus any waste collection authority will implement the method in improving their waste collection management especially in terms of waste collection expenses.
The fourteen (14) listed criteria covers most of the factor that contribute in disturbing the smooth flow of road traffic. The focused is on the waste collection truck or compactor is due to its operation which deals with large and small road, daily. Moreover, the selection of the compactor is to enhance the results, not too little nor too huge such as an average sized car or container truck, respectively.
Through the use of the formula of secondary weight, the primary weight can either be enhance or reduce based on the actual distance and the distance limits of such criteria. Thus the results were not treated as a single value, which will later results in biased result. Instead, it is treated in a form of ranges, where the longer distance may induce to larger weight and may also produce lesser weight, depends on it’s the criteria characteristics.
Furthermore, the primary weight that were obtained from the AHP module produce a very small value, thus a sensitive formula is needed. By simply classifying the value of the primary weight into classes of range are actually discourage the small value of primary weight. Thus by applying the formula (1), (2) and (3), a high sensitive results can be obtained, before proceeds into the scoring and normalization calculation.
The MSP model can support the truck driver’s decision in choosing the route and produce positive impact. With the multiple highly considered factors and criteria listed, there is a high probability that this routing method is applicable in real world situations and help the solid waste companies and local authorities in improving their management.
REFERENCES
Ahmed, A., Mohd Sadullah, A. F., & Yahya, A. S. (2015). Field study on the behavior of right-turning vehicles in Malaysia and their contribution on the safety of unsignalized intersections. Elsevier Transportation Research, 1-14.
Ahmed, D. G., & Asmael, E. M. (n.d.). (2009). A GIS-Assisted Optimal Urban Route Selection Based On Multi Criteria Approach. The Iraqi Journal For Mechanical And Material Engineering, 556-567.
Afshari, M., & Mafi, E. (2014). Land Capability Assessment for Regional Planning using AHP and GIS at Shandiz Urban Region, Northeast Iran. Environment and Urbanization ASIA, 105-118.
Archer, J., Fotheringham, N., Symmons, M., & Corben, B. (2008). The Impact of Lowered Speed Limits in Urban and
Metropolitan Areas. Victoria: Transport Accident
Commission. Process using AHP
(to obtain Primary Weight)
Score per route
Ranking of Optimum Route
Arendse, N., Swart, L.-A., Niekerk, A. v., & As, S. V. (2012, August 20). Pedestrian Safety. Retrieved from South African Medical Research Council: http://www.mrc.ac.za/crime/
Burhamtoro, Wicaksono, A., Bisri, M., & Soemarno. (2013). Model of Municipal Solid Wastes Transportation Costs Type Dump Truck (Case Study at The Malang City, Indonesia). International Journal of Engineering & Technology, 34-40.
DHV Environment and Transportation. (2005). Sustainable Safe Road Design. Dutch.
Dramski, M. (2012). A comparison between Dijkstra algorithm and simplified ant colony optimization in navigation. Zeszyty Naukowe 29(101), 25-29.
Haworth, N., & Symmons, M. (2001). The Relationship Between Fuel Economy And Safety Outcomes. Victoria: Monash University Accident Research Centre.
Hokao, K., & Mohamed, S. S. (n.d.). Traffic Impact Mitigation For New Developments: A Way To Reduce Traffic Congestion in Major Cities.
Huang, B. (2006). GIS-Based Route Planning for Hazardous Material Transportation. Journal of Environmental Informatics, 49-57.
HumanitarianResponse. (2013, November 28). The Fuel Efficient Truck Driver's Handbook. Retrieved from Humanitarian.info:
https://www.humanitarianresponse.info/system/files/docume nts/files/Fuel%20Efficient%20Truck%20Drivers%20Handbo ok.pdf
Ibrahim, E. H., Mohamed, S. E., & Atwan, A. A. (2011). Combining Fuzzy Analytic Hierarchy Process and GIS to Select the Best Location for a Wastewater Lift Station in El-Mahalla El-Kubra, North Egypt. International Journal of Engineering & Technology, 37-43.
Ismail, A. R., & Lee, T. A. (2015). A Guide on Geometric Design of Roads - Arahan Teknik (Jalan) 8/86. Jabatan Kerja Raya.
Jafari, S., & Zaredar, N. (2010). Land Suitability Analysis using Multi Attribute Decision Making Approach. International Journal of Environmental Science and Development, 441-445.
Johari, A., Alkali, H., Hashim, H., Ahmed, S. I., & Mat, R. (2014). Municipal Solid Waste Management and Potential Revenue from Recycling in Malaysia. Modern Applied Science, 37-49.
Kang, Y.-S. (2000, April). Delay, Stop And Queue Estimation For Uniform And Random Traffic Arrivals At Fixed-Time Signalized Intersections. Retrieved from VirginiaTech: https://theses.lib.vt.edu/theses/available/etd-04202000-12070029/unrestricted/
Kara, C., & Doratli, N. (2012). Application of GIS/AHP in siting sanitary landfill: a case study in Northern Cyprus. Waste Management & Research, 966-980.
Kim, J. (2014). A Review of the Traffic Safety Culture in Europe to Improve Pedestrian Safety in the U.S.: Lessons
La Vigne, N. G. (2007). Traffic Congestion Around Schools. Washington: U.S. Department of Justice.
Lahart, John; Conroy, Eddie; Curley, Robert; Hogan, Paul; McGrath, Sean; Molony, Dominic; Stapleton, John; Taylor, Derek; Taylor, Jason;. (2013). Design Manual for Urban Roads and Streets. Department of Transport, Tourism and Sport.
Lau, V. L. (2004). Case Study on the Management of Waste Materials in Malaysia. FORUM GEOÖKOL, 15(2).
Periathamby, A., Hamid, F. S., & Khidzir, K. (2009). Evolution of solid waste management in Malaysia: impacts and implications of the solid waste bill, 2007. J Mater Cycles Waste Management, 11: 96-103.
Saaty, T. L. (2008). Decision making with the analytic hierarchy process. Int. J. Services Sciences, Vol. 1, No. 1,, 83-98.
Sener, S., Sener, E., Nas, B., & Karagüzel, R. (2010). Combining AHP with GIS for landfill site selection: A case study in the Lake Beysehir catchment area (Konya, Turkey). Elsevier, 2037-2046.
Shaheen, S. A., & Lipman, T. E. (2007). Reducing Greenhouse Emissions And Fuel Consumption. IATSS Research, 6-20.
Tulu, G. S., Washington, S., King, M. J., & Haque, M. M. (2013). Why are Pedestrian Crashes so Different in Developing Countries? A Review of Relevant Factors in Relation to their impact in Ethiopia. Australasian Transport Research Forum Proceedings (pp. 1-18). Brisbane: PATREC.
Uwadiegwu, D. O. (2013). Factors Responsible for Traffic Congestion in Nigeria, A Case Study of Mayor Bus Stop and Coal Camp Along Agbani Road in Enugu City, Nigeria. Journal of Environment and Earth Science, 71-78.
Wijayaratna, S. (2015). Impacts of On-Street Parking on Road Capacity. Australasian Transport Research Forum Proceedings (pp. 1-15). Sydney: AECOM Australia.