KAJIAN SEL SOLAR TERSENSITASI PEWARNA
SEMULAJADI DENGAN ELEKTROD TIUB
NANO TITANIA
JOSHUA JOHN SAMUEL
U
NIVERSITI SAINS MALAYSIA
KAJIAN SEL SOLAR TERSENSITASI PEWARNA
SEMULAJADI DENGAN ELEKTROD TIUB
NANO TITANIA
by
JOSHUA JOHN SAMUEL
Thesis submitted in fulfilment of the requirements for the degree of
Master of Science
ii
ACKNOWLEDGEMENT
I would like to thank all the people who contributed in any way in the work described in this thesis. I could not achieve this moment of accomplishment without any helps and supports from a lot of people surround me.
First and foremost, I would like to thank God and my parents for all that I am and all that I achieved. Thank you for the effort and guidance that you have bestowed upon me through the years and through the years to come.
I would also like to thank Assoc. Prof. Dr. Yam Fong Kwong as my academic supervisor in preparing this thesis. Thank you for the help and guidance in getting the project moving smoothly, as well as the great insight to the science of nanotechnology. I would not have made it thus far without your never wavering help.
I would like to thank my colleagues and trusted associates, Dr. Beh Khi Poay and Lynliana Anak Unjan in their support and insight during the course of the project. The experience of Dr. Beh helped me in conducting my experiments efficiently, and the support of Lynliana help me give even more to the completion of this project.
I would like to thank NOR Lab and its staff for the facilities available and the guidance in using it, which was vital for the characterisation of samples during the projects duration.
Finally, I would like to acknowledge Universiti Sains Malaysia Research Grant (Account no: 1001/PFIZIK/8011005) for financial support. Thank you.
iii
TABLE OF CONTENTS
ACKNOWLEDGEMENT ii
TABLE OF CONTENTS iii
LIST OF TABLES vi
LIST OF FIGURES viii
LIST OF SYMBOLS xi
LIST OF ABBREVIATIONS xii
ABSTRAK xvi ABSTRACT xvii CHAPTER 1 – INTRODUCTION 1 1.1 Introduction 1 1.2 Problem Statement 6 1.3 Hypothesis 10 1.4 Objectives 11 1.5 Novelty of Study 11 1.6 Outline of Dissertation 12
CHAPTER 2 – LITERATURE REVIEW 13
2.1 Introduction 13
2.2 Renewable Energy 14
2.3 Solar Cell 16
2.3.1 Solar cell working principle 18
iv
2.4 Dye-Sensitized Solar Cells (DSSC) 28
2.4.1 Electronic Pathway in a DSSC 30 2.4.2 Electrolyte Medium 32 2.4.3 Durability of DSSCs 34 2.5 Dyes 35 2.5.1 Ruthenium (N719) dyes 35 2.5.2 Natural dyes 38 2.6 Titanium Dioxide 41
2.6.1 Types of Titanium Dioxide, TiO2 45
2.6.2 Synthesis method 51
2.6.3 Photocatalytic Degradation of Pollutants with TiO2 54
CHAPTER 3 – METHODOLOGY 57
3.1 Introduction 57
3.2 Experimental Procedure 59
3.2.1 Anodization of TiO2 Nanotubes 59
3.2.2 Preparation of Natural Dyes 62
3.2.3 Preparation of Synthetic Dye N719 63
3.2.4 Preparation of dyed TiO2 64
3.2.5 Fabrication DSSC 65
3.3 Characterization and Instrumentation 67
3.3.1 Field emission scanning electron microscope (FESEM) 67
3.3.2 Cyclic Voltammetry 69
v
3.3.4 Solar characterization system 72
3.3.5 Methylene Blue Degradation 75
CHAPTER 4 – RESULTS AND DISCUSSION 77
4.1 Introduction 77
4.2 FESEM Analysis 77
4.3 XRD Analysis of the TiO2 Nanotubes 82
4.4 UV-VIS Spectroscopy 83
4.4.1 Absorption Spectrum of Sensitizer Dyes 84
4.3.2 Reflectance Spectrum of TiO2 nanotubes in Various States
86
4.5 Cyclic Voltammetry Analysis 91
4.6 Chlorophyll Dye Durability Study 95
4.7 Solar Simulator 98
4.8 Dye Degradation of Methylene Blue 101
4.9 Summary of Chapter 108 CHAPTER 5 – CONCLUSION 110 5.1 Conclusion 110 5.2 Future Works 112 REFERENCES 114 LIST OF PUBLICATIONS
vi
LIST OF TABLES
Page
Table 1.1 Comparison of Reported DSSCs. An “S” beside the
Sensitizer denotes a synthetic dye while an “N” denotes an organic one
5
Table 1.2 Molecular Surface Area of Dyes 6
Table 1.3 Standard Lifetime of Solar Cells 8
Table 1.4 Summary of Duration for Methylene Blue Degradation in
Various Settings
10
Table 2.1 Electrolytes used in DSSCs 33
Table 2.2 Natural Dyes Used in DSSCs 41
Table 2.3 Temperature transitions between the different phases 42
Table 2.4 Anodisation recipes and results 48
Table 2.5 Reported Photocatalytic Efforts in Literature 54
Table 4.1 EDX Data of the TiO2 nanotubes 79
Table 4.2 Anodization Voltage and Duration with the Dimensions
of the TiO2 produced.
79
Table 4.3 Table of estimated bandgap of the dyed TiO2 90
Table 4.4 Onset Potential of Reduction and Oxidation for the
natural and synthetic dyes with estimated HOMO and LUMO energy levels.
vii
Table 4.5 Comparison of Collected Energy Level estimations
against reported values.
95
Table 4.6 Summary of Visual Observations on the Heptane and
Acetone portions of the Chlorophyll extract.
96
Table 4.7 Summary of UV-VIS Spectroscopy Data with an estimate
of the duration for complete degradation of the chlorophyll in acetone and heptane.
98
Table 4.8 Data from the Solar Simulator on the DSSCs tested 99
Table 4.9 Mean Temperature of Solutions during Methylene Blue
Degradation Study
103
Table 4.10 Change in C/C0 values of natural dyes against N719 over
a period of 120 minutes
105
Table 4.11 Table of paired T-Test values for Natural Dyes against
Synthetic dyes
viii
LIST OF FIGURES
Page
Figure 2.1 Environmental energy flow ABC and harnessed energy
flow DEF of Renewable (green) energy supplies.
14
Figure 2.2 Diagram of apparatus describe by Alexander-Edmond
Becquerel
17
Figure 2.3 Structure of an Efficient Solar Cell 17
Figure 2.4 Schematic Diagram of pn junction diode in solar cell 19
Figure 2.5 Various types of solar cell technologies 21
Figure 2.6 Amorphous Silicon that using triple layer system 23
Figure 2.7 CdTe Solar cells 24
Figure 2.8 CIGS Solar cells 25
Figure 2.9 Commercial Solar Cells and their Efficiencies. 27
Figure 2.10 Dye-sensitized solar cell 29
Figure 2.11 Dye-sensitized solar cell device operation 32
Figure 2.12 Ruthenium-based N-3 and N-719 37
Figure 2.13 UV/Vis spectra of N-719 37
Figure 2.14 The structures of the elementary cells of crystalline
forms of titanium dioxide
43
Figure 2.15 XRD Spectra for different phases of TiO2 43
Figure 3.1 Summary of experimental procedure. 58
Figure 3.2 Schematic Diagram of the Anodization Process for
TiO2 Nanotubes
ix
Figure 3.3 Actual Setup of the Anodization Process for TiO2
Nanotubes
60
Figure 3.4 Titanium dioxide after anodization 61
Figure 3.5 Sources for the natural dyes used in this study. From the
left, Ipomoea aquatica leaves, Peltophorum
pterocarpum flowers, Millettia pinnata’s dead leaf
63
Figure 3.6 TiO2 nanotube foil in dye solution (Chlorophyll). Some
solution was removed for better viewing of the immersed foil.
65
Figure 3.7 Cross-sectional diagram of the DSSC fabricated 66
Figure 3.8 The DSSC fabricated and characterisation in solar
simulator
67
Figure 3.9 Diagram of a Field Emission gun used in FE-SEM 68
Figure 3.10 Calculating the Onset of Oxidation Potential ( (VOX)ON
) and Onset of Reduction Potential ( (VRED)ON ) from a Cyclic Voltammetry Graph
69
Figure 3.11 Schematic of Transmission and Absorption
Measurement in a UV-VIS Spectroscope.
71
Figure 3.12 Solar cell characterization system 74
Figure 3.13 Diagram of Dye Degradation Study. Figure 3.9a shows
the side view of the light source and sample positions, and Figure 3.9b shows the top view of the samples under illumination, as well as which dyed TiO2 is used for each sample.
76
Figure 3.14 Placement of DSSC device into the methylene blue
solution. The side spacers have been removed and methylene blue solution can freely flow through over the TiO2 reactive medium.
76
Figure 4.1 Side profile of the TiO2 Nanotube growth. Inset shows
the top view of the nanotubes with their pores
78
Figure 4.2 Damaged TiO2 Nanotubes when anodized at 120 V for
one hour.
81
Figure 4.3 XRD Data of the Sample in 3 different phases, a) Ti
Foil, b) TiO2 before annealing and c) TiO2 after annealing
x
Figure 4.4 Absorbance Spectrum of Dyes in the Study 84
Figure 4.5 Reflectance of TiO2 before and after annealing 86
Figure 4.6 Kubelka-Munk Transformation [ F(R) ] of the TiO2
Nanotubes Pre and Post Annealing
88
Figure 4.7 Reduction of the Reflection of TiO2 in the UV-Visible
range [300nm – 750nm] after sensitization by dyes.
89
Figure 4.8 Graph of Kubelka-Munk function (F(R)) against
Wavelength. The inset is a focused view of the 300 nm to 400 nm range where the extrapolated lines intercept the x-axis.
89
Figure 4.9 IV Characteristics of the dyes after CV measurements.
The dyes are A) Chlorophyll, B) Dead Leaf, C) Flower and D) N719 dyes respectively
92
Figure 4.10 CV response of the iodide/triiodide electrolyte 93
Figure 4.11 Energy levels of the TiO2, dyes and Iodide/Triiodide
electrolyte. The Dyes are labelled as A) Chlorophyll, B) Dead Leaf, C) Flower, and D) N719
94
Figure 4.12 Discoloration of the Acetone Sample from March 2017
to July 2017.
96
Figure 4.13 The absorption spectra for Chlorophyll in Acetone (left)
and Heptane (right) in March 2017 and July 2017.
97
Figure 4.14 Current Density against Voltage for DSSC samples 99
Figure 4.15 Percentage of methylene blue remaining as a
percentage of the original concentration over time
xi LIST OF SYMBOLS η Quantum Efficiency λ Wavelength µm Micrometre A Current cm Centimetre eV Electron Volt
JSC Short Circuit Curremt Density
g Gram
ml Millilitre
nm Nanometre
pH Potential of Hydrogen
pKa Negative logarithm of the ionization constant (K) of an acid
V Volt
VOC Open Circuit Voltage
(VRED)ONSET Onset of Reduction Voltage
VRED Onset of Reduction Voltage
(VOX)ONSET Onset of Oxidation Voltage
VOX Onset of Oxidation Voltage
vol/vol Volume to volume ratio
xii
LIST OF ABBREVIATIONS
[Co(bpy)3](TFSI)2/3 Cobalt complex, electrolyte
ACF Activated Carbon Fiber
AF Acid fuchsine
BDE47 2,2′4,4′-tetrabromodiphenyl ether
BDE209 Decabromodiphenyl ether
BMII Butyl methyl imidazolium iodide
C-217 (E)-3-(5-(7-(4-(bis(4-(hexyloxy)phenyl)amino)phenyl)-2,3- dihydrothieno[3,4-b][1,4]dioxin-5-yl)thieno[3,2-b]thiophen-2-yl)-2-cyanoacrylic cid CIGS Copper-Indium-Gallium-Selenide CIGS2 Copper-Indium-Gallium-Sulphide CNT Carbon Nanotubes CV Cyclic Voltammetry
CVD chemical vapor deposition
DECON decontamination
DI De-Ionised
DMPII 1,2-dimethyl-3-propylimidazolium iodide
DSC/DSSC Dye-sensitized Solar Cell
EFPL École Polytechnique Fédérale de Lausanne
xiii
FESEM Field emission scanning electron microscope
FF Fill Factor
FTO Fluorine doped Tin Oxide
GuanSCN Guanidine Thiocyanate
Gra-PEO Graphene-Polyethylene glycol
HOMO Highest Occupied Molecular Orbital
HMImI 1-hexyl-3-metyl-imidazolium iodide
I-/I3- Iodine/tri-iodine redox couple
IV Current-Voltage
LCCT Ligand-centered charge transfer
LUMO Lowest Unoccupied Molecular Orbital
MB Methylene Blue
MEMS Micro-electromechanical systems
MLCT Metal-to-ligand charge transfer
MO Methylene Orange MPN 3-methoxypropionitrile N-3 cis-Bis(isothiocyanato) bis(2,2’-bipyridyl-4,4’-dicarboxylato ruthenium(II) N-719 Di-tetrabutylammonium cis-bis(isothiocyanato)bis(2,2′-bipyridyl-4,4′-dicarboxylato)ruthenium(II) dye
N-TiO2 Nitrogen doped Titanium Dioxide
xiv
NMP N-Methyl-2-pyrrolidone
PMAX Maximum Power
PBI2 Lead (II) Iodide
PC-EC Polycarbonate Ethyl Cellulose
PECVD Plasma enhanced chemical vapor deposition
PMImI 1-propyl-3-methylimidazolium iodide
PMMA-EA poly(methyl methacrylate-co-ethyl acrylate)
POE-PAI Amide-imide copolymer
Pt Platinum PV Photovoltaic PVDF Polyvinylidene Fluoride PVDF-HFP Poly(vinylidenefluoride-co-hexafluoropropylene PN P-Type/N-Type Semiconductor QD Quantum Dot
RGO Reduced Graphene Oxide
SCN Thiocyanate
SMU Source Meter Unit
Spiro-MeOTAD 2,29,7,79-tetrakis(N,
N-di-p-methoxyphenylamine)-9,99-spirobifluorene
TBP 4-tert-butylpyridine
xv
UV Ultraviolet
UV-VIS Ultraviolet-visible
xvi
KAJIAN SEL SOLAR TERSENSITASI PEWARNA SEMULAJADI DENGAN ELEKTROD TIUB NANO TITANIA
ABSTRAK
Teknologi boleh diperbaharui dan teknologi hijau amat penting untuk memelihara masa depan teknologi. Solar Sel Disensitasi Pewarna (DSSC) sebagai solar sel generasi baru boleh menangani isu tersebut dengan pengunaan pewarna semula jadi berbanding pewarna sintetik. Dalam pengajian ini, DSSC dibentuk dengan penggunaan pewarna semula jadi dan sintetik, untuk mengaji kemampuan pewarna-pewarna semula jadi berbanding N-719, pewarna-pewarna sintetik. Untuk menekankan konsep teknologi hijau lagi, dua sumber pewarna, iaitu pewarna dari bunga peltophorum pterocarpum dan daun yang layu dari pokok millettia pinnata, yang hanya akan dibuang dan menambahkan kepada sampah sarap yang dikutip. DSSC dibentuk dengan menggunakan nanotiub Titanium Dioksida (TNT) sebagai substrat untuk pewarna. Kemampuan solar DSSC menunjukkan bahawa pewarna sintetik N719 mempunyai kecekapan quantum yang paling tinggi, iaitu 0.0789%, manakala pewarna semulajadi yang mempunyai kecekepan yang paling tinggi ialah pewarna bunga peltophorum pterocarpum, iaitu 0.0715%. DSSC yang dibuat turut digunakan dalam pengajian degradasi pewarna pencemar metilena biru. Dalam pengajian ini pewarna klorofil telah mengurangkan tahap pencemaran sebanyak 60 % dalam dua jam dengan penggunaan cahaya boleh dilihat, manakala pewarna N719 hanya mampu mengurangkan pewarna metilena biru sebanyak 40 %. Buat kali pertama juga, pewarna klorofil yang dikeluarkan mampu bertahan untuk jangka masa melebihi 5 bulan dalam suasana bercahaya dan bersuhu billik, dan ini meningkatkan potensi pewarna tersebut dalam penjanaan kuasa dan pendegradasian pencemaran dalam masa depan.
xvii
THE STUDY OF NATURAL DYE SENSITIZED SOLAR CELLS WITH TITANIA NANOTUBES ELECTRODE
ABSTRACT
Renewable and green technology is important in future-proofing advancements in technology. Dye Sensitized Solar Cells, a new generation solar cell has the potential to be just that with the application of natural dyes over synthetic ones. In this study, cost effective and chemically safe natural dyes are tested and compared with the commercial dye standard N-719 to gauge its performance and viability as a suitable substitute. To further emphasize the concept of green technology, two of the flora sources were fallen flowers of the peltophorum pterocarpum and dead leaves of the millettia pinnata tree, which would otherwise contribute to the growing amount of waste collected. DSSCs were fabricated using Titanium Dioxide Nanotubes (TNT) as the substrate for the dye, grown via anodization, and were tested with both natural and synthetic dyes. Solar cell performance of the dye reveals that even in low concentrations the synthetic dye gives a higher quantum efficiency of 0.0789%, while best natural dye is flower peltophorum pterocarpum at 0.0715%. The DSSCs configuration was also used to degrade methylene blue via photocatalysis to prove its viability as a pollutant degrader. Chlorophyll was determined to be the best natural dye tested, degrading approximately 60% of the methylene blue under visible light irradiation in 2 hours, while the synthetic dyes only degraded approximately 40% of the pollutant dye. For the first time recorded, chlorophyll dyes that can be stored at room temperature in ambient light for over 5 months was achieved, further increasing the potential of this natural dyes for energy generation and pollutant degradation in the future.
1
CHAPTER 1
INTRODUCTION
1.1 Introduction
Nanotechnology is a growing field dedicated to nanosized material analysis and design. At a resolution of 1 – 100 nanometers, its characteristics differ as compared to bulk material [1]. The morphology of nanomaterials offers a greater surface area to volume ratio as compared to bulk materials. In applications requiring high surface areas for reaction nanoparticles are thus important, and one such application is photocatalytic degradation.
Photocatalytic degradation revolves around the conversion of a substance into a lesser compound with the use of photonic energy. This is often done to toxic pollutants, degrading them to create inert compounds. Ultraviolet light is commonly used for this purpose due to its higher energy photons, but research is growing in the application of the lower energy visible light spectrum to achieve similar photodegradation.
TiO2 is one popular semiconductor in photocatalytic degradation due to its robust structure, chemically inert bonds, and general resistance to self-degradation. The bandgap of TiO2 is reported at 3.2 eV, but values from 2.7 eV to 3.4 eV have also been reported [2], [3], The variation in this value is due to the effect of morphology, as the nanostructures start to become smaller in dimension, the electronic properties change. This occurs in nanotube samples, where a quantisation effect causes the bandgap to increase slightly when subjected to optical analysis. The bandgap of the
2
TiO2 can be related to its absorption edge of its optical absorption. By observing a transmission spectrum of TiO2 nanotubes, the refractive index can be obtained, which is an average 1.7 for nanotube TiO2 films [3] and more than 2 for bulk or nanoparticle anatase TiO2 [4]. Anatase TiO2, popular for DSSC and photoreactive applications, have an absorption coefficient in the range of 620 µ to 1300 µ [5]. This is a small value when compared to other solar cell materials such as PbS/CdS [6], but this is due to the absorption edge of the TiO2 only appearing at the UV-light region.
Due to its absorption edge being located in the UV region, photocatalytic degradation with TiO2 is commonly done with an UV-light source. This was discovered by a then-graduate student Akira Fujishima in 1967, and till the present date, TiO2 remains a prominent material in this field. While TiO2 is mainly reactive in a UV-light source, various methods to induce reactions within the visible range have been used, including doping with metallic or non-metallic compounds such as Copper , Sulphur, Carbon, Hydrogen [7]–[9], forming junctions with semiconductors [10], [11], and sensitizing with dyes [12]–[14]. Sensitization with dyes are the basis for DSSC devices.
The dyes that were used in this study were based on the effort of green-technology. As dyes have been extensively studied, Table 1.1 reveals that most natural dyes simply do not fare as well as synthetic dyes as efficient energy generators. Instead, different reasons are chosen for the use of natural dyes, namely cost effectiveness and effective recycling of organic by-products.
To create a zero-waste society, the local flora of Malaysia can contribute in other ways other than simple photosynthesis. Flowers of the Peltophorum tree, for example, flowers yearly and the flowers subsequently wilt, creating a beautiful effect when it falls and covers the surrounding area. These flowers still possess a remarkably
3
vivid colour after falling, which was chosen to be made into a dye, as the flowers would otherwise be swept and added into common waste. Another seemingly odd choice that was chosen was the dead leaves of the Millettia tree, which sports an even shade of brown when wilted. While these two sources were previously destined for the rubbish heap may in fact be the key of using technology for unexpected recycling techniques. Lastly, chlorophyll was also chosen, being an abundant and commonly researched natural dye that has been used for fabricating DSSCs, which would serve as a makeshift natural dye benchmark. In this work, three sources were chosen, the aforementioned Peltophorum pterocarpum flower, the dead leaves of the Millettia pinnata tree, and green leaves of the Ipomoea aquatica as the natural dye sources.
Electronically, these dyes chosen have the potential for applications in DSSCs. The HOMO and LUMO levels of the dyes, as shown later in Chapter 4, have the characteristics necessary for a DSSC; that is, having a LUMO level higher than that of TiO2 and a HOMO level lower than the level of the redox couple that serves as the electrolyte. This would be further elaborated in the further chapters.
The DSSC is a solar cell that uses a coloured dye to absorb photons of the visible light spectrum and convert that energy into electronic energy. The sensitizing of wide bandgap materials allowed them to conduct electrons at a lower photonic energy, ideally in the visible spectrum. There are many factors that determine the effectiveness of the DSSC, namely, the open circuit voltage (VOC), the short circuit current density (JSC), Fill Factor (F.F), and the efficiency (η). One commercial dye that is popular is Ruthenium based N719, and the highest recorded efficiency on a DSSC is attributed to this dye, at about 11 % efficiency. Table 1.1 shows a comparison of current DSSCs recorded with the parameters mentioned. Sensitizers other than commercial synthetic dyes are also listed in Table 1.1. This is due to the costs of
4
commercial dyes, that natural sources are also investigated as economical alternatives with varying success.
The versatileness of TiO2 in photoreactive devices also extends to photocatalytic applications. When activated with UV light, holes formed in the valence band of the TiO2 form hydroxyl ions with adsorbed water, which is used to oxidize organic molecules in photocatalytic degradation [15]. The use of photocatalytic degradation is a passive form of pollution degradation, with the drawback that TiO2 on its own is only reactive to UV-light. With visible light active TiO2 organic based pollutant can be degraded rapidly with irradiance from sunlight. This would be beneficial for industries that have high organic waste products that would otherwise pollute waterways such as textile industries [28]. For this study, methylene blue will be used as the pollutant dye, and the effectiveness of dye degradation will be analysed using photospectroscopy to observe a decrease in peak values, which indicate a decreasing concentration of pollutant. The photocatalytic study conducted is irradiated within the visible spectrum, allowing for better accuracy in determining real life application performance of the device in dye degradation.
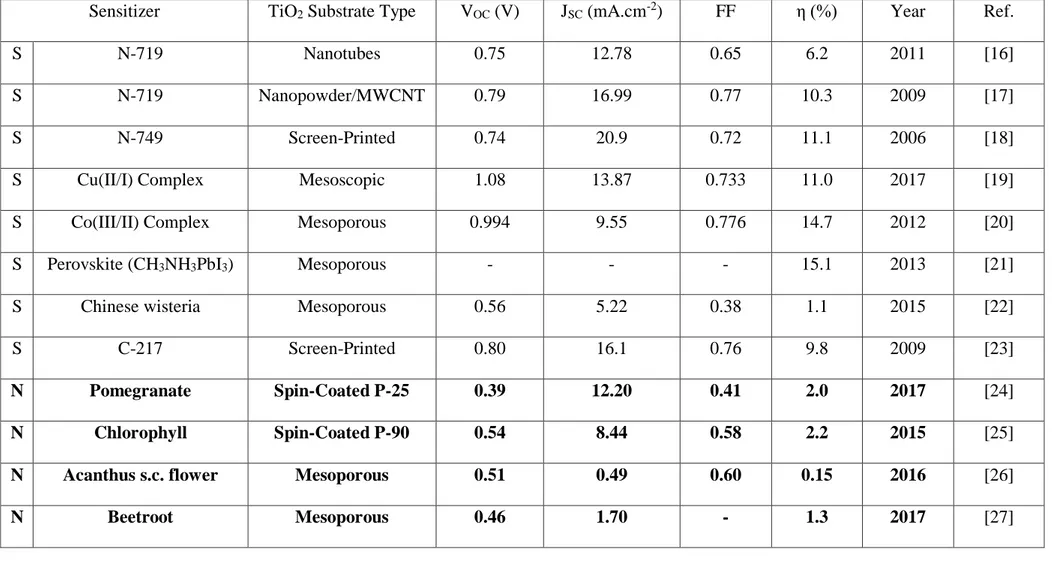
Morphology of the TiO2 substrate also play an important role towards the performance of the DSSC device. From the Table 1.1 a nanotube DSSC is shown to have roughly half the performance of a mesoporous device, but nanotube TiO2 is versatile, in the sense that synthesis is simple to perform, and dimensional properties of the nanotubes can be controlled precisely. The optical properties of the nanopowders and nanotubes also differ. More importantly, nanotube TiO2 is a physically strong structure, that is, compared to nanowire and nanopowder TiO2, nanotube TiO2 would be capable of maintaining its integrity for the second part of the study, which is the dye degradation study. Reported results using nanotubes indicate
5
Table 1.1. Comparison of Reported DSSCs. An “S” beside the Sensitizer denotes a synthetic dye while an “N” denotes an organic one
Sensitizer TiO2 Substrate Type VOC (V) JSC (mA.cm-2) FF η (%) Year Ref.
S N-719 Nanotubes 0.75 12.78 0.65 6.2 2011 [16]
S N-719 Nanopowder/MWCNT 0.79 16.99 0.77 10.3 2009 [17]
S N-749 Screen-Printed 0.74 20.9 0.72 11.1 2006 [18]
S Cu(II/I) Complex Mesoscopic 1.08 13.87 0.733 11.0 2017 [19]
S Co(III/II) Complex Mesoporous 0.994 9.55 0.776 14.7 2012 [20]
S Perovskite (CH3NH3PbI3) Mesoporous - - - 15.1 2013 [21]
S Chinese wisteria Mesoporous 0.56 5.22 0.38 1.1 2015 [22]
S C-217 Screen-Printed 0.80 16.1 0.76 9.8 2009 [23]
N Pomegranate Spin-Coated P-25 0.39 12.20 0.41 2.0 2017 [24]
N Chlorophyll Spin-Coated P-90 0.54 8.44 0.58 2.2 2015 [25]
N Acanthus s.c. flower Mesoporous 0.51 0.49 0.60 0.15 2016 [26]
6
that a nanotube length of 1.5 µm and diameter of around 80 nm to 100 nm would be suitable for an N-719 dye [29], but a nanotube length of between 6 µm – 10 µm is also usable, and for this study preferred as a wide range of dyes are used, and structurally a thicker nanotube length would be stronger. The size of the nanotube diameter is sufficient for the dye adsorption and also for the degradation study; the estimated molecular surface areas of the dyes, both sensitizer and pollutant, are listed in Table 1.2. The surface area of β-carotene was estimated using the chemical viewer J-mol (https://chemapps.stolaf.edu/jmol/jmol.php).
Table 1.2. Molecular Surface Area of Dyes
Dye N-719 Chlorophyll β-carotene Methylene Blue
Area (nm2) 2.43 [30] 1.08 [31] 1.67 (J-mol) 1.30 [32]
1.2 Problem Statement
The role of the dye in a DSSC is to receive energy from photons, exciting an electron which, by a cascading effect is transferred to the TiO2 medium, and finally recombine when returned to the DSSC from the negative terminal. Dyes used must have lower recombination rates or else risk premature recombination before the electron may be transferred to the TiO2 medium. Dyes should be easily adsorbed onto the TiO2 surface to ensure proper electronic pathways are created between the dye and the TiO2 surface. Another reason for a good adsorption of dyes is in the use of photocatalytic degradation of liquid sources, the adsorbed dye should remain adsorbed on the dye and not dissolved into the liquid source used.
One disadvantage of liquid dyes is its limited shelf life. Dyes prepared must be kept in darkened containers, as photonic interaction would result in the degradation of
7
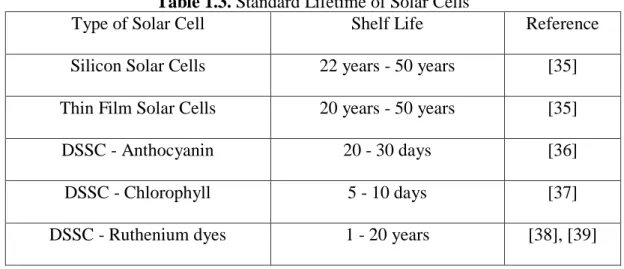
the dye itself. Natural dyes as alternative dyes commonly have limited shelf lives, as shown in Table 1.2 for various types of solar cells, and synthetic and natural dye DSSCs. From the data it is clear that DSSC solar cells are still lacking in terms of lifetime durability; even the 20 years of the N-719 dye is an estimate based on electron lifetimes of the dye, a more conservative estimate is about a year or so, depending on various factors such as temperature, light intensity, and dye concentration.
As of now, the two main methods of extending the shelf life of natural dyes are to keep the dyes in a darkened environment and freezing in sub-zero temperatures. With a greater shelf life more applications for the natural dyes could be realised for a remote setting where dyes cannot be stored in controlled environments or are needed for longer uses without constant preparation, such as rural villages or townships that may use such DSSC devices. In this study a two-step method is proposed that would increase the shelf life of a chlorophyll dye longer than the 10 days reported as Table 1.3.
The cause of a low shelf life for the natural dyes would be photooxidation of the dye. Chlorophyll for example, in an organic solvent degrades when exposed to light in the presence of oxygen [33]. Thus, stability would be ensured with two factors, that is, either in the absence of light, which is a more popular option, or storing the chlorophyll dye in a oxygen limited or absent environment. For this study a two-step route was chosen to store the chlorophyll dye in a oxygen diffused environment, as the allomerisation of chlorophyll occurs even with the absence of light, as long as oxygen is present [34]. The two-step method protects the chlorophyll dye from unwanted oxidation by storing the chlorophyll dye in a heptane solution. With less chance of oxidation, a longer shelf life that does not require extremely rigid conditions can be achieved. The chlorophyll dye will be subjected to a stability test, where the dye will
8
be left to stand over a period of a month and longer if necessary in ambient light, to determine the effectiveness of the two-step method. Chlorophyll is chosen for the longevity study due to its natural role as a sensitizer for photosynthesis, thus making it suitable in a device that requires artificial synthesis.
Table 1.3. Standard Lifetime of Solar Cells
Type of Solar Cell Shelf Life Reference
Silicon Solar Cells 22 years - 50 years [35]
Thin Film Solar Cells 20 years - 50 years [35]
DSSC - Anthocyanin 20 - 30 days [36]
DSSC - Chlorophyll 5 - 10 days [37]
DSSC - Ruthenium dyes 1 - 20 years [38], [39]
Cost is another factor in choosing a dye. In view of a long-term goal a cost-effective solution is needed. Commercially available dyes are costly, with prices of RM2000 and above for a gram of N-719. Natural dyes are favoured in this case as most are easily obtainable for a mere fraction of the cost. The spinach is necessary for the extraction of chlorophyll, for example, it is easily available for low prices at farm supplied markets or grocery stores. While research is being done to synthesize cheaper dyes, naturally occurring dyes that are cost effective may at the same time be a feasible idea for a balanced cost-for-power sensitizer dye.
Recently, there have been some researches done towards the morphology of TiO2 in regard to the efficiency of the DSSC. The morphology is important as a greater adherence area would be beneficial to ensure more dye is adsorbed onto the TiO2 structure. In the case of a nanotube structure, the length also is a relevant factor. Nanotubes are normally tailored to the corresponding adsorbed molecule for height,
9
which varies typically between 1 µm – 10 µm. Thus, optimizing the length would be the key to higher efficiency. The size of the nanotubes matters as different dyes have a different molecular structure, larger dyes may need larger areas for adherence while smaller dyes may make do with less surface area. For this study instead, a fixed length is employed to maintain a constant distance between the electrodes of the DSSC.
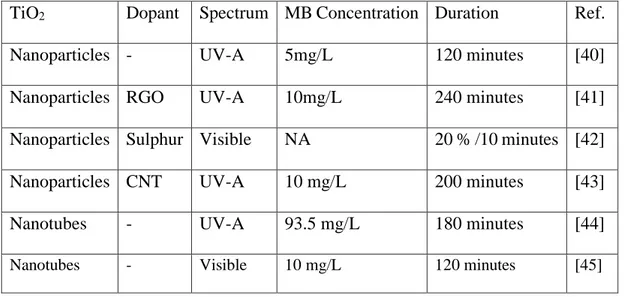
Finally, pollution is rampant and a cost effective and environmentally sound solution is needed. As TiO2 is non-toxic its use in a pollutant degradation device may not introduce additional harm to the environment but finding a way to create a passive device that does not require additional electrical sources is important to create stand-alone unattended devices. TiO2 based photocatalytic devices have been fabricated commonly use metal doping to achieve visible light reactivity, and general duration for degradation is shown in Table 1.4. The most researched method in utilizing TiO2 for methylene blue degradation is by using a nanoparticle morphology. This is due to its superior surface area and dispersion capabilities as compared to a stationary morphology such as nanotubes. While this method is effective in a controlled environment, in a practical approach the nanoparticles must be filtered out of the water following the degradation process, which in a practical setting may result in not all the nanoparticles being removed. As of now the effects of TiO2 nanoparticles on the physiology of animal and humans are not clearly understood and smaller than 100nm particles, common in photodegradation studies, would then be considered a pollutant in the waterway following the degradation. Thus, an immobile morphology such as a metal backed nanotubular structure would be a better alternative, albeit with less efficiency than the nanoparticle TiO2.
10
Table 1.4. Summary of Duration for Methylene Blue Degradation in Various Settings.
TiO2 Dopant Spectrum MB Concentration Duration Ref.
Nanoparticles - UV-A 5mg/L 120 minutes [40]
Nanoparticles RGO UV-A 10mg/L 240 minutes [41]
Nanoparticles Sulphur Visible NA 20 % /10 minutes [42]
Nanoparticles CNT UV-A 10 mg/L 200 minutes [43]
Nanotubes - UV-A 93.5 mg/L 180 minutes [44]
Nanotubes - Visible 10 mg/L 120 minutes [45]
1.3 Hypothesis
In this study, a bifunctional DSSC will be fabricated, for traditional use as a DSSC and also for the purpose of photocatalytic methylene blue dye degradation. Thus a sturdy TiO2 substrate is chosen; it is predicted that while sacrificing efficiency by using a nanotube morphology, a sturdier substrate would be obtained that can hold its integrity even in an unsealed environment, that is, during the dye degradation process. Nanopowder TiO2, while still superior to nanotubes in efficiency, may be prone to accidental dispersal in the medium, which would erode the dye substrate over time. For a practical DSSC with dye degradation capabilities, thus a nanotube foil morphology would be employed.
It is hypothesized that the absence of oxygen is a key factor in a long shelf life dye. For that a two-step method would be employed to extract the dye; once with acetone using a standard extraction method and a second time with heptane. In an oxygen diffused environment, photooxidation would be limited, thus even allowing for the dye to be stored in an ambient light setting. This would allow for easier storing
11
of the dyes if made in larger quantities, as the storage medium does not need to block out light.
1.4 Objectives
The main objectives of this project are to:
1. Investigate the performance characteristics of a TiO2 nanotube substrate with
a length between 5 µm to 10 µm for use in a DSSC
2. Extract dyes from three natural sources and to investigate the two-step method
in preparing a chlorophyll dye with a shelf life above 10 days
3. Fabricate DSSCs with the TiO2 medium of Objective 1 and dyes from
Objective 2 to compare their performances with an N-719 DSSC and dye.
4. Determine the photocatalytic degradation performance of the DSSCs
fabricated with methylene blue dye with the target pollutant processing rate of 50 % or greater in 120 minutes.
1.5 Novelty of Study
This study employs a two-step extraction method for long term storage of chlorophyll, which has been previously unreported as an effective technique for long term dye durability. The chlorophyll dye stored with this method was able to surpass the 10 days previously reported for dye lifetime.
The use of natural dyes in photocatalytic dye degradation is rarely reported, due to the low efficiencies associated with such dyes. In this study, natural dyes and synthetic dyes are used to degrade methylene blue in a DSSC setup.
12
1.6 Outline of Dissertation
Chapter 1 presents the introduction regarding this experiment. The problem statement and the objective of this experiment also mentioned in this chapter.
Chapter 2 presents established research and literature that is related to the topic of this experiment. The structural properties and characteristics of the elements involved, the TiO2 substrate, the sensitizer dye, and the DSSC in whole are established in this chapter.
Chapter 3 encompasses the methodology of the experiment, as to the steps involved. This is vital for the reproducibility of the results.
Chapter 4 is the results and discussions of the data obtained. The performance of the DSSCs made by both natural and N719 dyes will be assessed in this chapter.
Chapter 5 ends the dissertation with a conclusion on the experiment, as well as future works and any final remarks.
13
CHAPTER 2
LITERATURE REVIEW
2.1 Introduction
This chapter presents established literature on the field and topic of this experiment, that is the DSSC. A lot of research has been done to improve the efficiency of the DSSC. The creation of a high efficiency DSSC as a third-generation solar cell would pave the way for lower cost green energy, which is vital in future proofing the technological road map. Current disadvantages of the DSSC aside from a low efficiency is the stability and cost of manufacturing the sensitizer dyes. While natural dyes are easily extracted, shelf life is extremely limited without highly controlled environments, limiting the use of such DSSCs. The research done for this thesis has been fruitful in producing longer lasting dyes, a chlorophyll dye that can maintain its stability and molecular integrity for far longer than other instances of the dyes reported, at over five months. In this chapter, further elaboration on the DSSC and the integral components will be explored.
A brief look on renewable energy would introduce the chapter, followed by elaboration on the components of the study such as the base material, TiO2, the sensitizer dyes, the natural dyes and the synthetic N-719, and some of the current efforts done into improving the efficiencies of the DSSC.
14
2.2 Renewable Energy
Renewable energy is the energy obtained naturally that is infinite in the sense that it will not be depleted in the foreseeable future. Solar energy is an example of renewable energy. These energies are always “on”, in the sense that regardless of use or not are ever present. Examples of which are light from the sun, heat from the core and mantel, potential energy of waterfalls, etc. Such energy also known as Green Energy or Sustainable Energy [46].
Figure 2.1. Environmental energy flow ABC and harnessed energy flow DEF of Renewable (green) energy supplies [46]
15
Renewable energy technologies take advantage over this already available potential energy, converting it into usable energy, in the form of electricity, heat, chemicals or mechanical power [47]. There are few sources of useful energy such as:
a) The sun.
b) The motion and gravitational potential of the Sun, Moon and the Earth.
c) Geothermal energy from cooling, chemical reactions and radioactive decay in
the Earth.
d) Human-induced nuclear reactions.
The use of fossil fuels is very common in today’s society, as many forms of the fuel exist in daily use. It is convenient thus to continue and extract coal, oil and natural gases to meet the power needs of the earth’s population, but the supply of fossil fuels are limited. Each year as the power need increases, the fuel consumption in turn increases, and eventually the supply of fossil fuels would be completely finished.
Even with a hypothetical unlimited supply of fossil fuels, the use of renewable energy remains superior, as there is less toxic by-product in the use of the latter. Whereas the combustion of fossil fuels produces oxides of carbon which are harmful for health, renewable energy sources have virtually no released toxic or harmful compounds, thus earning the label “clean” or “green”. With fossil fuels, greenhouse gases released occupy the atmosphere, trapping the sun’s heat and increasing the average temperature of the earth, the so-called “greenhouse effect”. If the Earth’s average temperature keep rising, the sea levels will rise and the scientists predict that floods, heat waves, droughts and other extreme weather conditions will be occurring more often.
16
Pollutants released into the air, soil and water when fossil fuels are burned can harm the environment, taking a dramatic impact on it and on humans. Air pollution will contribute to disease like asthma while acid rains from sulfur dioxide and nitrogen oxides will harm plants and fish. Nitrogen oxides also will contribute to smog.
However, renewable energy will also develop energy independence and security. For example, by replacing petroleum with fuels that are made from plant matter, there is a reduction in costs, at the same time there is less dependence then on petroleum. Renewable energy exists in great quantities and the technology needed to acquire it is improving all the time. There are many ways to use renewable energy and some methods are already common in daily life [47].
2.3 Solar Cell
Solar cell is an electronic device and known as photovoltaic (PV) cell where it converts light energy into electrical energy. This mechanism is due to physical and chemical phenomenon known as photovoltaic effect [48]. When light enters a photovoltaic cell, it gives enough energy to excite some of the electrons. Then, built-in potential barrier acts on these electrons to produce voltage known as photovoltage which can be used to flow current through circuit [49].
Alexander-Edmond Becquerel, a French experimental physicist discovered the photovoltaic effect in 1839. He discovered that two brass plates immersed in a liquid, as shown in Figure 2.2 produce a continuous current when it is exposed to the light [50][51]. 100 years later in 1939, Russel Ohl built the first photovoltaic device by using a Silicon PN junction. These junctions were formed naturally when melting silicon hardens. This junction is shown in Figure 2.3 [50][52].
17
Figure 2.2. Diagram of apparatus described by Alexander-Edmond Becquerel [52]
Figure 2.3. Structure of an Efficient Solar Cell [52]
This device has electrical characteristics where current, voltage or resistance will vary when it is exposed to light. Other than measuring light intensity, this device also was used as a photodetector where it can detect light or other electromagnetic radiation near the visible range [48]. Solar cells are an unbiased photodetector that is
18
connected to a load (impedance). There are three qualitative differences between a solar cell and photodetector which is:
a) Solar cells need to work over a broad spectral range (solar spectrum) while
photodiode works on narrow range of wavelength.
b) Solar cells are a device used to minimize exposure.
c) In solar cells, the metric is power conversion efficiency which defined as the
power delivered per incident solar energy while in photodiodes, it is quantum efficiency which is the signal to noise ratio. Solar cells are designed to connected to the external load to minimize the delivered power [50].
2.3.1 Solar cell working principle
Basic structure of solar cell is a PN junction diode. The schematic of the device is shown in Figure 2.4. It consists of PN region where n region is heavily doped and made thin so that light can penetrate easily while p region is lightly doped which causes the depletion region to lie in that P region [50]. The operation of this devices requires three basic steps which are:
a) Electron hole pairs or exactions will be generated through the absorption of
light
b) The charge carriers of opposite type will separate
19
Figure 2.4. Schematic Diagram of pnjunction diode in solar cell [49]
When light is incident on the cell, it will generate electron hole pairs (EHPs) which then will be separated by the potential barrier thus creating a voltage that allows the current to flow through the external circuit [49]. The penetration of light depends on the wavelength. As the wavelength decreases, the absorption coefficient increases[50].
When light is incident on the cell, electrons absorb light, moving it from the valence band to the conduction band throughout the pn junction.[52] Thus, electron hole pairs will be generated. The generation of electron hole pairs is the central process of the photovoltaic effect but it does not produce current by itself. Another mechanism is needed for electrons and holes to produce an electric force and a current. This mechanism is known as a built-in potential barrier.
20
This potential barrier separates light-gathered electrons and holes. More electrons will be sent to one side of the cell while same goes to the other side of the cell where more holes will be sent there. Thus, the electrons and holes are less likely to recombine and lose their electrical energy.
This phenomenon sets up a voltage difference which can be used to allow an electric current in an external circuit [49]. When the junction operates as a solar cell, the excited electrons will excite to the conduction band and flow from p-type to the n-type side. As the electrons leave the valence band, it left behind holes that flow in the opposite direction [52].
2.3.2 Types of solar cells
Solar cells can be made of one single layer of light-absorbing material known as single junction. It also can be made of multiple physical configurations which is known as multi-junction. The purpose of this junction is to take advantage of various absorption and charge separation mechanisms [48].
There are various types of materials applied for photovoltaic solar cells which is mainly in the form of silicon (single crystal, multi-crystalline, amorphous silicon) (Si), cadmium-telluride (CdTe), indium-gallium-selenide (CIGS) and copper-indium-gallium-sulphide (CIGS2) [53]. Photovoltaic cell technologies usually classified into three generations which is depending on the basic material used and the level of the commercial maturity [54]. Figure 2.5 shows different types of solar cell technologies in each generation.
21
Figure 2.5. Various types of solar cell technologies [53]
a) First generation solar cells
This generation, also known as conventional, traditional or wafer-based cells [48]. They are produced on silicon wafers [53]. Silicon is one of the most abundant elements on earth’s surface. It is a semiconductor material with bandgap energy of 1.1eV that is suitable for photovoltaic applications [54].
Due to high power efficiency, this generation of solar cells was known as the oldest and the most popular. The silicon wafer technology can be further categorized into two groups which are:
22
i. Single / Mono-crystalline silicon solar cell
Mono crystalline solar cells are manufactured from single crystals of silicon usually by a process called Czochralski process. In this process, Si crystals are sliced from the large ingots and do not completely cover a square solar cell module without a substantial waste of refined silicon. Due to this process, single crystal wafer cells tend to be expensive. The efficiency of this kind of solar cell lies between 17% - 18% [53], [55].
ii. Poly / Multi-crystalline silicon solar cell
Polycrystalline photovoltaic modules are generally made of many different crystals that will be coupled to one another in a single cell [53]. It is made from cast square ingots where a large block of molten silicon is carefully cooled and hardened [53], [55]. Currently, this type of solar cell is the most popular solar cells [53]. It is less expensive to produce as compared to single / mono-crystalline silicon solar cell but at the same time it is less efficient because it only capable of achieving around 10% efficiency [53], [55].
b) Second generation solar cells
This solar cell is mostly thin films solar cells and Amorphous Si solar cells [53]. It can combine multiple light in a “stack” of films with each material absorb slightly different range of light wavelengths. The efficiencies of thin-film solar cells are lower compared to silicon (wafer based) solar cells. Other than that, the manufacturing costs are also lower than Si solar cells, as it does not require the highly stringent requirements of material and environment as seen in the manufacturing of Si solar cells. [55].
23
Silicon-wafer cells have light absorbing layers that are up to 350µm thick while thin film solar cells have very thin layers which is generally in the order of 1µm thickness [53]. Thin film solar cells can be classified as:
i. Amorphous Silicon (a-Si) Thin Film Solar Cell
Amorphous silicon is a non-crystalline form of silicon [48]. The basic structure of this solar cell is p-i-n junction. It is made of amorphous or microcrystalline silicon [55]. It can be deposited on cheap and large substrate which is based on continuous deposition method. Thus, manufacturing costs also can be reduced [54]. It is widely used in pocket calculators and also powers some private homes, buildings and remote facilities [48]. The efficiency of amorphous photovoltaic module currently are in range 4% to 8%. Very small cells will reach 12% [54]. Figure 2.6 below shows amorphous silicon.
24
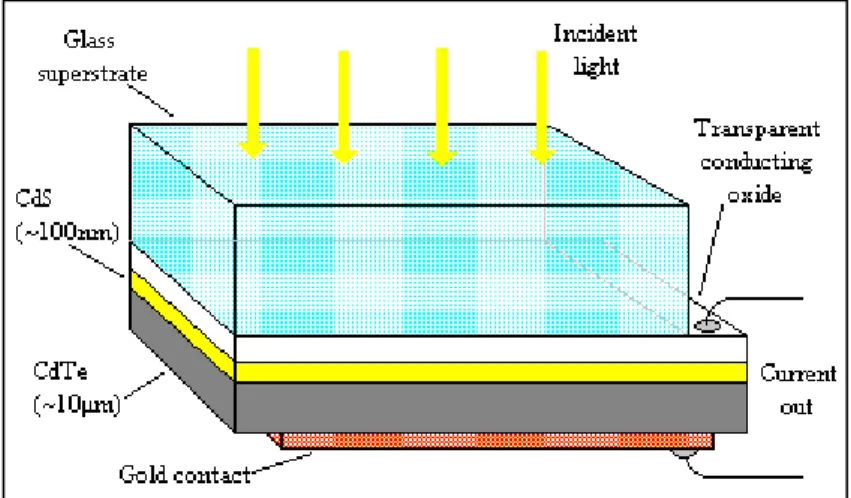
ii. Cadmium Telluride (CdTe) Thin Film Solar cell
Cadmium telluride thin film photovoltaic cells have the advantage of low costs and high cell efficiencies up to 16.7% compared to other thin-film technologies [54]. CdTe has a band gap of ~1.5eV with a high optical absorption coefficient and chemical stability, making it a versatile material suited for designing thin-film solar cells [53]. Figure 2.7 shows CdTe solar cells.
Figure 2.7. CdTe Solar cells (Durham University, 2015)
iii. Copper Indium Gallium Di-Selenide (CIGS) Solar Cells
A CIGS collar cell is a quaternary material thin film solar cell [48]. It offers the highest efficiencies among all those thin-film photovoltaic technologies, up to 20.3% which is higher than CdTe [53][54]. Figure 2.8 shows a cross section of a CIGS Solar cell.
![Figure 2.1. Environmental energy flow ABC and harnessed energy flow DEF of Renewable (green) energy supplies [46]](https://thumb-ap.123doks.com/thumbv2/123dok/1536940.2554946/32.893.274.685.412.966/figure-environmental-energy-harnessed-energy-renewable-energy-supplies.webp)
![Figure 2.2. Diagram of apparatus described by Alexander-Edmond Becquerel [52]](https://thumb-ap.123doks.com/thumbv2/123dok/1536940.2554946/35.893.192.764.110.417/figure-diagram-apparatus-described-alexander-edmond-becquerel.webp)
![Figure 2.4. Schematic Diagram of pn junction diode in solar cell [49]](https://thumb-ap.123doks.com/thumbv2/123dok/1536940.2554946/37.893.180.782.109.547/figure-schematic-diagram-pn-junction-diode-solar-cell.webp)
![Figure 2.5. Various types of solar cell technologies [53]](https://thumb-ap.123doks.com/thumbv2/123dok/1536940.2554946/39.893.163.821.126.600/figure-various-types-of-solar-cell-technologies.webp)
![Figure 2.6. Amorphous Silicon that using triple layers system [48]](https://thumb-ap.123doks.com/thumbv2/123dok/1536940.2554946/41.893.253.721.681.1007/figure-amorphous-silicon-using-triple-layers.webp)