DOI: 10.12928/TELKOMNIKA.v13i3.1808 794
Scanning-fluorescence Reader Based on Embedded
System
Zhonglong Zhao1, Xiaoping Min*1,2, Shengxiang Ge2, Ningshao Xia2 1
Department of Computer Science, Xiamen University, Xiamen 361005, China
2
National Institute of Diagnostics and Vaccine Development in Infectious Diseases, Xiamen University, Xiamen 361005, China
*Corresponding author, e-mail: [email protected]
Abstract
To measure the concentration of C-reactive protein (CRP) in serum, a portable, fluorescence reader based on time-resolved fluoroimmunoassays was developed. The scanning-fluorescence reader integrates with the AD7707 converter, which performs at a high accuracy. The photosensitive diode acts as the photoelectric conversion device, an optical module based on optical fibers, which is able to concentrate the excitation light from an LED into a line-shape beam, was designed to sendand receive the optical signal. The device subsequently addresses waveform data using a gradient, smoothing, and binarization method. When the device measures the CRP fluorescence test strip, the results exhibited a good linearity (0.99998) and the CVs (coefficient of variation) were below 5%, which indicate high accuracy. At the same time the system is low cost and small size.
Keywords: fluorescence test strip, time-resolved fluoroimmunoassay, embedded system, scanning-fluorescence reader
Copyright © 2015 Universitas Ahmad Dahlan. All rights reserved.
1. Introduction
At present, a prominent feature of In Vitro Diagnosis is its tendency of polarization. One scale of operation is large automated instruments used in medicine; the other is miniature POCT (point-of-care testing) devices. POCT instruments are convenient, fast and efficient, gaining increasing recognition in the market [1-3].
Lateral flow strip detection technology plays important roles in healthcare, disease diagnosis and disease prevention [4]. The first generation lateral flow-strip detection technology could only achieve qualitative detection; the second generation realized semi-quantitative detection using a detector; the third generation could detect quantitatively, producing more accurate information and performed reliably during clinical diagnosis.
Lateral flow strip markers mainly include colloid gold, particulate carbon, latex particles, magnetic particles, and fluorescent particles. With the development of lateral flow-strip detection technology, techniques to analyze results also developed from qualitative detection based on image processing to quantitative detection based on fluorescence monitoring and processing [5, 6]. Because of the more precise concentration information and more accurate and reliable evaluation basis for clinical diagnosis, quantitative detecting instruments with fluorescent lateral-flow strips are becoming an important POCT detection platform in many countries. A few of quantitative immunoassay detection methods have been reported [7-9]. For example, Li and et al. have described2-D optical scan system to quantify and image up converting phosphor (UCP) particles and haveutilized this system to develop an IFN-γ immunoassay with UCP labels. A 1.2W 980nm fiber-coupled laser diode was used to excite the UCP particles through a transparent microfluidic chip cover, and a photomultiplier (PMT) was used for detection. The scanner takes 8 minutes to finish 2-D strip scanning in both X and Y directions [7]. Yan and et al. have developed a biosensor used for quantitative detection of Yersinia pest is based on LF immunoassay with a complicated and bulky optical module, which also includes an infrared (IR) laser and a photomultiplier (PMT), was built with considerably high cost and large size [8].
devices using AD7707 analog-digital converter chips to convert the fluorescence signal captured by the high light-sensitive tube into a digital signal. A custom illumination module was built to focus the ultraviolet LED light into a line-shape excitation beam. Strip scanning was done by controlling a linear stage actuated by a step-motor with high resolution. When the fluorescence intensity was collected, an algorithm was designed to process the test data. The results of experiments show that scanning-fluorescence readers have advantages of a high detection speed, high repeatability, and good linearity, at the same time the system is lower cost and smaller size.
2. Biological Methods
2.1. Fluorescence Immunoassay
CRP from human plasma was used as an immunogen for the production of mouse monoclonal antibody (mAb). Immunizations, cell fusion, and screening of hybridoma cells producing anti-CRP-mAb were conducted according to a standard method [10-14].
To label the anti-CRP-mAb with a fluorescent particle, the EDC method was used. A specimen was added to the detector buffer at 100 times dilution, and the specimen was loaded into the sample well on the cartridge. After 20 min incubation, the cartridge was inserted and scanned with the scanning-fluorescence reader.
A specimen was added to the detector buffer at 100 times dilution, and the specimen was loaded into the sample well on the cartridge. After 20 min incubation, the cartridge was inserted and scanned with the scanning-fluorescence reader.
2.2. Time-resolved Fluoroimmunoassay
Several fluorescence immunoassay technologies are available on the market: enzyme immunoassay, chemilumine scence immunoassay, and time-resolved fluoroimmunoassay. Time-resolved fluoroimmunoassay is a biological detection technology which is used by the scanning-fluorescence reader.
General fluorescent markers have short fluorescence lifetimes, but a few of the lanthanide elements (such as Eu, Tb, Sm, and Dy) display a long-lived fluorescence. The characteristics of these lanthanide elements are as follows: no interference occurs between the excitation light and emitted light because of a large Stokes shift; time-resolved fluoroimmunoassay is highly sensitivity because the spectrum of the excitation light is wide, but the spectrum of the emitted light is narrow [15].
In time-resolved a fluoroimmunoassay technology, if we delay the measurement of the fluorescent markers after excitation, then the sensitivity can be improved. This delay can also reduce the interference from background fluorescence and enhance the stability and specificity. Additionally, this technique has a wider linear range, and the reagents have a longer lifetime. In addition, time-resolved fluoroimmunoassays have both higher sensitivities and easier automation than enzyme immunoassays and chemilumine scence immunoassays [16, 17].
2.2.Time-resolved fluoroimmunoassay
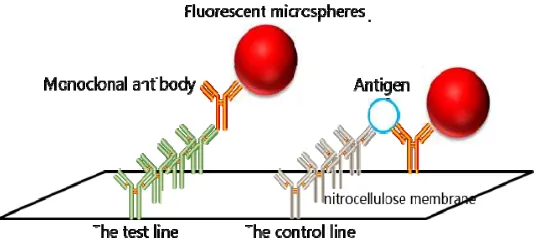
The lateral flow strip principle for the fluorometer is shown in Figure 1.
To fix the structure of the antigen-antibody, we post a layer of nitrocellulose membrane on the surface of the strip. The front of the strip is the control line, which is constructed by coating goat anti-mouse antibodies and monoclonal antibodies with fluorescent microspheres on the surface. Monoclonal antibodies can be recognized by coating goat anti-mouse antibodies automatically to form a stable structure. Therefore, the fluorescence intensity of the control line is substantially fixed to perform quality control functions.
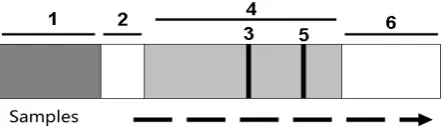
The test line is constituted by coating monoclonal antibodies and non-coating monoclonal antibodies. Unlike the control line, these antibodies are not recognized automatically, but both may combine with an antigen to form a sandwich construction of coating monoclonal antibody + antigen + monoclonal antibody. The more antigens, the more fluorescent microspheres will be stably fixed on the nitrocellulose membrane, which can measure the antigen density by determining the fluorescence intensity. The structure of the test strip used by scanning-fluorescence reader is shown in Figure 2.
Figure 2. Structure of the test strip
The internal structure of the strip is shown above. The sample pad (part 1) is used for loading samples. The conjugate pad (part 2) is placed in excessive antibodies and complexes. The lamination layer (part 4) contains two lines: test line (line 3) with fixed solubility antibodies and the control line (line 5) with quantitative antibodies [18]. Figure 3 shows a number of time-resolved fluorescence strips under ultraviolet (UV) light, in which the intensity of the control line is fixed whereas the density of the test line increases gradually from weak to strong.
Figure 3. Fluorescent strip under ultraviolet (UV) light
3. System Design
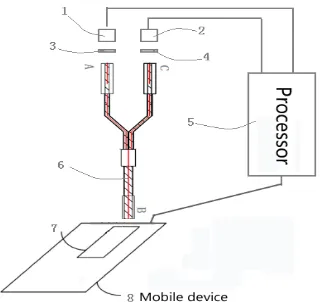
In the scanning-fluorescence reader, the processor S3c2440 is responsible for all modules including the optical module, motor module, digital-analog conversion module, peripherals module, power modules, and software design module.
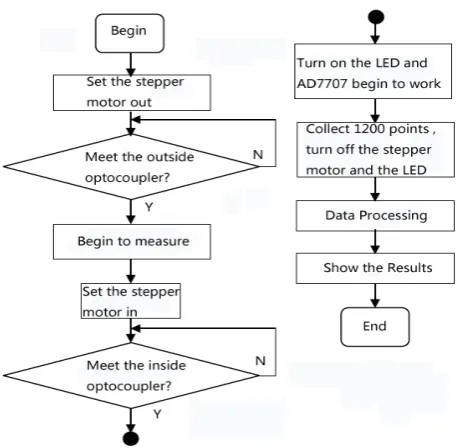
S3C2440 is a powerful processor had been widely used in embedded system [19-22]. In our system, all hardware work is performed by the S3c2440 processor. First, the processor controls the motor to start, acceleration, reverse, stop and other operations. Then, S3c2440 determines the batch number of the test strip through a built-in scanner. To ensure the precise positioning of the motor during the measurement, motor operates under the optocoupler state judge circularly when running. During the test strip that is driven by the motor controlled by S3c2440, the photodiodes send the real-time fluorescence information to the analog/digital converter module for processing. Finally, all data are processed by the S3c2440 processor, and the final results are displayed on the screen. The overall structure of the instrument is shown in Figure 4.
other specific hardware. The flow-chat of the detailed detection mechanism is shown in Figure 5.
Figure 4. Overall structure of the instrument
Figure 5. Flow-chat of the detection
Difficulty remains in how to capture the information, transmit the fluorescence information, and transform the captured analog signal into a digital signal that can be processed by the S3c2440 processor. Therefore, we selected a high-sensitivity photosensitive tube and a glass fiber to address the problem.
3.1. Optical Module
Figure 6. Design of the optical module
Figure 6 shows that light source 1 is responsible for the generation of the ultraviolet light. Filter 3 filters the emitted light. Light detection unit 2 receives the fluorescence signal reflected by fluorescence strip 7. Filter 4 filters the received optical signal in which the shape of the optical fiber appears as a 'Y'. This shape of the optical fiber is responsible for converting and transmitting the light signal. The detail is as shown in Figure 7.
Figure 7. Cross-section of the optical fiber
From Figure 7, the left masking aperture 2 connects to the LET lights to transmit the ultraviolet light emitted by the LED lamp. At the right most part, cylindrical light is transformed to strip light (with the length equaling the width of the strip test line) and irradiated to the test strip through the right masking aperture 2.
Under the irradiation of ultraviolet light, the fluorescent particles on the strip will fluoresce; right masking aperture 1 will transmit this fluoresce to the left masking aperture 1. The light-sensitive tube will then receive this fluorescence.
A scanning-fluorescence reader using ODA-6WB-500M photodiode as optical receiver module is a light-sensitive photo resistor. Therefore, photodiodes can change the current in the circuit sensitively by judging the intensity differences of the light, thus detecting the light intensity. An amplification circuit in the light-sensitive tube amplifies the received optical signal. Therefore, the sensitivity of detection increases, capturing weak signals. The received fluorescent would be processed by the light-sensitive tube and then transmitted to AD7707 (analog to digital conversion chip) to perform the next step.
3.2. Digital-analog Conversion Module
Figure 8. AD7707 interface
The AD conversion process is as follows: the light-sensitive tube receives and amplifies the fluorescent signal on the strip; the tube transmits the signal to AD7707; the chip transmits the digital signal to the S3c2440 processor through the SPI bus.
4. Data Processing
The fluorescence detection reagents have a test and control line containing fluorescent particles. Thus, the detection reagent may emit fluorescence under ultraviolet irradiation. After the test, the instrument can measure two fluorescence peaks, record the area ratio of the two waveforms, and use a standard test strip to perform large quantities of biological experiments. The following mathematical model is established: "AT/ACreagent concentration of test". Finally, this mathematical model can calculate the unknown concentration of the detection reagent.
For a continuous mathematical model, we use a derivation and analyze the equation to obtain the extreme points of a curve.
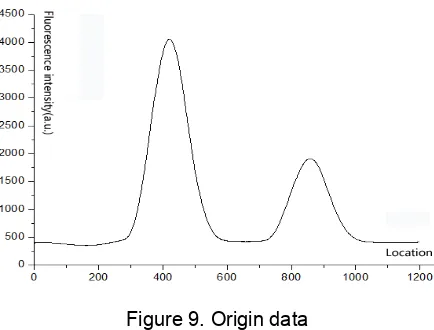
According to this process, once a test is completed, we obtain 1200 fluorescence data points (Origin [1200]) after analog to digital conversion. As shown in Figure 9, we perform the following processing.
Figure 9. Origin data
For the collected Origin [1200], we perform a gradient (similar to derivation) to obtain the Gradient [1200]. The details of this process are as as shown in Figure 10.
Where , , , are adjacent points, and ∆x , ∆y , ′ ∆ /∆ The Gradient [1200] after the gradient is as as shown in Figure 11.
Figure 11. Gradient data
From Figure 11, numerous sawtooth patterns are noted in the gradient data. These patterns are not suitable for analysis and processing. Therefore, we must perform a smoothing operation for the Gradient [1200]. This process obtains 5 points close to the current point on each side (11 in total) and uses the average value of these points as the new value of the current point.
, 5 95
⋯ , (1)
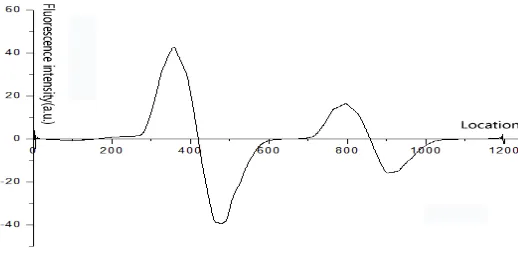
Gradient [1200] after the smoothing operation are as as shown in Figure 12.
Figure 12. Data after the smoothing operation
Theoretically, the point with its derivation equaling 0 is the extreme point. For the gradient of discrete points, however, Smooth[1200]≠0 is possible. Therefore, we need a binarization operation. Let the threshold be X, then we have:
, ,
,
The Finaldata[1200] after the binarization operation are as as shown in Figure 13.
Figure 13. Final data after binarization
From Figure 13, we obtain the attributes of the two peaks clearly:
Crest: (3)
Start point: (4)
End point: (5)
Width: _ _ (6)
Area: (7)
The improved algorithm is obtained by comparing Figure 9 and Figure 13, Equation (3) shows that crest is located to the left of the actual position. Assume the following:
Point X1: Point X2:
The crest must be located in the range of , , and the crest is the maximum value in between this intervals. Thus, the crest is: , ⋯ , , 9
The gradient, smoothing, and binarization operations above are for the ideal case. After completing the instrument design, difference among instruments are possible because of the differences among the mechanical processing, hardware circuitry, and optical modules. Variations in the production of test strips may also influence the devices. In actual tests, several small peaks appear. Therefore, a threshold must be established to filter the interference peaks.
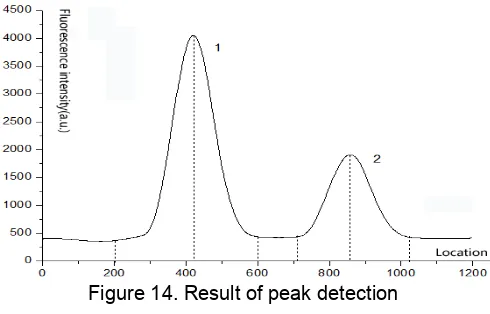
As shown in Figure 14, searching in this crest resulted in the values displayed in table 1.Both test peaks and control peaks have been accurately detected.
Table 1. Result of peak recognition Peak 1 Peak 2
The previous work successfully designed a scanning-fluorescence reader and completed the preparation of the hardware and software programming. The following sections will show several important tests of performance indicators.
The test strip is as follows (Figure 15), for which the control line (C line) is the goat anti-mouse polyclonal antibodies, the test line (T line) is the 7D9 antibody (for coating), the sample in the pads is the 10C5 antibody (containing fluorescent particles, for marking), and the measured object is the CRP (C-reactive protein). When serum was added, the effect of the absorbent pad, CRP, 10C5 antibody, and 7D9 antibody in the blood are combined as a stable structure at the T line; the 105C and goat anti-mouse polyclonal antibody also binds in a stable structure.
Figure 15. Test strip
We obtained the CRP concentration in the serum by using the scanning-fluorescence reader because the CRP concentration in a healthy body is low (<5 mg/L); however, if the body is infected by bacteria or the tissue is injured, the concentration will increase significantly. Thus, we can determine the health of the blood. We used this test strip in all of the following tests; the detailed tests and data are as follows.
5.1. Linear Relationship
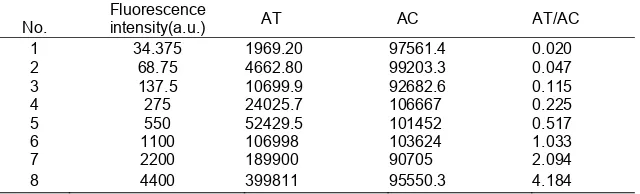
When we used standard strips, fixed samples of known concentration were diluted in different proportions and the fluorescence intensity was known. The reader measured the value of the area of the control line and test line and determined the linear relationship of the data. The data covering the fixed concentration sample are shown below (Table 2):
Table 2. Fluorescence intensity and AT/AC relationship
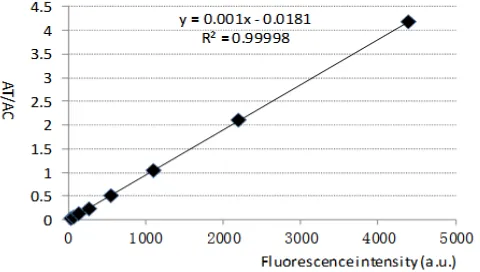
By adding trend-lines, formulas and correlation coefficients in excel, we analyzed these data and obtained fluorescence intensity AT/AC linear relationshipas shown in Figure 16.
Figure 16. Fluorescence intensity AT/AC linear relationship
Figure 16 shows that the linear relationship between the fluorescence intensity and AT/AC isy=0.0010x-0.0181, the correlation coefficient R =0.999982 illustrating the excellent linear relationship. Therefore, we can use this linear relationship as the foundation for further measurements of the test strip with unknown concentrations.
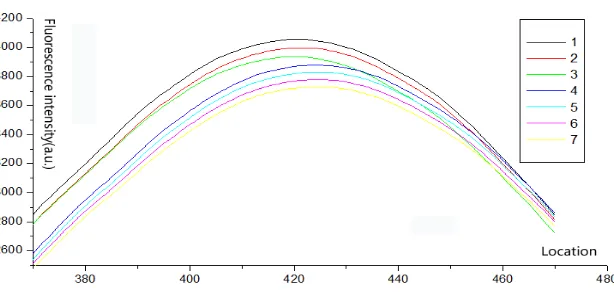
5.2. Reading Repeatability
Detecting the identical test strip multiple times verifies the stability of the scanning-fluorescence reader. Figure 17 displays the results from 7 repeated trials of the identical strip.
Figure 17. Results of repeatability detection
Figure 18. Enlarged view of wave attenuation
5.3. Accuracy
Serum was with a known CRP concentration was added to the test strip; we tested each strip 3 times to compare the average and theoretical value (known concentration) shown in Table 3.
Table 3. Results of the accuracy detection
Strip# Quantitative (a.u.) Avg.(a.u.) Theoretical (a.u.)
Relative deviation 1# 137.37,127.59,141.34 142.305 137.5 1.50%
2# 523.30,532.14,523.91 526.45 550 4.28%
3# 2237.91,2245.46,2252.14 2245.17 2200 2.05%
Low/Middle/High strips were measured separately and we found that the CRP concentration of each test fluctuated near the theoretical value. All deviations were met the requirements of the equipment.
6. Conclusion
Acknowledgements
This work was supported by the National Natural Science Foundation of China(Grants No. 81172885) and the Major program of Science and Technology of Fujian Province (Grant No. 2012Y4011).
References
[1] Luppa PB, Müller C, Schlichtiger A, et al. Point-of-care testing (POCT): Current techniques and future perspectives. TrAC Trends in Analytical Chemistry. 2011; 30(6): 887-898.
[2] Kost GJ, Tran NK, Tuntideelert M, et al. Katrina, the tsunami, and point-of-care testing optimizing rapid response diagnosis in disasters. American journal of clinical pathology. 2006; 126(4): 513-520. [3] Price CP, Kricka LJ. Improving healthcare accessibility through point-of-care technologies. Clinical
Chemistry. 2007; 53(9): 1665-1675.
[4] Qiu X, Liu C, Mauk MG, et al. A portable analyzer for pouch-actuated, immunoassay cassettes. Sensors and Actuators B: Chemical. 2011; 160(1): 1529-1535.
[5] Wang S, Zhang C, Wang J, et al. Development of colloidal gold-based flow-through and lateral-flow immunoassays for the rapid detection of the insecticide carbaryl. Analytica Chimica Acta. 2005; 546(2): 161-166.
[6] Leung W, Chan CP, Rainer TH, et al. InfectCheck CRP barcode-style lateral flow assay for semi-quantitative detection of C-reactive protein in distinguishing between bacterial and viral infections. Journal of immunological methods. 2008; 336(1): 30-36.
[7] Li JJ, Ouellette AL, Giovangrandi L, et al. Optical scanner for immunoassays with up-converting phosphorescent labels. IEEE Transactions on Biomedical Engineering. 2008; 55(5): 1560-1571. [8] Yan Z, Zhou L, Zhao Y, et al. Rapid quantitative detection of Yersinia pestis by lateral-flow
immunoassay and up-converting phosphor technology-based biosensor. Sensors and Actuators B: Chemical. 2006; 119(2): 656-663.
[9] Huang L, Zhou L, Zhang Y, et al. A simple optical reader for upconverting phosphor particles captured on lateral flow strip. IEEE Sensors Journal. 2009; 9(10): 1185-1191.
[10] Corstjens P, Li S, Zuiderwijk M, et al. Infrared up-converting phosphors for bioassays. IEE Proceedings-Nanobiotechnology. 2005; 152(2): 64-72.
[11] Du Clos TW. Function of C-reactive protein. Annals of medicine. 2000; 32(4): 274-278.
[12] Sin KK, Chan CPY, Leung WM, et al. Fluorogenicnanocrystals for highly sensitive detection of C-reactive protein. IEEE Proceedings-Nanobiotechnology. 2006; 153(3): 54-58.
[13] Erlinger TP, Platz EA, Rifai N, et al. C-reactive protein and the risk of incident colorectal cancer. Jama. 2004; 291(5): 585-590.
[14] Danesh J, Wheeler JG, Hirschfield GM, et al. C-reactive protein and other circulating markers of inflammation in the prediction of coronary heart disease. New England Journal of Medicine. 2004; 350(14): 1387-1397.
[15] Li M, Sheng E, Yuan Y, et al. Sensitive time-resolved fluoroimmunoassay for quantitative determination of clothianidin in agricultural samples. Environmental Science and Pollution Research. 2014;, 21(9): 5803-5809.
[16] Liu TC, Chen MJ, Ren ZQ, et al. Development of an improved time-resolved fluoroimmunoassay for simultaneous quantification of C-peptide and insulin in human serum. Clinical biochemistry. 2014; 47(6): 439-444.
[17] Uehara M, Lapcı́k O, Hampl R, et al. Rapid analysis of phytoestrogens in human urine by time-resolved fluoroimmunoassay. The Journal of steroid biochemistry and molecular biology. 2000; 72(5): 273-282.
[18] Handa-Corrigan A, Nikolay S, Jeffery D, et al. Controlling and predicting monoclonal antibody production in hollow-fiber bioreactors. Enzyme and microbial technology. 1992; 14(1): 58-63.
[19] Liu H, Wang Y, Wang L. A Low-Cost Remote Healthcare Monitor System Based on Embedded Server. TELKOMNIKA Indonesian Journal of Electrical Engineering. 2013; 11(4): 1750-1756.
[20] Shuo L, Shuqiang W, Leina S. Application and research in small current grounding system based on ARM. Journal of Chemical & Pharmaceutical Research. 2014; 6(2): 72-76.
[21] Li Z, Zhong Z, Zhu W, et al. A Hardware Time Stamping Method for PTP Messages Based on Linux system. TELKOMNIKA Indonesian Journal of Electrical Engineering. 2013; 11(9): 5105-5111.