DOI: 10.12928/TELKOMNIKA.v14i2A.4362 314
Chaotic Time Series Forecasting Based on Wave Echo
State Network
Liu Jun-xia1, Jia Zhen-hong2
1,2
School of Information Science and Engineering, Xinjiang University, Urumqi, Xinjiang Province, 830046 China
1
Department of Electrical and Information, Xinjiang Institute of Engineering, Urumqi, Xinjiang Province, 830023 China
*Corresponding author, e-mail: [email protected]
Abstract
The chaotic time series forecasting oriented to the network traffic forecasting is put forward in order to analyze the behavioral traits of the network traffic and make forecasting through modeling. Firstly the time series of one-dimensional network traffic is reconstructed into a multi-dimensional time series and then the support vector machine is taken as a position of bird’s nest to find the optimal parameters through the simulation of parasitism and reproduction mechanism of cuckoo species and finally the network traffic forecasting model is to be established based on the optimal parameters and the performance of chaotic time series forecasting will be tested through the simulation experiment. The simulation result shows that, compared with the reference model, the chaotic time series forecasting improves the forecasting accuracy of the network traffic and more accurately demonstrates the complex change trend of the network traffic and provides the chaotic network traffic with a new research tool.
Keywords: Network traffic forecasting; Support vector machine; Cuckoo search algorithm; Parameter optimization
1. Introduction
2. Phase Space Reconstruction and Support Vector Machine
When the chaos theory is applied to the network traffic forecasting, it mainly includes the phase space reconstruction (phase space reconstruction, PSR), the forecasting model selection and optimization problems, and the phase space reconstruction determines the optimal delay time (τ) and the embedding dimension (m) and recovers the original dynamics system of the chaotic time; the forecasting model undertakes learning and modeling based on the time series upon reconstruction and forecast the value in the future.
2.1. Phase Space Reconstruction
Assume that the network traffic time series is { ( )};x i i1, 2,,n, where n represents the time series data number and the embedding dimension is m, the time delay is τ, and then the employed network traffic time series based on the Takens theory can be reconstructed into:
( )
(
(
1) ,
, (
), ( )
X i
x i
m
x i
x i
(1)Where, X i( ) represents the time series upon reconstruction.
It can be known from Equation (1), τ and m determine the advantages and disadvantages of the phase space reconstruction result, and therefore, it is very important to select τand m. The time delay is calculated with the mutual information method is the Thesis, the CAO method is employed to select m and the small-data method is employed to calculate the Lyapunov exponents to check whether the network traffic time series is of the chaotic characteristic or not [10].
2.2. Support Vector Machine Algorithm
After the phase space reconstruction is carried out for the network traffic time series through the Equation (1), a multi-dimensional network traffic time can be obtained, and assume the current time is
i
, the sample number of training set isn
, and then the training set can be represented as: { ( ), ( ),X i y i i(m1) ,,n1}, of which the X i( ) Rm, yiR and m are input space dimensionalities. SVM modeling actually is to map the input sample to the high-dimensional characteristic space F through the non-linear mapping function ߮ሺܺሻ and then the linear regression is carried out in F; the regression function of SVM in high-dimensional characteristic space is:
( )
( )
f x
w
X
b
(2)Where, w represents the weight vector and b the offset vector.
Based on the institutional risk minimization principle, the SVM regression can be converted into the following optimization problem, that is:
2 *
1
*
*
1
min
(
)
2
. .
( )
( )
,
0,
1, 2,
,
i
n
i i i
i i
i
i i
J
w
C
s t
y
w
x
b
w
x
b
y
i
n
(3)
Where,
w
is an item related to the complexity of Function f,
representing theSaid optimization problem changes into typical convex quadratic optimization problem through the introduction of Lagrangian multiplier, that is:
* * * * 1 * * 1 1 * * 1
1
( , , , , , , , )
(
)
2
(
( )
(
( ))
(
)
n i i i n ni i i i i i i i
i i
n
i i i i i
L wb
w C
y f x
y f x
(4)Where,
i and
i* represent Lagrangian multipliers.In order to accelerate the solution, the Equation (3) is converted into dual form, then
* * * , 1 * * 1 1 * , 1 * 1 *
1
( ,
)
(
)(
)( ( ), ( ))
2
(
)
(
)
. .
(
)
(
) 0
0
,
ni i j j i j
i j
n n
i i i i i
i i
n
i i i i j
n
i i i
i i
W
x
x
y
s t
w
x
C
(5)For the linear regression problem, the SVM regression function is:
*
1
( )
(
)( ( ), ( ))
n
i i i
i
f x
x
x
b
(6)For the non-linear forecasting problem, the Kernel F unction
k x x
( , )
i is employed tosubstitute the inner product of vectors
( ( ), ( ))
x
i
x
in the high-dimensional space to avoid the curse of dimensionality, and then the SVM regression function is:*
1
( )
(
) ( , )
n
i i i
i
f x
k x x
b
(7)Researches show when the priori knowledge of process is absent, compared with other kernel functions, the radial basis kernel function has fewer parameters and better performance [11]. Therefore, the radial basis kernel function is taken as the kernel function of SVM in the Thesis, and its definition is as follows:
2
2
( , ) exp
2
i j
i j
x x
K x x
Where, is the width parameter of radial basis kernel function.
It can be known from the SVM modeling process, that the learning accuracy and generalization capacity performance based on network traffic forecasting model of SVM are closely related to the selection of penalty factor C, the insensitive factor
and the parameter
of the kernel function; the improved cuckoo search algorithm (MCS) is employed to optimize the SVM parameters in the Thesis and so as to improve the forecasting accuracy of the network traffic.3. SVM Parameters Optimization through MCS 3.1. Cuckoo Search Algorithm
Cuckoo Search (CS) is a swarm intelligence optimization algorithm put forward by Yang and Deb in 2009, and it is based on the parasitism and reproduction strategy of cuckoo species Pa and combined with special Levy flight mode of birds and fruit flies [12-14]. In order to simulate the nest searching behavior of cuckoo, three rules are specifically set in CS as follows:
(1) Cuckoo lays an egg at a time, representing a solution to one problem and the egg is put in the bird’s nest for incubation at random.
(2) Part of bird’s nests hold high-quality eggs, namely good solutions, and these bird’s nests will be kept to the next generation.
(3) Number of available bird’s nest is unchangeable and the probability that the cuckoo’s eggs are found by the host bird is Pa∈(0,1); once certain bird’s nest is found, the host bird will abandon the bird’s egg or the bird’s nest and search for a new one to avoid affecting the solution to optimization problem.
Based on those three rules, assume
x
i( )t representing the position of bird’s nest of the t generation of the I bird’s nest, L(λ) representing the random search path, and then the update formula of the path and position that cuckoo finds its nest is as follows:( 1) ( )
( ),
1, 2,
,
t t
i i
x
x
L
i
n
(9)Where,
represents the controlled variable of step length;
represents the point-to-point multiplication.A number r is produced randomly upon the position update, and if r is larger than Pa, (t 1)
i
x
will randomly change, otherwise will not change and finally a set of better bird’s nestposition
y
i(t1)with better test values will be kept and it still is recorded asx
i(t1).Levy flight is employed in basic CS algorithm to produce step length with randomness, lack of adaptability and incapable of ensuring rapid convergence. In order to figure out the relation between global optimization capacity and the accuracy, based on the basic CS algorithm and the search results at different stages, the step length size undergoes the dynamic adjustment of adaptability. Assume the step length strategy of adaptability adjustment for the optimal bird’s nest position:
min ( max min)
i i
step step step step d (10)
Where, stepmax and stepmin respectively represent the maximum and minimum step lengths.
݀ is defined as follows:
max i best i
n
n
d
d
(11)The step length of adaptability adjustment is allowable based on the Equation (10), and the closer the i bird’s nest position is to the optimal position, the smaller the step length is; the farther the i bird’s nest position is to the optimal position, the larger the step length is; therefore, based on the result of previous generation iteration, the current moving step length will be dynamically updated with better adaptability.
3.2. Network Traffic of Chaotic Time Series Forecasting
(1) Collect the time series data of network traffic and carry out phase space reconstruction for the time series to generate SVM learning sample.
(2) Determine the value range of C,
and , as well as the maximum step length stepmax, the minimum step length stepmin and the maximum number of iteration Nmax by experience,(3) Initial probability parameter Pa=0.7 and randomly produce n bird’s nest positions: (0) (0) (0) (0)
1
,
2,
,
Ti n
p
x
x
x
, and each bird’s nest positions correspond to onethree-dimensional vector (C, , ) and then calculate the cross validation error of training set corresponding to each set of bird’s nest position to find out currently optimal bird’s nest ݔሺሻ and corresponding minimum error Fmin.
(4) Keep the optimal bird’s nest position ݔሺሻ corresponding to the minimum error Fmin of previous generation.
(5) Calculate the step length of Levy flight in Equation (10) and update other bird’s nests based on the Levy flight to obtain a set of new bird’s nest position and calculate their forecasted errors.
(6) Based on the forecasted error, compare the new bird’ s nest position and the bird’s
nest position of the previous generation
p
t1
x
1(t1),
x
2(t1),
,
x
n(t1)
T, replace worse bird’ snest position with the better one to obtain a set of relatively excellent bird’ s nest position ( ) ( ) ( )
1
,
2,
,
Tt t t
t n
k
x
x
x
.(7) Compare random number r with Pa, keep bird’s nest with smaller probability found in kt , and meanwhile randomly change bird’ s nest with larger probability to obtain a set of new bird’s nest position, calculate the forecasted error corresponding to the new bird’s nest position and compare it with the forecasted error corresponding to each bird’s nest position in kt, and replace the bird’s nest position with worse test value with bird’s nest position with small forecasted error to obtain a set of new relatively excellent bird’s nest position
( ) ( ) ( ) 1 , 2 , ,
T
t t t
t n
p x x x .
(8) Find out Step (7) and finally find out the optimal bird’s nest position
x
b( )t in pt and estimate whether its minimum error Fmin satisfies the accuracy requirements of network traffic forecasting or not; if it does so, stop searching and output the global minimum error Fmin and corresponding optimal bird’s nestx
b( )t , otherwise, return to Step (4) for continuous optimization.(9) Based on the C,
and corresponding to the optimal bird’s nest position ݔሺ௧ሻ taken as the optimal parameters of SVM, re-train the training set to establish the forecasting model of network traffic and use the model to test the test set.4. Experiment 4.1. Experiment Data
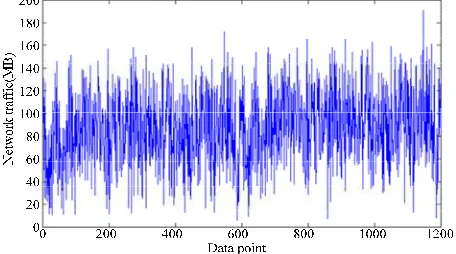
The network traffic data comes from the traffic library: http://newsfeed.ntcu.net/~news/2010 and the network visiting traffic per hour from July 1, 2014 to August 19, totaling 50 days was collected to obtain 5024=1200 network traffic time series shown in Figure 1 specifically. The network traffic time series of the first 45 days constitute the training set to establish the forecasting model of network traffic; the network traffic time series of the last 10 days constitute the validation set to inspect the forecasting effect of forecasting model of network traffic.
Figure 1. Network traffic time series
4.2. Training Sample Setup
Firstly process the training set of network traffic time with mutual information method to obtain the delay time τ=1, and then use Cao method to obtain the embedding dimensionality and the minimum embedding dimensionality of phase space reconstruction of traffic time series m=12, and finally use the small-data method to obtain the maximum Lyapunov exponent-0.01952; it shows that the network traffic time series is of chaotic characteristics. Making use of τ=1 and m=12, and based on the Equation (1), carry out phase space reconstruction for the training set of network traffic to obtain 948 training samples.
SVM is mostly sensitive to the data in [0 and 1] and in order to improve the training efficiency of SVM, the normalization processing will be carried out specifically as follows for the training set upon reconstruction:
ݔᇱൌ ݔ െ ݔ୫୧୬
ݔ୫ୟ୶െ ݔ୫୧୬ (12)
Where, ݔ represents the original data of network traffic; ݔ୫୧୬ and ݔ୫ୟ୶ respectively represent the maximum value and the minimum value.
4.3. Reference Model and Evaluation Standard
Select the genetic algorithm optimization SVM (GA-SVM) and particle algorithm optimization SVM (PSO-SVM) as the reference models in order to make the forecasting method more persuasive, and use one-step forecasting method for all models, namely: take the first k network traffic data as the initial training samples to forecast the k+1 network traffic data and then combine the k+1 network traffic data with the initial training set for next forecasting, etc. and obtain the forecasted values of all validation samples. Take the root-mean-square error (RMSE) and mean absolute percentage error (MAPE) as the evaluation indexes of models performance, and they are defined as follows:
2
1
1
( ( ) ( ))
k
i
R M S E x i x i
n
(13)
1
1 ( ) ( ) 1 0 0 ( )
k
i
x i x i M A P E
n x i
(14)Where, ݔ and ݔො respectively represent the actual value of forecasted value of network traffic and n the number of test samples.
4.4. Result and Analysis
developed on the Matlab 2012 Platform and the Libsvm tool cabinet of Chih-Jen Lin in Taiwan is called for programming to realize the forecasting model and cross validation algorithm and take 10-fold cross validation results as the criteria for parameters selection.
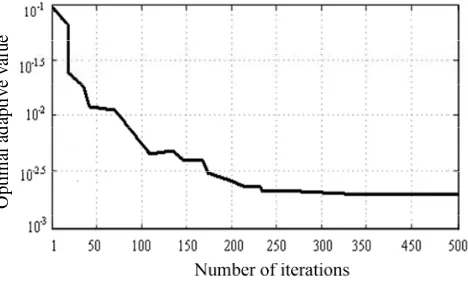
Figure 2 describes the change curve of adaptive value in the SVM parameters optimization process with PSO, GA and MCS algorithms, and the results show that the retraction speed and global search capacity of MCS are superior to the reference algorithms PSO and GA and it has higher learning accuracy; the comparison result shows that it is feasible and effective to use MCS to optimize the SVM parameters so as to obtain relatively excellent SVM parameters.
Optimal adaptive value
(a) SVM parameters optimization curve based on GA
(b) SVM parameters optimization curve based on PSO
[image:7.595.183.412.551.689.2](c) SVM parameters optimization curve based on MCS
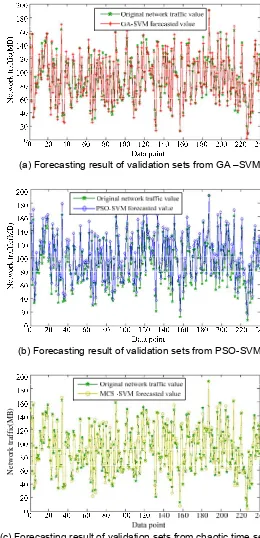
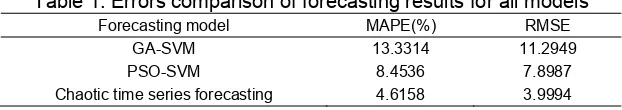
(2) Comparison of forecasting results: Corresponding network traffic forecasting model is set up by SVM based on GA, PSO and MCS and 240 validation sets are forecasted and the forecasting results are shown in Figure 3 and the MAPE and EMSE of the forecasting results are shown in Table 1.
(a) Forecasting result of validation sets from GA –SVM
(b) Forecasting result of validation sets from PSO-SVM
Net
w
ork t
raff
ic(
MB)
[image:8.595.158.418.157.695.2](c) Forecasting result of validation sets from chaotic time series
Table 1. Errors comparison of forecasting results for all models
Forecasting model MAPE(%) RMSE
GA-SVM 13.3314 11.2949
PSO-SVM 8.4536 7.8987
Chaotic time series forecasting 4.6158 3.9994
It can be known from Figure 3 that the forecasted value of chaotic time series forecasting is relatively closed to actual network traffic value, while the deviation between values of GA-SVM and PSO-SVM and the actual network traffic values are relatively larger and also the forecasting result of chaotic time series forecasting is more stable, which shows that the network traffic forecasting model of the chaotic time series forecasting is more excellent in performance.
Furthermore, it can be known from the analysis of errors of forecasting results for all models in Table 1, that the error of N forecasting result of the chaotic time series forecasting is smaller than that of the reference models GA-SVM and PSO-SVMN and the forecasting accuracy of network traffic is improved; the comparison result shows that due to the MCS algorithm with the capacities of detailing the local search and global search, more excellent SVM parameters can be found, and the established forecasting model of network traffic better reflects the change trend of network traffic and provides s new research method for the SVM parameters optimization of the forecasting model of network traffic.
5. Conclusion
A forecasting model of network traffic with MCS algorithm optimization SVM is presented for the SVM parameters optimization problem in the network traffic forecasting process. The simulation result shows that MCS better solves the problem about SVM parameters optimization, establishes forecasting model of network traffic capable of more accurately describing complex change rule of the network traffic and improves the forecasting accuracy of the network traffic and it has good application prospect in network traffic forecasting.
Acknowledgements
This study is supported by natural science fund project young teachers in colleges and universities department of education in Xinjiang Province, the serial number of the project: XJEDU2014S074.
References
[1] Lin Y, Yang J, Lv Z. A Self-Assessment Stereo Capture Model Applicable to the Internet of Things.
Sensors. 2015; 15(8): 20925-20944.
[2] Gang Li, Xiaofeng Zhao, Dianzhong Wen, Yang Yu. Research on Silicon-based Planar Spiral
Inductance Coil Based on Microelectromechanical System. TELKOMNIKA Telecommunication
Computing Electronics and Control. 2015; 13(4): 1127-1132.
[3] Lv Z, Yin T, Han Y. WebVR-web virtual reality engine based on P2P network. Journal of Networks. 2011; 6(7): 990-998.
[4] Yang J, He S, Lin Y.Multimedia cloud transmission and storage system based on internet of things.
Multimedia Tools and Applications. 2015.
[5] Wei L, Hua LX. The Error Control Methods of Information System in Sensor Networks. Bulletin of Electrical Engineering and Informatics. 2015; 4(3): 210-216.
[6] Yang J, Chen B, Zhou J. A Low-Power and Portable Biomedical Device for Respiratory Monitoring with a Stable Power Source. Sensors, 2015; 15(8): 19618-19632.
[7] Wei R, Shen X, Yang Y. Urban Real-Time Traffic Monitoring Method Based on the Simplified Network Model. International Journal of Multimedia & Ubiquitous Engineering. 2016; 11(3):199-208. [8] Xinchao Song, Yishuang Geng. Distributed community detection optimization algorithm for complex
networks. Journal of Networks. 2014; 9(10): 2758-2765.
[10] Jinyu Hu and Zhiwei Gao. Modules identification in gene positive networks of hepatocellular carcinoma using Pearson agglomerative method and Pearson cohesion coupling modularity. Journal of Applied Mathematics. 2012.
[11] Jiang D, Xu Z, Chen Z. Joint time-frequency sparse estimation of large-scale network traffic.
Computer Networks. 2011; 55(15): 3533-3547.
[12] M Abdar, SRN Kalhori, T Sutikno, IMI Subroto, G Arji. Comparing Performance of Data Mining Algorithms in Prediction Heart Diseases. International Journal of Electrical and Computer Engineering (IJECE). 2015; 5(6): 1569-1576.
[13] Jinyu Hu, Zhiwei Gao and Weisen Pan. Multiangle Social Network Recommendation Algorithms and Similarity Network Evaluation. Journal of Applied Mathematics. 2013.