CHAPTER 5
DATA ANALYSIS AND DISCUSSION
5.1.Data Analysis in Manual Page Sequencing Process
5.1.1. Current Work Method Analysis
1. First Current Work Method Analysis
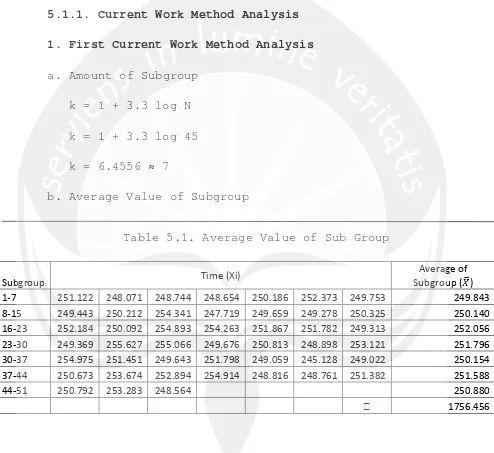
a. Amount of Subgroup k = 1 + 3.3 log N k = 1 + 3.3 log 45 k = 6.4556 ≈ 7
b. Average Value of Subgroup
Table 5.1. Average Value of Sub Group
Subgroup Time (Xi)
Average of Subgroup (ܺത) 1-7 251.122 248.071 248.744 248.654 250.186 252.373 249.753 249.843 8-15 249.443 250.212 254.341 247.719 249.659 249.278 250.325 250.140 16-23 252.184 250.092 254.893 254.263 251.867 251.782 249.313 252.056 23-30 249.369 255.627 255.066 249.676 250.813 248.898 253.121 251.796 30-37 254.975 251.451 249.643 251.798 249.059 245.128 249.022 250.154 37-44 250.673 253.674 252.894 254.914 248.816 248.761 251.382 251.588
44-51 250.792 253.283 248.564 250.880
ܺധ
=
∑ పധധധ ܺധ= 1756.456 7
ܺധ=250.922
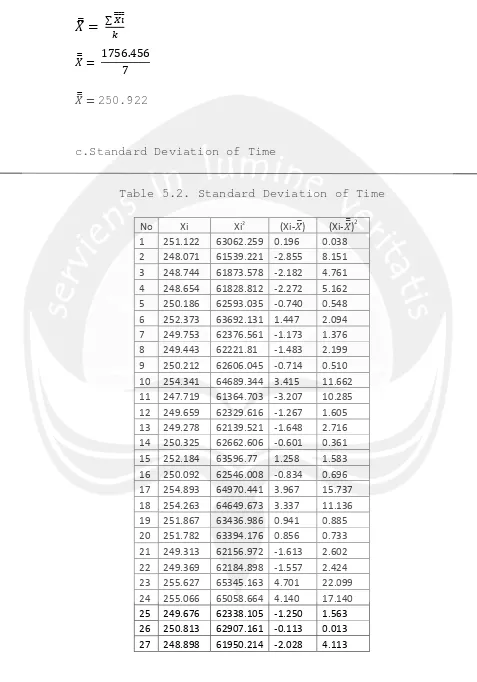
c.Standard Deviation of Time
Table 5.2. Standard Deviation of Time
No Xi Xi2 (Xi-ܺത) (Xi-ܺധ)2
No Xi Xi2
(Xi-ܺത) (Xi-ܺധ)2 28 253.121 64070.241 2.195 4.818 29 254.975 65012.251 4.049 16.394 30 251.451 63227.605 0.525 0.276 31 249.643 62321.627 -1.283 1.646 32 251.798 63402.233 0.872 0.760 33 249.059 62030.385 -1.867 3.486 34 245.128 60087.736 -5.798 33.617 35 249.022 62011.956 -1.904 3.625 36 250.673 62836.953 -0.253 0.064 37 253.674 64350.498 2.748 7.552 38 252.894 63955.375 1.968 3.873 39 254.914 64981.147 3.988 15.904 40 248.816 61909.402 -2.110 4.452 41 248.761 61882.035 -2.165 4.687 42 251.382 63192.91 0.456 0.208 43 250.792 62896.627 -0.134 0.018 44 253.283 64152.278 2.357 5.555 45 248.564 61784.062 -2.362 5.579
11291.67 2833619.8 - 244.7051
ߪ
=
ට
∑(ିധ)మ ேିଵߪ
=
ට
ଶସସ.ହ଼ ସସσ = 2.358
d. Standard deviation from sub group average distribution
e. Upper Control Limit (UCL) and Lower Control Limit (LCL)
ܷܥܮ= ܺത+ (3 × ߪത)
= 250.922 + (3 × 0.891)
= 253.595
ܮܥܮ= ܺത− (3 × ߪത)
= 250.922− (3 × 0.891)
= 248.249
Control data Test LCL ≤ ܺଓതതത ≤ UCL
f. Sufficiency data test
The test used 5 % for precision and 95% for confidence rate.
g. Cycle Time Average
ܥݐ= ∑ ܺ
2. Second Current Work Method Analysis
The second current work method analysis is done same with the previous analysis for 1st work method analysis. The analysis is shown in Appendix 1. The result of the analysis shown as :
a. Amount of Subgroup = 7
b. Average Value of Subgroup = 262.852 c. Standard Deviation of Time = 2.871 d. Standard Deviation From
Subgroup Average Distribution = 1.085 e. Upper Control Limit = 265.545
Lower Control Limit = 258.940
Control data Test = Data is Constant f. Sufficiency Data Test = Data is Sufficient g. Cycle Time Average = 262. 915 second
3. Third Current Work Method Analysis
The third current work method analysis is done same with the previous analysis for 1st work method analysis. The analysis is shown in Appendix 1. The result of the analysis is shown as :
a. Amount of Subgroup = 7
b. Average Value of Subgroup = 285.008 c. Standard Deviation of Time = 3.328 d. Standard Deviation From
Subgroup Average Distribution = 1.258 e. Upper Control Limit = 288.726
Lower Control Limit = 281.178
f. Sufficiency Data Test = Data is Sufficient g. Cycle Time Average = 284.952 second
5.1.2. Recommended Work Method Analysis
The recommended work method analysis is done same with the previous analysis for 1st work method analysis. The analysis is shown in Appendix 1. The result of the analysis is shown as :
a. Amount of Subgroup = 9
b. Average Value of Subgroup = 210.32 c. Standard Deviation of Time = 2.120 d. Standard Deviation From
Subgroup Average Distribution = 0.547 e. Upper Control Limit = 211.961
Lower Control Limit = 208.679
Control data Test = Data is Constant f. Sufficiency Data Test = Data is Sufficient g. Cycle Time Average = 210.318 second h. Recommended Left Hand-Right Hand Side Chart
5.1.3. Standard Time for Current and Recommended Work
Method
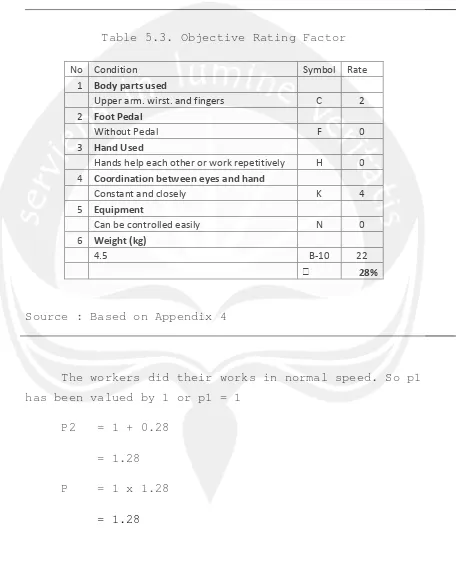
1. Rating Factor
Table 5.3. Objective Rating Factor
No Condition Symbol Rate
1 Body parts used
Upper arm. wirst. and fingers C 2 2 Foot Pedal
Without Pedal F 0
3 Hand Used
Hands help each other or work repetitively H 0 4 Coordination between eyes and hand
Constant and closely K 4
5 Equipment
Can be controlled easily N 0
6 Weight (kg)
4.5 B-10 22
28%
Source : Based on Appendix 4
The workers did their works in normal speed. So p1 has been valued by 1 or p1 = 1
P2 = 1 + 0.28 = 1.28 P = 1 x 1.28
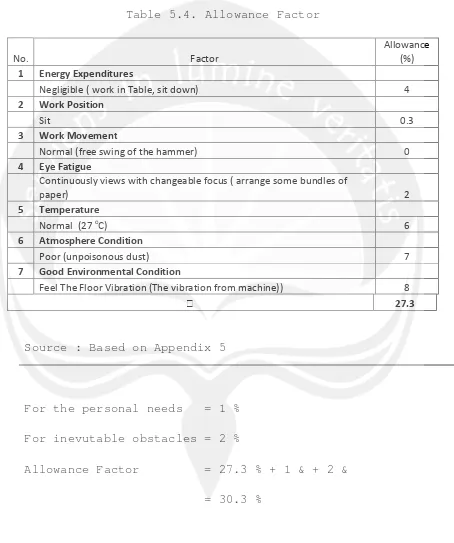
2. Allowance Factor
Table 5.4. Allowance Factor
No. Factor
Allowance (%) 1 Energy Expenditures
Negligible ( work in Table, sit down) 4
2 Work Position
Sit 0.3
3 Work Movement
Normal (free swing of the hammer) 0
4 Eye Fatigue
Continuously views with changeable focus ( arrange some bundles of
paper) 2
5 Temperature
Normal (27oC) 6
6 Atmosphere Condition
Poor (unpoisonous dust) 7
7 Good Environmental Condition
Feel The Floor Vibration (The vibration from machine)) 8
27.3
Source : Based on Appendix 5
For the personal needs = 1 % For inevutable obstacles = 2 %
2. Standard Time
a. Standard Time for 1st Current Work Method Normal Time = Ct x p
= 250.926 x 1.28 = 321. 185 second Standard Time = Nt x (1 + a)
= 321.185 x ( 1 + 0.303) = 418.504 second
b. Standard Time for 2nd Current Work Method Normal Time = Ct x p
= 262.915 x 1.28 = 336.531second Standard Time = Nt x (1 + a)
= 382.805 x ( 1 + 0.303) = 438.500 second
c. Standard Time for 3rd Current Work Method Normal Time = Ct x p
= 284.952 x 1.28 = 364.739 second Standard Time = Nt x (1 + a)
d. Standard Time for Recommended Work Method Normal Time = Ct x p
= 210.318 x 1.28 = 269.207 second Standard Time = Nt x (1 + a)
= 210.318 x ( 1 + 0.303) = 350.777 second
5.1.4. Evaluation of Work Method Improvement
1. Percentage Improvement for 1st Method % St Improvement = ୗ୲ଵ–ୗ୲ ୰ୣୡ୭୫୫ୣ୬ୢୣୢ
ୗ୲ଵ x 100% = ସଵ଼.ହସ – ଷହ.
ସଵ଼.ହସ x 100%
= 16.183 %
2. Percentage Improvement for 2nd Method % St Improvement = ୗ୲ଶ–ୗ୲ ୰ୣୡ୭୫୫ୣ୬ୢୣୢ
ୗ୲ଶ x 100%
= ସଷ଼.ହ – ଷହ.
ସଷ଼.ହ x 100%
= 19.786 %
3. Percentage Improvement for 3rd Method % St Improvement = ୗ୲ଷ–ୗ୲ ୰ୣୡ୭୫୫ୣ୬ୢୣୢ
5.2. Data Analysis in Binding Process
Standard Time = ୳୲୮୳୲ ୗୣୡ୭୬ୢ
= ଷ ୱୣୡ୭୬ୢ
ଷ ୠ୭୭୩ୱ
= 1.2 second/ book
St for 300 books = 1.2 second/ books x 300 books
= 360 second
5.3. Data Analysis in Cutting Process
Standard Time = ୳୲୮୳୲ ୗୣୡ୭୬ୢ
= ଽ ୱୣୡ୭୬ୢ
ଷ ୠ୭୭୩ୱ
= 0.3 second/ book
St for 300 books = 0.3 second/ books x 300 books
= 90 second
5.4. Data Analysis in Inspection and Packaging
The data analysis is done same with the previous analysis for 1st current work method analysis in manual page sequencing process. The analysis is shown in Appendix 2. The result of the analysis shown as :
a. Amount of Subgroup = 5
Subgroup Average
Distribution = 1.079
e. Upper Control Limit = 51.428 Lower Control Limit = 44.954
Control data Test = Data is Constant f. Sufficiency Data Test = Data is Sufficient g. Cycle Time Average = 48.191 second
h. Rating Factor = 1.33
i. Normal Time = 64.094
j. Allowance Factor = 0.303 k. Standard Time = 83.515 l. Standard Time for 30 boxes = 2505.436
5.5. Transport Time
5.5.1. Transport Time from Manual Page Sequencing
Process to Binding Process
The transport time from manual page sequencing process to binding process is shown in Appendix 3. The result of the analysis shown as :
a. Amount of Subgroup = 5
b. Average Value of Subgroup = 72.309 c. Standard Deviation of Time = 1.127 d. Standard Deviation From
Subgroup Average Distribution = 0.564 e. Upper Control Limit = 74.001
Lower Control Limit = 70.167
5.5.2. Transport Time from Binding Process to Cutting
Process
The transport time from binding process to cutting process analysis is shown in Appendix 3. The result of the analysis shown as :
a. Amount of Subgroup = 5
b. Average Value of Subgroup = 42.989 c. Standard Deviation of Time = 1.797 d. Standard Deviation From
Subgroup Average Distribution = 0.898 e. Upper Control Limit = 45.683
Lower Control Limit = 40.295
Control data Test = Data is Constant f. Sufficiency Data Test = Data is Sufficient g. Transport Time Average = 42.989 second
5.5.3. Transport Time Cutting Process to Inspection and
Packaging Process
The transport time from cutting process to inspection and packaging process analysis is shown in Appendix 3. The result of the analysis shown as :
a. Amount of Subgroup = 5
b. Average Value of Subgroup = 21.913 c. Standard Deviation of Time = 1.263 d. Standard Deviation From
Subgroup Average Distribution= 0.632 e. Upper Control Limit = 23.089
Lower Control Limit = 20.017
f. Sufficiency Data Test = Data is Sufficient g. Transport Time Average = 21.912 second
5.6. Standard Time in Finishing Department
5.6.1. Standard Time per 30 boxes
St30 box = St1+ Tt1+ St2 + Tt2 + St3 + Tt3 + St4
= 350.777 + 72.309 + 360 + 42.989 + 90 + 21.912 + 2505.436
= 3443.423 second Notice :
St1 : Standard Time for Manual Page Sequencing St2 : Standard Time for Binding Process
St3 : Standard Time for Cutting Process
St4 : Standard Time for Inspection and Packaging
Tt1 : Transport Time from Manual Page Sequencing to Binding
5.6.1. Standard Time per box
St
box=
ୗ୲యబ ౘ౮ଷ
St
box=
ଷସସଷ.ସଶଷ
ଷ
= 114.781 second / box
5.6.2 Standard Time per Book
St
box=
ୗ୲ౘ౮ଵ
St
box=
ଵଵସ.଼ଵ
ଵ
= 11.478 second / book
5.7. Discussion
5.7.1. Work Method Improvement Step
The improvement of work method is done in the manual sequencing process for optimizing the work method of the workers and also to minimizing the standard time in this division. The improvements done in manual sequencing by eliminating all unnecessary work motion, combining operations, changing the sequences, and simplifyng unnecessary operations. The steps is shown as :
1. Eliminate all unnecessary work motion
Table 5.5. Elimination of The Work Element
No
1st Current Work Method
2nd Current Work Method
3rd Current Work Method
1
Put the bundle vertically in table
Put the bundle vertically in table
Take the bundle vertically
2
-Set the bundle horizontally
Put the bundle vertically
3 -
-Rotate the bundle horizontally
4 -
-Put the bundle horizontally
5 -
-Set the bundle horizontally (2 x)
2. Combine operations or elements
combining the motions. The complete data of combining improvement is shown in appendix 12.
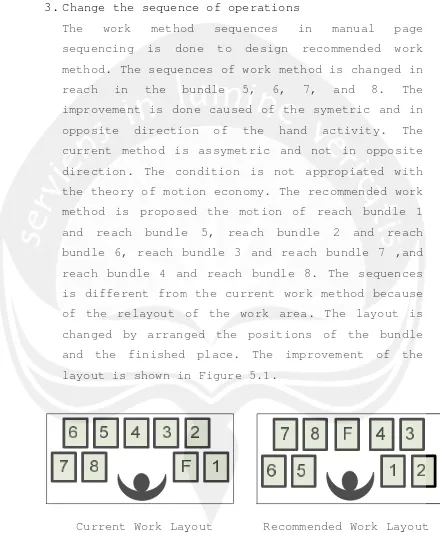
3. Change the sequence of operations
4. Simplify the unnecessary operations
The improvement of simplifying the unnecessary operations is done in 2nd work method. The activity of set the bundle vertically three times is simplificated into two times. The simplification is also done for the layout. The simplifying of the layout is done because of the theory of motion economy.
The all of the improvements are done to make a better work method in sequence Detik-Detik books. The work methods improvement steps is completely shown in Appendix 10, 11, and 12.
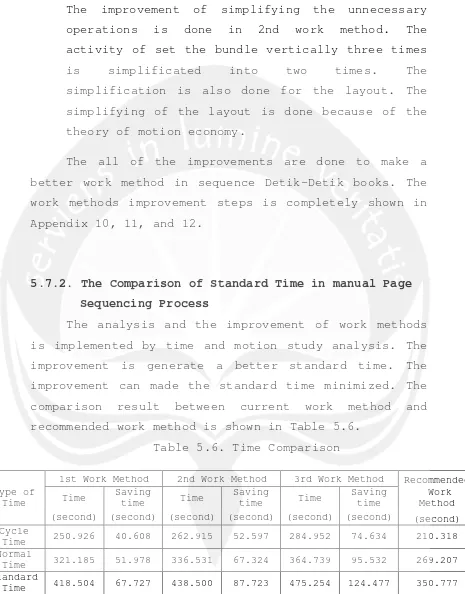
5.7.2. The Comparison of Standard Time in manual Page
Sequencing Process
The analysis and the improvement of work methods is implemented by time and motion study analysis. The improvement is generate a better standard time. The improvement can made the standard time minimized. The comparison result between current work method and recommended work method is shown in Table 5.6.
Table 5.6. Time Comparison
Type of Time
1st Work Method 2nd Work Method 3rd Work Method Recommended
Time Saving
(second) (second) (second) (second) (second) (second) (second)
Cycle
Time 250.926 40.608 262.915 52.597 284.952 74.634 210.318
Normal
Time 321.185 51.978 336.531 67.324 364.739 95.532 269.207
Standard
The better work method is proved by the minimizing of time. The time comparison above showed that the recommended work method give a better standard time for all of the current methods. The improvement of 1st current work method to the recommended work method as amount as 16.183 %. The improvement of 2nd work method is 19,786 % and for the third method is 26.192%. From the standard time improvement, the recommended work method can be defined as better work method.
5.7.3. Standard Time of Whole Process in Finishing
In finishing department of PT.Macanan Jaya Cemerlang, there are no standard time determined before. The production time is only determined depends on the prediction of the PPIC.
Determining the standard time in finishing department of PT. Macanan Jaya Cemerlang is very important. Because of the function, analysis of each division has been calculated to determine the standard time. Because of the different process between manually and by machine, the analysis is also different.
Table 5.7. Standard Time of All Division
No Division
Standard Time (second) 1 Manual Page Sequencing Process 350.777
2 Binding Process 360.000
3 Cutting Process 90.000
4 Inspection and Packaging Process 2505.436
After calculating standard time for each division, the transportation time through the divisions is properly measured. The transportation time is determined by stopwatch time measurement. All of the transportation among the divisions are used manual hand truck to deliver the books. The data of transport time is shown in table 5.8.
Table 5.8. Transport Time
No Route Transportation
Time (second)
1
Manual Sequencing Process to
Binding Process 72.309
2
Binding Process to Cutiing
Process 42.989
3
Cutting Process to Inspection and
Packaging Process 21.912
Table 5.9. Standard Time of Finishing Department
No Unit Standard Time
(second)
1 Standard time per 30 box 3443.243
2 Standard time per box 114.781
3 Standard time per books 11.478