Volume 2, Issue 1 ISSN - 2218-6638 International Journal for Advances in Computer Science March 2011
© IJACS 2010 - All rights reserved
1
Volume 2, Number 1
I nternational Journal for Advances in
Computer Science
I JACS
I SSN: 2218-6638
Volume 2, Issue 1 ISSN - 2218-6638 International Journal for Advances in Computer Science March 2011
© IJACS 2010 - All rights reserved
2
Table of Contents
Message from the Editor ……….3
Editorial Board Members ………. 4
1. A novel approach to Unsupervised Pattern Recognition .……….…...…. 5
2. Utilizing Analytical Hierarchy Process for Pauper House Programme in Malaysia ………. ... 11
3. Examining the Impact of Intranet Usage on Managerial Level Performance At Malaysia Port ....…20
Volume 2, Issue 1 ISSN - 2218-6638 International Journal for Advances in Computer Science March 2011
© IJACS 2010 - All rights reserved
3
Message from the Editor
Thanks for downloading and studying the International Journal for Advances in Computer Science first issue. The purpose of the IJACS journal is to publish the research related with Computer Science and Information Technology. IJACS is a quarterly published online research journal that provides a platform to computer researchers so that they can promote their technological research and achievements. The focus of the journal is to promote the original and latest work related with Computer theory, applications and experiments. The research papers and articles that include in the IJACS journal encourage the original contribution and new insight, industrial applications and short original contribution (Conference published papers with at least 30 percent changes).
Hope to be our regular reader after studying the original and quality research papers.
Editor IJACS
Volume 2, Issue 1 ISSN - 2218-6638 International Journal for Advances in Computer Science March 2011
© IJACS 2010 - All rights reserved
4
Editorial Board Members
Dr. Morven Gentleman Faculty of Computer Science Dalhousie University Canada
Prof. Dr. Marian Vajteršic University of Salzburg , Austria Department of Computer Sciences
Dr. Norwati Mustapha Faculty of Computer Science and IT University Putra Malaysia, Malaysia
Dr. Said Elnaffar
Faculty of Information Technology United Arab Emirates University, UAE
Dr. Yacine Lafifi Department of Computer Science
Guelma University, Algeria
Dr. Hai Wang
Sobey School of Business Saint Mary's University, Canada
Dr. Maryanne Fisher Saint Mary's University Halifax, Canada
Dr. Lili Nurliyana Abdullah Faculty of Computer Science and IT University Putra Malaysia, Malaysia
Professor Dr. Prabhat K. Mahanti
University of New Brunswick Saint John, N.B., Canada
Dr. Vasil Hnatyshin
Volume 2, Issue 1 ISSN - 2218-6638 International Journal for Advances in Computer Science March 2011
© IJACS 2010 - All rights reserved
5
A Novel Approach to Unsupervised Pattern Recognition
Dasika Ratna Deepthi1, P V S Kishore Kumar2 1
Sreenidhi Institute of Science & Technology, Yamnampet, Ghatkesar, Hyderabad, India 2
Wipro Technologies Pvt. Ltd.,Hyderabad, India {radeep07@ gmail.com, [email protected]}
Abstract
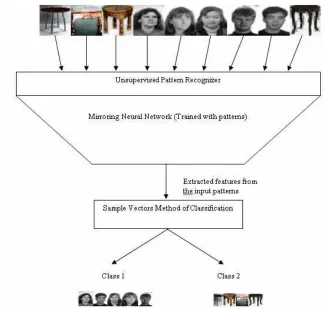
In this paper, we present a new artificial recognition system which performs dimensional reduction, unsupervised learning and classification of the given input patterns. The proposed technique enfolds innovative algorithms development and implementation for feature extraction, self-learning and unsupervised classification of patterns. This automated recognition system also proven to be mathematically exists through our Mirroring Theorem of pattern recognition. The proposed recognizer uses an architecture consisting of artificial neural networks which we call Mirroring Neural Network (MNN) and a new method of clustering. We build the architecture of an unsupervised pattern recognizer, developed the algorithms and implemented (demonstrated) the so called pattern recognizer on example patterns.
Index Terms: Artificial recognition system, self-learning, unsupervised classification, Pattern recognition.
1. Introduction
When a human exposed to the environment of distinct objects, slowly learns from the patterns and could recognizes them. In the process of learning the patterns, human brain focuses on the features present in the patterns through which he/she could recognize/categorize these patterns. In other words, the recognition task is based on the extracted features from the patterns. So, the crucial point to be remembered in the design of the pattern recognizer is that it must have a predecessor called feature extractor. Moreover, it is also important that the feature extractor must extract the relevant features and ignore the irrelevant features, because, the classifier categorizes the patterns based on the extracted features. In our algorithm, we have designed and developed a recognizer that simultaneously extracts the best possible features from the input patterns given, while learning these patterns for classification. This approach what we follow for the recognition task is similar to the human learning process towards the patterns. After learning the patterns based on the extracted features similarity/dissimilarity, one can group/classify the patterns. So, we have developed the unsupervised classifier that follows the feature extractor i.e., the outputs of the feature extractor is given as the inputs to the classifier of the recognition system. The magnificence of our approach to pattern recognition is that the novel feature extractor extorts the best possible features from the given patterns for self-learning (by the recognition system) and the classifier part of the
Volume 2, Issue 1 ISSN - 2218-6638 International Journal for Advances in Computer Science March 2011
© IJACS 2010 - All rights reserved
6 The remainder of this paper is organized as follows: In
section 2, we discuss in detail the technique of unsupervised pattern recognition which can be classified broadly into the data reduction module and the proposed unsupervised pattern classification module. In section 3, we deal with the demonstration of our developed application (using the proposed algorithm) on some example patterns and we present the results of our experimentation. Section 4 is the conclusive part of the proposed architecture.
2. UNSUPERVISED PATTERN RECOGNITION
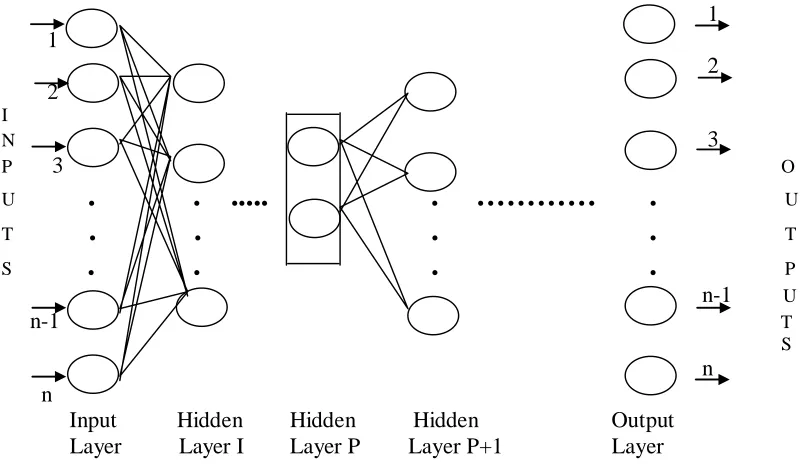
In this section we describe our method of dimensional reduction (module I of the proposed algorithm) for which we brief about the Mirroring Neural Network architecture (which is used to reduce the pattern dimension) and then, we explain the unsupervised classification i.e., module II of the proposed algorithm (nothing but, our proposed method called as Sample Vectors method).
A. Data Reduction Technique
The present section deals with the method of dimensional reduction of the input patterns. As the proposed architecture performs data reduction before proceeding to the pattern classification and the pattern classification is done on the extracted features (reduced units of the data), it is very important to extract the best features of the input pattern at the data reduction phase (module I of the algorithm). So, we implemented the input dimensional reduction using the Mirroring Neural Network architecture, the reasons being: (i) the MNN can extract the best features of the input pattern and could simultaneously perform optimal data reduction (ii) MNN learns the patterns in unsupervised mode (iii) MNN is compatible with any type of input data (iv) MNN can reduce the dimension of the input more effectively and efficiently (compared to widely used methods of data reduction). For more details on the MNN dimensional reduction technique and how it is trained to extract the best features, refer [21], [22] and [23]. The diagrammatic representation (Figure 1) of MNN follows.
1 1
2 2
I
N 3
P 3 O
U . . ...
.
………… .
U
T
. .
.
.
T
S
. .
.
.
Pn-1 U
n-1 T
S
n n
Input Hidden Hidden Hidden Output Layer Layer I Layer P Layer P+1 Layer
Figure 1. Illustration of Mirroring Neural Network Architecture
The above Figure 1 is explained as follows. The converging part of this example network starts with ‘n’ units at the input layer, ‘n1’ units (where n>n1) in the Hidden Layer I, ‘n2’ units (where n1 > n2) in the Hidden Layer II (which is not shown in the example figure 1, but it is next to Hidden Layer I) and so on till it reaches least dimensional hidden layer, i.e., Pth hidden layer with 2 units. This converging part condenses the high dimensional pattern into low dimensional code format.
Volume 2, Issue 1 ISSN - 2218-6638 International Journal for Advances in Computer Science March 2011
© IJACS 2010 - All rights reserved
7 example, consider a network which has 25 - 12 - 6 – 3 - 8
- 25 nodes in respective layers. This network has 25 inputs, 12 adalines in the 1st hidden layer, 6 adalines in the 2nd hidden layer, 3 adalines in the 3rd, 8 adalines in the 4th and 25 adalines in the last layer. The pattern is reconstructed at the output with its original dimension of 25 units from this signature. The input patterns with 25 dimensions can thus be represented with the 3 code units of the 3rd hidden layer (least dimensional layer). The degree of reduction of the input pattern plays an important role while reconstructing input pattern from reduced dimension vector and it varies depending on the application to which this network is applied, the number of units in the least dimensional hidden layer must be chosen after careful experimentation.
B. Unsupervised Pattern Classification
The second module of our algorithm deals with the unsupervised classification of the extracted features using the proposed Sample Vectors method. The reduced data from the feature extractor i.e., features of the patterns (from the least dimensional hidden layer of the MNN) are given as the “input data set” to the clustering algorithm. Before discussing with the Sample vectors method of clustering we would like to discuss one of the existing approaches to classification i.e., Forgy’s clustering technique (refer [24] and [22] for details). The summary of steps involved in clustering the extracted features by Forgy’s technique is given hereunder.
1) Forgy’s Algorithm
1. Select ‘n’ random initial seed points (n being the intended no. of classes the input data set must be divided into) from input data set.
2. For all the samples in the input dataset repeat step 2. a. Calculate distance between each sample of the input
data set and each of the seed points representing a cluster.
b. Place the input data sample into the group associated with the seed point which is closest to input data sample (least of the distances in step 2 a) 3. After clustering all the samples into one of the groups though step 2, calculate the resulting cluster centroids and consider these centroids as new seed points.
4. Repeat step 2, 3 as long as the data samples leave one cluster to join another in step 2 b.
The said above Forgy’s clustering divides all the samples of the “input data set” into one of the ‘n’ clusters. Now, we discuss the improvements made in the unsupervised classification, for which, we proceed to the discussion of how the classification is further enhanced through our proposed Sample Vectors method. The Sample Vectors technique is described hereunder, in the subsequent sub-section.
2) Sample Vectors
This section deals with the improvement done on clustering for classifying the data samples (extracted features of the patterns). The proposed method of classification (Sample Vectors method) can be used to perform an unsupervised pattern classification is detailed hereunder.
Sample Vectors algorithm:
i. Select ‘m’ random data samples (extracted features of the patterns) as the reference samples such that m must be greater than the size of the data sample (for example, ‘s’ is the extracted feature vector size of patterns then m>s).
ii. Calculate the Euclidian distance between each of the ‘m’ data samples with the other (m-1) reference data samples including the sample which is under the consideration for the distance measure. Represent this distance vector of each of the reference samples as ‘Sample Vectors’. And there are ‘m’ such Sample Vectors.
iii. Cluster the ‘m’ Sample Vectors into ‘n’ categories (where ‘n’ is the no. of categories into which the input pattern assemble is to be classified) using a suitable clustering algorithm (we have used Forgy’s clustering for this purpose).
iv. Calculate the centroids of the clusters formed in step 3.
v. Select each sample of the input data set (extracted features of the patterns) which is to be classified and calculate the Euclidian distance between the sample and each of the cluster centroids.
vi. Categorize the input data sample into one of the minimum distant (Euclidian distance) clusters. Repeat this step for all the samples (extracted features of the patterns) of the input.
This algorithm is implemented at the unsupervised classification phase to cluster the extracted features of the patterns.
Volume 2, Issue 1 ISSN - 2218-6638 International Journal for Advances in Computer Science March 2011
© IJACS 2010 - All rights reserved
8 3. DEMONSTRATION & RESULTS
In this section we deal with the proposed algorithm’s demonstration using example patterns. These patterns are hereunder described.
Case 1: In this case we consider a collection of images which belong to one of the two categories viz., ‘Face’ (See databases Feret [25]; Manchester [26]; Jaffe [27] in the reference), and ‘Table’. For the purposes of classification and recognition, we resized all images to a fixed size containing 25 X 25 pixels thus each image can be represented by a 625 dimension vector and each component representing the gray level of the corresponding pixel when listed “row-wise”. The grey level of each pixel ranges from 0 to 255.
Case 2: Voice patterns: Voice samples belong to 4 distinct words called ‘File’, ‘Open’, ‘Read’ and ‘Close’ are digitized at the rate 11025 samples/second. We can get the frequency components of these digitized samples by taking 512 point Fast Fourier Transform (FFT). From these frequency components, highest 20 amplitudes (normalized) and their corresponding 20 frequencies
(normalized) are taken and placed alternatively to represent the feature set (of dimension 40 i.e., 20 + 20) of the word samples. These feature sets of the word samples are considered as the input to pattern recognizer.
The inputs to the unsupervised pattern recognizer are the patterns described in Case 1 and Case 2.
For the Case 1, the MNN architecture that we have chosen is 625-37-20-625, wherein 625 is the input layer, 37 is the first hidden layer, 20 is the least dimensional hidden layer, 625 being the output layer dimensions. The reduced units of the patterns (the outputs of the MNN’s least dimensional hidden layer i.e., 20 units) are fed to Forgy’s clustering for classifying the patterns into one of the two (in this case n=2) groups (i.e., Face and Table). After clustering with the Forgy, we experimented the same with Sample Vectors method of clustering by selecting 22 random samples where this 22>20 which is the size of the extracted features from the patterns (nothing but, the inputs to the proposed classification algorithm).We proceed to cluster the extracted features once again with the Sample Vectors method for better performance.
Figure 2. Illustration of Mirroring Neural Network Architecture The procedure for clustering the voice samples of Case 2
is same as the Case 1, but the architecture used for MNN
Volume 2, Issue 1 ISSN - 2218-6638 International Journal for Advances in Computer Science March 2011
© IJACS 2010 - All rights reserved
9 groups (i.e., n=4) and the no. of random samples selected
is 8 which is greater than the reduced unit size (5) of the word samples.
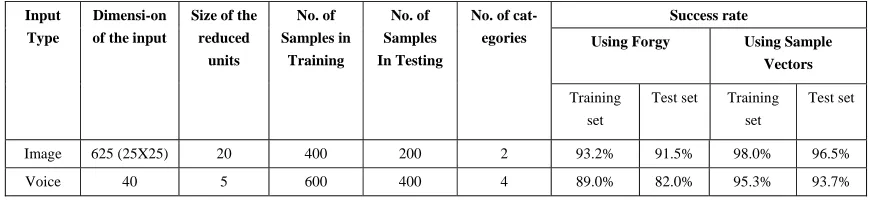
Table 1 gives the results of our proposed method of clustering on the said above two example cases. In this table, we present the results using MNN data reduction and Forgy’s clustering as well as MNN data reduction and Sample Vectors method of clustering.
Using Forgy’s clustering, 373 reduced units of the training set (containing 400 images) are classified in to their correct group. And there are 183 samples (reduced units of the test patterns) classified correctly out of 200 test samples (test samples are completely new images and are NOT contained in the training set). When these clusters formed by the Sample Vectors method, the accuracy of classification is improved and the success rate of the
clustering for the training set and test set are respectively 392/400 193/200.
A similar improvement is noted from the results of the classification for the voice samples. In this case, there are 66 misclassifications in the training set (containing 600 samples) and 72 misclassifications in the test set (which consists of 400 new samples) when these sets are classified with Forgy’s clustering technique. The accuracy of classification by the Sample Vectors method shows an increase in the accuracy of classification for both training and the test sets. And there are 28 misclassifications found in the training set and 25 misclassifications in the test set using the Sample Vectors clustering.
So, we can say that by introducing Sample Vectors method of clustering, there is an improvement in the clustering performance. Hence, this method of classification can be used for an unsupervised recognizer.
TABLE I. RESULTS OF THE PROPOSED ALGORITHM COMPARED WITH FORGY’S CLUSTERING
Success rate
Using Forgy Using Sample Vectors Input
Type
Dimensi-on of the input
Size of the reduced
units
No. of Samples in
Training
No. of Samples In Testing
No. of cat-egories
Training set
Test set Training set
Test set
Image 625 (25X25) 20 400 200 2 93.2% 91.5% 98.0% 96.5%
Voice 40 5 600 400 4 89.0% 82.0% 95.3% 93.7%
4. CONCLUSIONS
In this paper, we propose a new method of pattern recognition which performs automatic feature extraction, data reduction and unsupervised pattern classification. For this recognizer, we suggest that the data reduction has to be implemented through the MNN (an architecture that perfectly balances the best feature extraction and dimensional reduction) and the clustering is done by the proposed Sample Vectors method. In our previous papers we have shown MNN’s data reduction technique and its performance on various example cases.
In this paper, we introduced a new technique of unsupervised pattern classification which is implemented on the dimensionally reduced units of the patterns. Hence, in the proposed recognizer, there is a reduced burden on the classifier as the classifier operates on the low dimensional features of the patterns instead of high dimensional pattern detail. We have designed the architecture, developed algorithms and implemented it on example patterns. The new method, introduced is proven to be an improvement over the existing method of unsupervised classification with its efficacy in categorization of the patterns.
References
[1] Dasika Ratna Deepthi and K. Eswaran, “A Mirroring Theorem and its application to a New method of Unsupervised Hierarchical Pattern Classification”, published in IJCSIS (International Journal of Computer Science & Information Security), Vol. 6 No. 1, pp. 16-25, October 2009.
[2] Y. Freund and R.E. Schapire, “Experiments with a New Boosting Algorithm”, Proc. 13th International Conference on Machine Learning, Morgan Kaufmann, pp. 148-156, 1996.
[3] P. Viola and M. Jones, “Rapid Object Detection using a Boosted Cascade of Simple Features”, Proc. IEEE Computer Society Conference on Computer Vision and Pattern Recognition, pp. I-511-I-518, vol. 1, 2001. [4] T. Joachims, “Text Categorization with Support Vector
Machines: Learning with Many Relevant Features”, Proc. 10th European Conference on Machine Learning, Springer Verlag, pp. 137-142, 1998.
Volume 2, Issue 1 ISSN - 2218-6638 International Journal for Advances in Computer Science March 2011
© IJACS 2010 - All rights reserved
10 Practitioners”, IEEE Transactions on Pattern Analysis
and Machine Intelligence, 3(3): pp. 252-264, 1991. [7] B. Krishnapuram, A. Hartemink, L. Carin, and M.
Figueiredo, “A Bayesian Approach to Joint Feature Selection and Classifier Design”, IEEE Transactions on Pattern Analysis and Machine Intelligence, 26(9): pp.1105-1111, September 2004.
[8] C.J.C. Burges, “Geometric Methods for Feature Extraction and Dimensional Reduction”, In L. Rokach and O. Maimon, editors, Data Mining and Knowledge Discovery Handbook: A Complete Guide for Practitioners and Researchers, Kluwer Academic Publishers, 2005.
[9] J. Zhang, S.Z. Li and J. Wang, “Manifold Learning and Applications in Recognition”, In Intelligent Multimedia Processing with Soft Computing, Springer-Verlag, Heidelberg, 2004.
[10]David L. Donoho, Carrie Grimes, “Hessian Eigenmaps: Locally Linear Embedding Techniques for High-Dimensional Data”, Proc Natl Acad Sci USA 100(10): pp. 5591–5596, 2003.
[11]C. Garcia, M. Delakis, “Convolutional Face Finder: A Neural Architecture for Fast and Robust Face Detection”, IEEE Trans. Pattern Anal. Mach. Intell., 26(11), pp. 1408-1423, Nov. 2004.
[12]Son Lam Phung, Abdesselam Bouzerdoum, “A Pyramidal Neural Network for Visual Pattern Recognition”, IEEE Transactions on Neural Networks, 18(2), pp. 329-343, March 2007.
[13]M. Rosenblum, Y. Yacoob, L.S. Davis, “Human Expression Recognition from Motion using a Radial Basis Function Network Architecture”, IEEE Trans. Neural Networks, 7(5), pp. 1121–1138, Sep. 1996. [14]P. Baldi, K. Harnik, “Neural Networks and Principal
Component Analysis: Learning from Examples without Local Minima”, Neural Networks, 2, pp. 53-58, 1989. [15]D. DeMers, G. Cottrell, “Non-Linear Dimensionality
Reduction”, Advances in Neural Information Processing Systems 5, Morgan Kaufmann, 580-587, 1993.
[16]J. J. Hopfield, Carlos D. Brody “Learning Rules and Network Repair in Spike-Timing-Based Computation Networks”, Proceedings National Academic Science, USA 101(1): 337–342, 2004.
[17]Brian Lau, Garrett B. Stanley, Yang Dan, “Computational Subunits of Visual Cortical Neurons Revealed by Artificial Neural Networks”, Proc Natl Acad Sci USA 99(13): pp. 8974–8979, 2002.
[18]Hiu Chung Law, Clustering, Dimensionality Reduction and Side Information, Michigan State University, 2006. [19]G.E. Hinton & R.R. Salakhutdinov, “Reducing the
Dimensionality of Data with Neural Networks”, Science, 313, 504-507, July 2006.
[20]Alex L.P. Tay, Jacek M. Zurada, Lai-Ping Wong, and Jian Xu, “The Hierarchical Fast Learning Artificial Neural Network (HieFLANN)—An Autonomous Platform for Hierarchical Neural Network Construction”, IEEE Transactions On Neural Networks, 2007.
[21]Dasika Ratna Deepthi, Sujeet Kuchibholta and K. Eswaran, “Dimensionality Reduction and Reconstruction using Mirroring Neural Networks and Object Recognition Based on Reduced Dimension Characteristic Vector”, IEEE International Conference on Advances in Computer Vision and Information Technology (IEEE, ACVIT-07), 348-353, 2007.
[22]Dasika Ratna Deepthi, G. R. Aditya Krishna and K. Eswaran, “Automatic Pattern Classification by Unsupervised Learning using Dimensionality Reduction of Data with Mirroring Neural Networks”, IEEE International Conference on Advances in Computer Vision and Information Technology (IEEE, ACVIT-07), 354-360, 2007.
[23]Dasika Ratna Deepthi, “Automatic Pattern Recognition for the Applications of Image Processing and Robotics”, Ph. D. Thesis, submitted to Osmania University, Hyderabad, February 2009.
[24]Earl Gose, Richard Johnsonbaugh and Steve Jost, Pattern recognition and image analysis, New Delhi: Prentice Hall of India, 2000.
[25]“FERET database” available at www.frvt.org/FERET/
[26]“MANCHESTER database” available at
www.ecse.rpi.edu/cvrl/database/other-Face-databases.htm
Volume 2, Issue 1 ISSN - 2218-6638 International Journal for Advances in Computer Science March 2011
© IJACS 2010 - All rights reserved
11
Utilizing Analytical Hierarchy Process for Pauper House Programme in Malaysia
Mohd Sharif Mohamad, Abd. Samad Hasan Basari, Burairah Hussin Faculty of Information & Communication Technology
Universiti Teknikal Malaysia Melaka, Malaysia
{[email protected], (abdsamad, burairah)@utem.edu.my}
Abstract
In Malaysia, the selection and evaluation of candidates for Pauper House Programme (PHP) are done manually. In this paper, a technique based on Analytical Hierarchy Technique (AHP) is designed and developed in order to make an evaluation and selection of PHP application. The aim is to ensure the selection process is more precise, accurate and can avoid any biasness issue. This technique is studied and designed based on the Pauper assessment technique from one of district offices in Malaysia. A hierarchical indexes are designed based on the criteria that been used in the official form of PHP application. A number of 23 samples of data which had been endorsed by Exco of State in Malaysia are used to test this technique. Furthermore the comparison of those two methods are given in this paper. All the calculations of this technique are done in a software namely Expert Choice version 11.5. By comparing the manual and AHP shows that there are three (3) samples that are not qualified. The developed technique also satisfies in term of ease of accuracy and preciseness but need a further study due to some limitation as explained in the recommendation of this paper.
Index Terms: Analytical hierarchy process; Fuzzy set,
Pauper house programme.
1. Introduction
Government of Malaysia has allocated a special fund to help poor citizen by building a new houses or repairing their existing houses. This program is called Pauper House Programme (PHP) under the Economic Planning Unit under Prime Minister’s Department available at www.epu.gov.my. Currently, this program is conducted and supervised by Land and District Office, State Legislative Coordinator Committee (SLCC), and Rural Development and Defender Unit (RDDU), Chief Minister Department. The application will go through SLCC in each assembly area, Land District Office for each district and finally after investigation by the Headman the application will be sent to the RDDU to synchronize all the applications and prepare for a paper and bring into Exco meeting every week.
When the process is done manually without any proper system, the chance of getting inaccurate answer and decision with biasness is likely to be high. The criteria used to evaluate the qualified applicants are not clear and can be easily being manipulated. Besides, the officer may use his/her instinct or assumption to choose which applicant is qualified for the endorsement.
Hence a PHP selection technique is developed using Analytical Hierarchy Process (AHP) to improve the accuracy and precision in selecting those applicants who are really qualified based on several main criteria. It is a technique which was applied to evaluate the status of Pauper in China [1], [2].
2. Literature Review
The PHP Selection Technique was developed that is based on Analytical Hierarchy Process (AHP) and Fuzzy Logic.
A. Analytical Hierarchy Process (AHP)
Analytical Hierarchy Process (AHP) can help users in making better decisions and improve the decision making process. However there are weaknesses in capturing the vague, uncertainty and imprecise judgment by different users. A Fuzzy AHP is being explored to overcome the compensatory approach and the inability of the classic AHP in handling proper linguistic variables. Fuzzy Analytical Hierarchy Process (AHP) can evaluate the weightings of all indexes in the valuation system scientifically and objectively. AHP also can avoid determining the weightings and considers the faintness of mankind's judgment [3].
With AHP, the decision maker selects the alternative that best meets his or her decision criteria. Then the numerical score is developed to rank each decision alternative based on how well each alternative meets them [4].
Volume 2, Issue 1 ISSN - 2218-6638 International Journal for Advances in Computer Science March 2011
© IJACS 2010 - All rights reserved
12 i. Break down the complex problem into a number of
small constituent elements and then structure the elements in a hierarchical form.
ii. Make a series of pair wise comparisons among the elements according to a ratio scale.
iii. Use the eigenvalue method to estimate the relative weights of the elements.
iv. Aggregate these relative weights and synthesize them for the final measurement of given decision alternatives.
B. Fuzzy Set Theory
Fuzzy set theory is a mathematical theory aimed to model the vagueness or imprecision of human cognitive processes. The theory is pioneered by Zadeh [6]. The fuzzy sets represent the grade of any element, for example x that have the partial membership to A. The degree to which an element belongs to a set is defined by the value between 0 and 1. An element x really belongs to A if µA(x) = 1 and clearly not if µA(x) = 0. The higher is the membership value, µA(x), the greater is the belongingness of an element x to a set.
The Fuzzy AHP in this paper applied the triangular fuzzy number through symmetric triangular membership function. A triangular fuzzy number is the special class of fuzzy number whose membership defined by three real numbers, expressed as (l, m, u). The triangular fuzzy numbers is represented as in equation below [7].
The conventional AHP approach may not fully reflect a style of human thinking because the decision makers usually feel more confident to give interval judgments rather than expressing their judgments in the form of single numeric values. In contradiction, FAHP is capable of capturing a human's appraisal of ambiguity when complex multi-attribute decision making problems are considered by transforming crisp judgments into fuzzy judgments.
3. Analysis and Design
A. Program Perumahan Rakyat Termiskin (PHP)
According to Economic Planning Unit (EPU) of the Prime Minister’s Department, during the National Development Policy for the years of 1991 until 2000, the Development Programme for Pauper (DPP) was introduced to assist the Pauper. One of the housing projects or program that has
been tailored to meet the Pauper needs is the PHP which is being managed and monitored by every state in Malaysia.
B. Analysis on Current Evaluation Flow of PHP Applications and Evaluations
Currently, the PHP selection system flow is done manually whereby all the evaluations will be done by human, without any aid from a proper systematic technique. All the applications need to be investigated and evaluated to determine whether it is qualify enough to be consider and bring up for the endorsement of Exco. The evaluation which is done by Headman is only based on their own judgments which is might be questioned.
At first, the poor people will need to fill up a PHP application form in which they can get it from District Office or SLCC. Then they will need to get the verification or support from their respective head of village committee for development and security before they send it back to SLCC for recommendation from State Legislative Member (SLM).
Next, SLCC will submit the application form to the District Office. Here, Headman will go to their house (applicants) for investigation and evaluation. The investigation is just like an ordinary interview whereby Headman will ask some questions regarding the applicant’s background and the criteria of the evaluation are as follows:
• The income of the head of the family
• The number of family members: and
• The conditions of current house whereby, is there any necessity to repair the house or build a new one.
After Headman has all the information, they will make their evaluation based on their own judgment. At this stage, without any proper and systematic method of evaluation, it may come to worse that the most qualified applications will be rejected.
The next process is to appoint a contractor that will be in charged to handle the construction of the new house or repairing the current house. The appointment of the contractor is under SLCC’s responsibility with the help of Villager’s Small Committee (VSC) itself. The summary of the flow for PHP selection is as in figure 1.
C. The Design of Selecting PHP Technique using Analytical Hierarchy Process (AHP)
Volume 2, Issue 1 ISSN - 2218-6638 International Journal for Advances in Computer Science March 2011
© IJACS 2010 - All rights reserved
13 decision analysis method combining qualitative and
quantitative analysis. There are four (4) main steps of analytic hierarchy process:
Problem Modelling.
As with all decision-making processes, the problem is structured and divided into three parts: goal (select qualified application), criteria (applicant’s and spouse’s age, their income, family burdens and income per capita for the family) and alternatives (all those samples data of real PHP applications). After the target of decision is determined and the factors which have effect on the decision classified then the hierarchical structure is set up. Since AHP permitting a hierarchical structure of the criteria, it provides users with a better focus on specific criteria and sub-criteria when allocating the weights.
3) Pair wise Comparison.
At each node of the hierarchy, a matrix will collect the pair wise comparisons of the design. Here the weight of each criterion is given based on important of each of it over the other. It also allows consistency and cross checking between the different pair wise comparisons [8]. AHP requires no units in the comparison because it uses a ratio scale, rather than interval scales [9].Hence the decision maker does not need to provide a numerical judgement as a relative verbal appreciation that is more familiar in our daily lives is sufficient.
As priorities make sense only if derived from consistent or near consistent matrices, a consistency check must be applied [8]. Saaty [10] has proposed a consistency index (CI), which is related to the eigen value method, as in
The consistency ratio, the ratio of CI and RI, is given by:
CR = CI/RI (3)
where RI is the random index (the average CI of 500 randomly filled matrices).
If CR is less than 10%, then the matrix can be considered as having an acceptable consistency. The calculated of random indices is shown in table 1.
TABLE I. RANDOM INDICES [9]
Figure 3. The Flow of Current PHP Application Process Consistency Checking
4) Calculate the eigenvectors, the weight of criteria,
and make the decision
Under correct consistency, the eigenvectors corresponding to the eigenvectors of the pair wise comparison matrixes will be calculated, and each factor’s weight toward the specified factor in the level above determined. Decision will be made after calculate the general ranking weight of each factor to the main target.
Theories and methods of fuzzy mathematics and comprehensive evaluation are very useful for many problems in Pauper grading. There are several process in (2)
endorsed
End
Submit application to District Office
Investigation by Headman
Endorsement of status: Qualify/ not qualify
Submit endorsement to UPD
Exco endorsement Prepare for Exco papers
Submit form to SLCC
Get SLM recommendation Applicants filling the PHP form
Applicants get recommendation from VSC chairman
Volume 2, Issue 1 ISSN - 2218-6638 International Journal for Advances in Computer Science March 2011
© IJACS 2010 - All rights reserved
14 determining qualification of PHP applications based on
Pauper Grade Principle of Multi-Factor Fuzzy Comprehensive Evaluation. The detailed process is listed below:
i. Setting up the set of evaluation indexes (Factor Set
U).Evaluation factor U is the set of evaluation
indexes. It is hierarchical,
U={U1,U2,…,Ui } (4)
i= (1,2,…,n) Ui = {Ui1, Ui2,…,Uij}
j= (1,2,… ,m)
where Ui represents the i-th rule hierarchy in the evaluation index system, and Uij represents the j-th index in the i-th rule hierarchy.
ii. Setting up the set of evaluation (Judgment set V). Evaluation set V is the set of the overall assessment on the target from the evaluators.
V={v1,v2,…,vh}
(5)
h={1,2,3,…},
where vh represents the h-th evaluation hierarchy.
iii. Setting up the set of weight distribution (A). The distribution set of Ui toward U is
A={A1,A2,…,Aj};
(6)
the weight of Uij to Ui is aij, and the weight distribution set of indexes in the sub hierarchy is
Ai={ai1,ai2,…,aij} (7)
The value of ai and aij can be determined using Analytic Hierarchical Process (AHP); the weights of each index hierarchy to its upper hierarchy are the components of eigenvectors corresponding to judgement matrixes that satisfy consistency check.
5) Setting up the judgment membership matrix (R)
Here the i-th row of R represents the evaluation result for the i-th factor, and represents the membership of the i-th evaluation factor to the j-th hierarchy, which displays the
fuzzy relationship between each factor and hierarchy, indicated by membership degree. m is the number of rule hierarchies, n is the number of evaluation levels, and n is the number of indexes that the f-th rule hierarchy contains.
6) Multilevel comprehensive fuzzy evaluation Level 1
fuzzy comprehensive evaluation
Level 2 fuzzy comprehensive evaluation: evaluation membership matrix
Single-value processing on the result of evaluation will be performed. First, according to the comprehensive evaluation result B, the evaluation grade decided by maximum membership principle, for example; if max(bj)=bk then the evaluation grade is bk [11]. Secondly the numeric values on each factor in the evaluation comment will be defined. The final evaluation result is S=B’VT. All the evaluated targets by S will be sorted to compare their Pauper grades then.
4. Implementation of AHP Technique
A. Developing the Hierarchy of Indexes
In order to suit the information that has been filled up in the form with the use of Analytical Hierarchy Process (AHP), one hierarchical indexes of PHP qualification had been developed based on the information of the applicant him/herself and his/her spouse. The illustration of the hierarchy of indexes is shown in figure 2.
(10) (9)
Volume 2, Issue 1 ISSN - 2218-6638 International Journal for Advances in Computer Science March 2011
© IJACS 2010 - All rights reserved
15 Figure 4. Hierarchy of Indexes of PHP Qualification
B. Determining the Weight of the Indexes
Using Analytical Hierarchy Process (AHP), the weight of the situations of the evaluated target is determined, by using both information of the applicant and the spouse.
The indexes of the information of the applicant are the age, income, and number of dependent, are marked as:
A = applicant’s age B = applicant’s income C = number of family burdens Each index’s weight is assumed as in table 2:
TABLE II. WEIGHT OF EACH INDEX INSIDE THE “APPLICANT” CONCLUSIVE INDEX
A B C WEIGHT
A 1 3 5 0.637
B 1/3 1 3 0.258
C 1/5 1/3 1 0.105
TOTAL 1.533 4.333 9 The calculation of the table is as follows:
⎥ ⎥ ⎥ ⎦ ⎤ ⎢ ⎢ ⎢ ⎣ ⎡ = = ⎟ ⎟ ⎠ ⎞ ⎜ ⎜ ⎝ ⎛ + + = = ⎟ ⎟ ⎠ ⎞ ⎜ ⎜ ⎝ ⎛ + + = = ⎟ ⎠ ⎞ ⎜ ⎝ ⎛ + + = 105 . 0 258 . 0 637 . 0 , 105 . 0 9 1 333 . 4 3 1 533 . 1 5 1 3 1 258 . 0 9 3 333 . 4 1 533 . 1 3 1 3 1 637 . 0 9 5 333 . 4 3 533 . 1 1 3 1 3 2 1 w Therefore w w w
The consistency rate of these Y indexes is
( ) ( ) ( ) ( ) ( ) ( ) ( ) ( ) ( ) 318 . 0 785 . 0 936 . 1 105 . 0 1 258 . 0 3 1 637 . 0 5 1 105 . 0 3 258 . 0 1 637 . 0 3 1 105 . 0 5 258 . 0 3 637 . 0 1 105 . 0 258 . 0 637 . 0 1 3 1 5 1 3 1 3 1 5 3 1 1 1 1 = • + + + + + + = • • = • W A W A W A
The largest Eigen value is:
Volume 2, Issue 1 ISSN - 2218-6638 International Journal for Advances in Computer Science March 2011
© IJACS 2010 - All rights reserved
16 The consistency index is:
184 . 0 . 1 3 3 368 . 3 1 . max1
= − − = − − = I C n n I C λ
According to the Random Number Table, average random consistency index is
R.I = 3.0 (n=3)
Therefore, the consistency rate is
1 . 0 061233 . 0 3 184 . 0 . .
. = = = <
I R I C R C
The consistency of matrix A is acceptable since its consistency rate is less than 0.1. Now, it has been determined that the weights of the four indexes belong to the applicants are 0.637, 0.258, and 0.105. For the indexes belong to the spouse of the applicant, it goes the same process as applicants.
C. Carrying out the Fuzzy Hierarchical Comprehensive Evaluation
7) In determining the value of indexes and weight distribution, the factor set need to be determined first.
U = {U1 Applicant, U2 Spouse}
U1 = {age, income, health, number of dependent}
U2 = {age, income, health, income per capita} After determining the factor set, AHP method is used to obtain the weight vectors of the indexes. The calculation results can be as follows:
A = {0.833, 0.167}
A1 = {0.558, 0.263, 0.122, 0.057} A2 = {0.558, 0.263, 0.122, 0.057}
8) Later, the Comment Set of Qualification for the Application will be set up using following rule.
V = {“extremely qualified”, “heavily qualified”, “qualified”,
“not qualified”}
In this particular paper, the range between 100 to 90 points will be determined as “extremely qualified”, 89 to 75 points as “heavily qualified”, 74 to 60 points as “qualified” and 59 to 0 points as “not qualified”. Since the grading of comment set is quantified to a span of 1 point, the comment grade vector would be H = {1.0, 0.8, 0.5, 0.3}
All the weights of the indexes are given based on the real scenario. The distribution of weights of the indexes would be as in table 3.
TABLE III. DISTRIBUTION OF WEIGHTS OF THE INDEXES FOR APPLICANT AND SPOUSE
Weight
Criteria 0.3 0.5 0.8 1.0 No. of Family
Burdens
Less than 3
4 - 6 6 - 8 More
than 8
Age 25 – 35 36 - 50 51 - 65 65 and
above
Income RM 1, 500 and above RM 1000 – RM 1499 RM 450 – RM 999 RM 440 and below Income per Capita RM 250 and above RM 150 – RM 250 RM 100 – RM 150 Less than RM 100
9) Finally, Fuzzy Evaluation Matrix was setup by evaluating matrix Ri that can be established by various methods according to different characters of the indexes.
The grade is given based on the information filled in the application form by each sample. For example; if the sample earns an income of RM 450, he will be given a grade of “Heavily Qualified” with the weight of 0.8. And if his whole income per capita is less than RM 100, he will be given a grade of “Extremely Qualify” with weight of 1.0.
D. Samples Data
A sample of 23 data for PHP applications which had been approved and endorsed by the State Executive Council (SEC) have been gathered with the permission of the RDDU, Department of Chief Minister. These samples will be used determine whether these endorsed PHP application were really qualified or not using the AHP technique calculation. grading grading grading grading grading grading grading grading grading grading grading grading Ri = S p
Volume 2, Issue 1 ISSN - 2218-6638 International Journal for Advances in Computer Science March 2011
© IJACS 2010 - All rights reserved
17
5. Result and Analysis
B. Result of the Implementation
The distribution of weight for all the samples using Expert Choice version 11.5 that implement Analytical Hierarchy Process [12],[13] were shown in table 4.
TABLE IV. THE WEIGHT DISTRIBUTION FOR ALL THE SAMPLES
APPLICANT’s WEIGHT SPOUSE’s WEIGHT Ag e Inc o m e (RM ) No. of F a m ily Burden s Ag e Inc o m e (RM ) In co me p er ca p it a (RM) STAT US Sample 1
0.8 1.0 0.3 0.5 1.0 0.5 Accepted Sample
2
0.3 0.8 0.8 0.3 1.0 0.8 Rejected Sample
3
0.5 1.0 0.3 1.0 1.0 0.8 Accepted Sample
4
0.5 0.8 0.3 1.0 1.0 0.3 Accepted Sample
5
0.8 1.0 0.3 0.5 1.0 0.5 Accepted Sample
6
1.0 1.0 0.3 1.0 1.0 1.0 Accepted Sample
7
1.0 1.0 1.0 1.0 1.0 1.0 Accepted Sample
8
0.8 0.3 0.3 0.8 1.0 0.3 Accepted Sample
9
0.5 1.0 0.8 0.8 1.0 1.0 Accepted Sample
10
1.0 1.0 0.3 1.0 1.0 0.3 Accepted Sample
11
0.8 0.8 0.8 0.5 1.0 1.0 Accepted Sample
12
1.0 1.0 0.3 1.0 1.0 0.5 Accepted Sample
13
0.5 0.8 0.5 0.3 1.0 1.0 Rejected Sample
14
0.5 1.0 0.5 1.0 1.0 1.0 Accepted Sample
15
0.5 0.8 0.5 0.5 1.0 0.5 Rejected Sample
16
1.0 1.0 0.5 1.0 1.0 1.0 Accepted Sample
17
1.0 1.0 0.3 1.0 1.0 0.3 Accepted Sample
18
1.0 1.0 0.3 0.8 0.5 1.0 Accepted Sample
19
0.5 1.0 0.5 0.5 0.5 0.5 Accepted Sample
20
1.0 1.0 0.3 1.0 1.0 0.8 Accepted Sample
21
1.0 1.0 0.3 1.0 1.0 1.0 Accepted Sample
22
1.0 0.8 0.5 1.0 1.0 0.8 Accepted Sample
23
1.0 1.0 1.0 1.0 1.0 0.3 Accepted
All the ratings are given based on the true data that have been collected from the application forms. For example of Sample 1, the particulars of the applicant is as follows
Applicant = {Age, Income, Number of family burderns} = { 54, 400, 3}
= {Heavily qualify, Extremely qualify, Not Qualify}
Spouse = {Age, Income, Income per capita} = {46, 300, 175}
= {Qualify, Extremely qualify, Qualify}
This then return the result of 0.771 which fall under category of Heavily Qualify. The other samples were also being implemented in the same way.
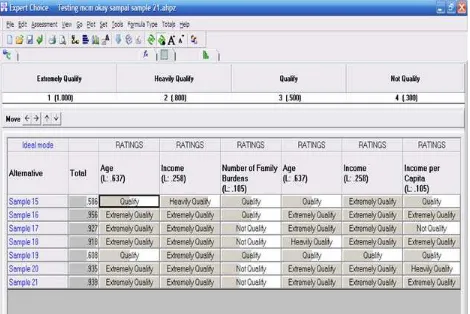
A screenshot generated by Expert Choice that show some of the result for qualification of the PHP application samples is illustrate in figure 3. Because of the software is a trial version, it just allowed only eight (8) alternatives to be keyed-in for each session.
Figure 5. Expert Choice: Result for Sample 15 until Sample 21
C. Analysis of the Result
Volume 2, Issue 1 ISSN - 2218-6638 International Journal for Advances in Computer Science March 2011
© IJACS 2010 - All rights reserved
18 TABLE V. COMPARISON BY USING AHPTECHNIQUE
EQ Extremely Qualify 100 to 90 points
HV Heavily Qualify 89 to 75 points
Q Qualify 74 to 60 points
NQ Not Qualify 59 to 0 points
Qualification by using AHP Initial Status of
Application Weight Status Range
Sample 1 / 0.771 / HQ
Sample 2 / 0.596 x NQ
Sample 3 / 0.627 / Q
Sample 4 / 0.618 / Q
Sample 5 / 0.771 / HQ
Sample 6 / 0.939 / EQ
Sample 7 / 1.0 / EQ
Sample 8 / 0.666 / Q
Sample 9 / 0.696 / Q
Sample 10
/ 0.927 / EQ
Sample 11
/ 0.780 / HQ
Sample 12
/ 0.930 / EQ
Sample 13
/ 0.531 x NQ
Sample 14
/ 0.691 / Q
Sample 15
/ 0.586 x NQ
Sample 16
/ 0.956 / EQ
Sample 17
/ 0.927 / EQ
Sample 18
/ 0.918 / EQ
Sample 19
/ 0.608 / Q
Sample 20
/ 0.935 / EQ
Sample 21
/ 0.939 / EQ
Sample 22
/ 0.910 / EQ
Sample 23
/ 0.988 / EQ
According to table 5, an analysis can be done by sorting it into different categories of qualification by referring to qualification range. The summary of the qualification weight is as in figure 4.
Figure 6. Graphical Representation of Qualification Based on AHP Technique
There are 11 of the samples data are on the category of “Extremely Qualify”, 3 on “Heavily Qualify”, 6 on “Qualify” and 3 are not “Qualify”. This is different with the evaluation that is done manually without the proper technique, where all the 23 samples of applications are suggested to be qualified and endorsed by the Exco. This is because there are no specific rules and guidelines that can be used for the Headman in evaluation process.
6. Conclusion
By using AHP technique, it seems that the gap between each application can be monitored and take into consideration when evaluating and selecting all the applications. The results were accurate since they were executed without any external factor and without any misjudgment. This technique is essential and can be implemented to the current method of selecting the PHP applications after several more improvement in the next further study. To improve the accuracy and precision of PHP selection technique, it is recommended in the next PHP application and evaluation process can comprise of:-
i. The official form that been designed and created by the RDDU should consist of more information about the applicants. These include applicant’s health status, ability (i.e. disabled person), received aids or funds and how long the applicant and his/her family have stayed or born in that particular state.
ii. A particular software or system based on this technique need to be developed. Obviously it can be used easily, user friendly and able to be applied in various entities that related to the PHP selection. iii. Adding prioritizing ability since AHP technique
also capable to prioritize the application based on their score in case of limited allocation of budget to be funded to the PHP program.
iv. Further study can be done in designing a technique to determine the weight of other criteria.
/ Accepted
Volume 2, Issue 1 ISSN - 2218-6638 International Journal for Advances in Computer Science March 2011
© IJACS 2010 - All rights reserved
19 v. The technique to be developed need to consider the
applicant’s current house condition and the status of land.
Acknowledgment
The authors would like to thank Faculty of Information and Communication Technology, UTeM for providing facilities and financial support.
References
[1] H. Enzhao and L. Yang (2008). Pauper Grade Evaluation Model Based on Multilevel Fuzzy System. International Conference on Information Management, Innovation Management and Industrial Engineering, pp. 317 - 320.
[2] R. D. Meyer and L.G. Wallace (2009). Pauper levels and trends in comparative perspective. Focus Vol. 26, No. 2, Fall 2009 , pp. 7 - 13.
[3] C. K. Kwong and H. Bai (2002). A fuzzy AHP approach to the determination of importance weights of customer requirements in quality function deployment, Journal of Intelligent Manufacturing Volume 13(5), pp. 367-377.
[4] T. L. Saaty, (1980), The Analytical Hierarchy Process, Mc Graw Hill, New York.
[5] C.H. Cheng, K.L. Yang and C.L. Hwang (1999).
Evaluating Attack Helicopters by AHP Based on Linguistic Variable Weight. European Journal of Operational Research, 116, 423-435.
[6] L.A. Zadeh, Fuzzy Sets, Information and Control, vol. 8, pp. 338-353. 1965.
[7] T.H. Moon and W.B. Lee (1999). Construction of
Supporting System for Decision Making Process ff Zoning Designation and Change that has Fuzziness, The 6th International Conference Computers in Urban Planning and Urban Management, Venice, Italy.
[8] J.R. Heinrich (2002). Decision making in Fuzzy
Environment. First Internation IEEE Symposium Intelligent System, pp. 19 - 22.
[9] T. Kainulainen, P. Leskinen, P. Korhonen, A. Haara and T. Hujala (2009). A statistical approach to assessing interval scale preferences in discrete choice problems. Journal of the Operational Research Society 60(2), pp. 252-258.
[10]T. Saaty (1977). A scaling method for priorities in
hierarchical structures. Journal of mathematical psychology 15(3), pp. 234-281.
[11]G. Hongjun, S. Yungfeng and L. Wei (2009). Fuzzy
Comprehensive Evaluation Model on University Teaching Quality . International Conference on Business Intelligence and Financial Engineering, pp. 190 - 193.
[12]A. Ishizaka and A. Labib (2009). Analytic Hierarchy
Process and Expert Choice: Benefits and Limitations. pp. 201 - 220.
[13]O. Alanbay (2005). ERP Selection Using Expert Choice Software . ISAHP 2005. Honolulu, Hawaii.
Volume 2, Issue 1 ISSN - 2218-6638 International Journal for Advances in Computer Science March 2011
© IJACS 2010 - All rights reserved
20
A More Secure Authentication through A Simple Virtual Environment
T.Sujanavan, Dasika Ratna Deepthi
Sreenidhi Institute of Science & Technology, Yamnampet, Ghatkesar, Hyderabad, India {(radeep07, tsujanavan)@gmail.com}
Abstract
We propose an authentication system with a simple virtual environment which could address some of the open authentication issues of the industries. In this system, user interacts with the virtual environment and sequence of interactions are gathered by a background process (the proposed authentication system) which decides whether the user is authenticated user or a hacker, depending on which the system allows or denies to access the resources. Many existing authentication schemes are based on a single factor mechanism and due to their backdrops, found to be unsuccessful. Examples of such systems are authentication systems with Textual passwords, Biometrics, graphical passwords etc., Even though, research is around such failures of the systems and notorious attacks on the systems still the breakdowns continue. And hence, we propose an authentication system with a simple virtual environment which is more secure and simple to use to solve some authentication issues. Index Terms - Authentication system, virtual environment, Textual passwords, Biometrics, graphical passwords
1. Introduction
Compared to the past decades, at present there is a rapid increase in the use of internet and the computer systems through which large amount data is handled, demanding the need of secure authentication systems. There are different variants of users starting with the simple household users to the large business/industry customers. Everyone has some sought of information to be securely stored which are not to be stolen, edited or viewed by somebody else. The information stored online could range from a small text file to that of a huge footage video. Though here we are not concerned with the file size, the organizations that are providing online storage to users do have threats from all sought of notorious criminals [1]. The main entrance to the access is the authentication system.
Many people have brought revolution over the Internet for its security [2] [3] still, the number of criminal minds has also been increased [4]. Earlier, we used to use a textual secret e.g. password, later people thought of that the password could be estimated. Hence, they came up with the idea of smart cards e.g. RF-ID, even though these cards could be stolen [5]. Most of the users were not satisfied with such systems because they involved a
process of recall where users have to reproduce a secret every time when they need to access their data, which gave raise to the inventory of the recognition methods instead of the recall i.e. graphical passwords (some types) & biometrics [6] [7] [8].
Humans do posses a lack of memory hence to produce a textual password after a long time of non-utilization of an account could lead to misery. But in recognition mechanism (used in the graphical password scenario) the system shows the users a set of graphical passwords out of which the user previously elected one provides a login. Thus, in this scenario we overcome the fact of memory loss.
The graphical password also did include some kind of recall, which the biometrics had overcome. Biometrics did prove to be a more secure method of access but at the same time gave trouble in identifying the attributes of the legitimate user. E.g. In fingerprint recognition if the user’s finger had a cut or involved a foreign material as an obstruction then, the biometrics system would not recognize the user. Though the biometrics was already available with the user physical aspects it did also possess disadvantages based on several factors such as consistency, uniqueness, and acceptability.
Hence, in such a situation simply constructing a system blindly based on a single factor could involve vulnerability. In this paper we involve a mechanism of utilizing all the mechanisms above with a virtual environment. However, many researchers have tried to bring such mechanism [6] [7] [8] [9] we construct an optimal mechanism of utilizing different schemes with reduced overhead to the network and user friendly interactions.
The proposed system depicts a virtual environment with some items placed randomly in it. The user’s password consists of a sequence of interactions with the items in the environment [10]. These actions performed indirectly describe the user’s physical and mental behaviors to the authentication system, that then decides whether the user is genuine or not. The authentication system consists of a background process that utilizes an algorithm proposed in this paper to identify the legitimate user.
Volume 2, Issue 1 ISSN - 2218-6638 International Journal for Advances in Computer Science March 2011
© IJACS 2010 - All rights reserved
21 The remainder of this paper is organized as follows:
Section 2 discusses related inventions and innovations. Section 3 introduces the proposed scheme in which we also discuss the guidelines of building the virtual environment and its possible applications. Section 4 discusses the security analysis including possible attacks and countermeasures. Section 5 presents the experimental conditions. Finally, in Section 6, we conclude and discuss the future work.
2. Related inventions and innovations
Graphical passwords which were introduced by Blonder, brought a new revolution in authentication systems [11] [12] [13]. It consists of both recall and recognition methodologies e.g. Pass-faces, pass-point, DAS etc., Though the graphical passwords could produce a longer password size it suffered from the shoulder surfing attack. The pass-faces is a recognition type of method which consists of selecting an image by a user from a set of images projected on the screen. For this authentication system to work, initially the users need to specify a set of graphical images of his choice to the authentication system through a secure channel.
The pass-point method is a recall method where the user needs to select different points on a picture that resembles his password [14]. The DAS (Draw a sketch) method also falls in this category where the user needs to draw his login sketch on a grid (5x5, 10x10 or 25x25). The login involves in identifying the lines that pass through the different grids present on the screen.
Biometrics authentication system even though became popular with a short start still people are afraid of using it as it involves in recording the user’s physical aspects posing a threat to his privacy. In addition, some users resist the idea of a low intensity infrared light or any other kind of light directed at their eyes, such as in retina recognition systems. Moreover, biometrics cannot be revoked, which leads to a dilemma in case the user’s data have been forged. Unlike other authentication schemes where the user can alter his password at times of threat to privacy [15] [16], a user’s biometrics cannot be revoked. Many authentication systems are based on tangible objects and are referred to as based systems. Many token-based systems are vulnerable to theft and loss [1] [5]; therefore, most token-based systems require a personal identification number followed by a textual password for authentication e.g. a debit or a credit card.
Our schema involves the efficient utilization of all the mechanisms above discussed and it is small in size and an optimal solution.
3. The proposed scheme
This scheme is proposed keeping in mind the requirement to overcome the disadvantages of all the previous schemes and is outlined as follows:
i. The system should be in smaller size. As the utilization of the users on the Internet is higher, the requirement of the scheme also increases. ii. The newly proposed scheme should be easy to
use.
iii. It should produce a higher password size compared to the previous schemes.
iv. Password provided by the scheme should be easy to remember.
v. It should consist of passwords that are not easy to be written down.
vi. Users should have the freedom of selecting their passwords [14].
vii. The newly proposed system should provide a method for changing passwords.
Hence, keeping in mind all the above requirements the proposed system was designed.
A. The proposed system
The system consists of merging different authentication schemes together. The system presents a simple virtual environment containing various items. The user goes through this environment and changes the state of the items [10]. The system simply combines the sequence of user interactions that occur in the virtual environment which is depicted in Figure 1.
The system can combine recognition-, recall-, token-, and biometrics-based systems into one authentication scheme. This can be done by designing a virtual environment that contains items that request information to be recalled, information to be recognized, tokens to be presented, and biometrical data to be verified.
For example, the user can change the state of a window or a door in the virtual environment by simply clicking over it, later switch on a light bulb and finally click on login. The combination and the sequence of the previous actions construct the user’s password (action sequence recorded by a background invisible process as in Figure 1). Items can be any object that we encounter in real life. Any obvious state changes and interactions toward the real-life objects can be done in the virtual environment toward the items which, may include:
i. Opening/closing windows or doors.
ii. Typing a textual password on a virtual keyboard. iii. Switching on/off the lights.
iv. Performing biometrics by selecting a virtual item in the environment.
v. Identifying a graphical password.
vi. Providing a token for identification e.g. RF-ID on selecting an item.
vii. Writing on a paper present in the virtual environment.
Volume 2, Issue 1 ISSN - 2218-6638 International Journal for Advances in Computer Science March 2011
© IJACS 2010 - All rights reserved
22 ix. Any other authentication scheme which is to be
developed in the future.
The state change performed on an item differs from that of a different item hence, preserving the unique changes made at an item for later recognition process of the authentication system. Therefore, to generate the legitimate password, the user must follow the same scenario performed by him initially. This means changing state of the same items and performing the exact actions in a proper sequence.
B. Password selection and inputs
Many items in the virtual environment though are present additionally (passive components) could mean nothing to the user. For example, user clicks on the roof and clicks on the floor. But, such kind of inputs that do not generate
any action could be utilized for confusing the fake cameras or tracker objects installed.
The virtual environment consists of many kinds of actions and the range of the states for a single object could range from small to big. For example, user’s password could consist of a simple activation of a light bulb or as complex as solving a riddle.
The above procedure is easy to perform and changeable. It looks simple but it also involves complex calculations to convert the selections and inputs to match the user’s behavior by the authentication system. Though user has the freedom of selecting the items to be projected, the item properties or attributes are never revealed by the system to the user therefore, we can say that protecting the privacy of the authentication system is the methodology, here involved.
Figure 1. Representation of the flow of the authentication system : (a) the user is presented with the virtual environment (b) user changes the states of different items presented in the environment by simply clicking over it (c) a background process records all the state changes performed by the user along with their sequence of occurrences (d) the system still waits for any further actions to be performed by the user (e) attributes are handed over by
the background process to the identification process to solve the authentication criteria.
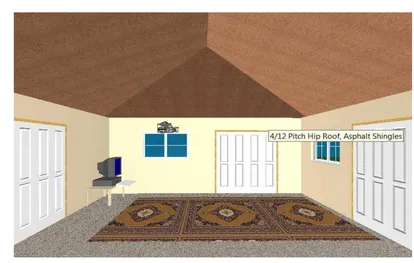
C. Designing the Virtual Environment
As we mentioned previously that a virtual environment (as in Figure 2) could contain anything still the developer to that environment, should keep in mind the following factors:
i. Size of the environment – to decrease the overhead, the size of the environment should be lower in size. If the designer needs to use a large environment then he should use compression
algorithms to reduce the size of the images or else it tends to overload the network bandwidth. ii. Number of items – the developer should not
project a large number of items to be displayed, which could confuse the user. Limiting the number of items helps the user to understand the items.
Volume 2, Issue 1 ISSN - 2218-6638 International Journal for Advances in Computer Science March 2011
© IJACS 2010 - All rights reserved
23 there should not be two different items that solve
the same purpose.
iv. Importance of the environment – the environment is constructed to deploy the authentication system and this should be kept in
mind of the developer and should not develop an inappropriate environment. For example, involving alien objects, distracting objects etc.,
Figure 2. A sample virtual environment consisting of a random positioning of items
D. Applications of the system
As the system we propose is of small size & having the higher safety it could be implemented every where, detailed below.
i. Over the Internet – at the login page for emails, social networking sites & blogging.
ii. Cash dispense machines – at ATMs and credit card machines.
iii. E-business web-sites – as the revolutionary growth of e-commerce requires safety authentication at rapid speeds.
iv. Personal devices – protecting personal data on desktop PCs, Laptops & smart-phones
v. Home security – at door locks and garage shutters.
vi. Research facilities – protecting secret data e.g. information at robotics, nuclear & defense laboratories.
vii. Industries & corporate business – avoiding theft of objects or data e.g. blue-prints, data on web-servers etc.
4. Security Analysis
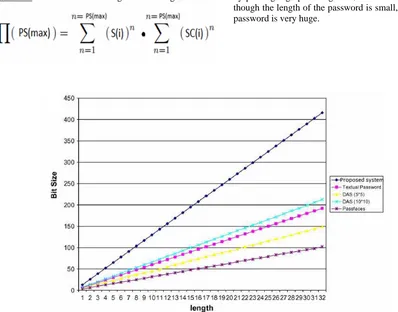
In order to analyze how tough is a security algorithm, the best way is to crack it, open without knowing the password. Even though the proposed system looks simple, it is very hard to knock it down as it results in equally cracking down all the security programs possessed by the system. Still the hacker needs a huge amount of knowledge and data to gain, that is impossible, as the state and attributes of the items are kept hidden even to the legitimate user and sequence is hidden from the administrator/working staff at the security company. There are also some organizations that provide a validation process for the authentication systems [17]. Still referring back to the standard principles of estimating the crack time by just looking at the password size even then, as the size of the password generated is huge compared to other algorithms it makes it impossible to be cracked. The password size of the proposed system could be explained as follows- Consider,
Volume 2, Issue 1 ISSN - 2218-6638 International Journal for Advances in Computer Science March 2011
© IJACS 2010 - All rights reserved
24 Then, the total number of passwords that could be
generated can be calculated using the following formula:
When, the above is compared to the rest of the algorithms by plotting a graph in Figure 3, it could be observed that though the length of the password is small, the size of the password is very huge.
Volume 2, Issue 1 ISSN - 2218-6638 International Journal for Advances in Computer Science March 2011
© IJACS 2010 - All rights reserved
25
Experimental Conditions
In our experiment to have a decrease of code size we have used JSP (Java Server Pages) which is also available on every system nowadays as a third party application hence, helps in an easy deployment. We did not use any kind of graphic card or acceleration devices in designing the virtual environment. The training for building the virtual environment was taken from virtual home construction software [18].
The Apache Tomcat software processes the server requests from the client and as the software is also available as a mobile version [19] hence, an immediate backup could be available at the time of breakdown. Basically the environment was setup only based on the graphical & textual passwords. Biometrics or any other new authentication system could also be attached as a module, easily, by introducing a new interaction item in the virtual environment.
5. Conclusion & Future work
Until now many authentication schemes only utiliz
![TABLE I. RANDOM INDICES [9]](https://thumb-ap.123doks.com/thumbv2/123dok/585463.69671/13.612.328.546.110.549/table-i-random-indices.webp)