PROJECT COMPLETION REPORT FOR
SHORT TERM GRANT
Principal Researcher: DR YUSMADY BIN MOHAMED ARIFIN
Co-Researcher : 1. SAFARUDIN GHAZALI HERAWAN
2. MOHAMAD FIRDAUS BIN SUKRI
Project Code No : PJP/2011/FKM(5A)/S00859
Report Submission Date : July, 2013
Department of Thermal-Fluids
FACULTY OF MECHANICAL ENGINEERING UNIVERSITY TEKNIKAL MALAYSIA MELAKA
PJP/2011/FKM(5A)/S00859
A STUDY ON IMPROVING AIR CIRCULATION IN A CONFINED SPACE
PJP/2011/FKM(5A)/S00859
A STUDY ON IMPROVING AIR CIRCULATION IN A CONFINED SPACE
DR YUSMADY BIN MOHAMED ARIFIN
SAFARUDIN GHAZALI HERAWAN
MOHAMAD FIRDAUS BIN SUKRI
RESEARCH VOTE NO:
PJP/2011/FKM(5A)/S00859
FAKULTI KEJURUTERAAN MEKANIKAL
UNIVERSITI TEKNIKAL MALAYSIA MELAKA
i
ABSTRACT
A STUDY ON IMPROVING AIR CIRCULATION IN A CONFINED SPACE
(Keywords: Air Circulation, Double-Layer Wall, Natural Ventilation)
The effectiveness of the natural air ventilation in providing fresh air and cooler environment still need further investigation. This natural system has great potential to minimize the utilization of the air conditioning system and its negative effect to our environment. This study proposed a new method which is the usage of double-layer wall and a prism deflector to improve an air circulation in a confined space. Both experimental and simulation approaches were conducted in this study. In the experimental study, an air circulation apparatus was used to study the effectiveness of a double-layer wall and a prism deflector configuration in improving air circulation in a confined space. By fixing the wall distance with various holes angle of inner wall and the prism deflector ratio, data of air velocity, temperature and humidity obtained in this study were used as indication of air circulation improvement in a confined space. The experimental results show CASE 1 to 3 that used 0° hole angle configuration produced about five times higher air velocity than 45° hole angle configuration. However by considering all cases, CASE 6 with 45 hole angle and prism deflector ratio of 2.0 had the highest overall cooling rate. In the other hand, the simulation test modelled the experimental apparatus and the result obtained from the simulation was analyze by using ANSYS FLUENT 14.0. The parameters that were investigated are wall distance, hole angle and prism deflector ratio. The best parameter configuration obtained in this simulation was CASE 9 with 10 mm distance between walls, 45° hole angle and prism deflector ratio of 2.0. From this study, both experimental and simulation approach obtained a similar conclusion on the best configuration. Thus, it was found that the double-layer wall configuration can be used to promote and improve the air circulation in a confined space. However, there is no significant effect for the prism deflector.
Key Researchers:
Dr Yusmady Mohamed Arifin, Safarudin Ghazali Herawan, Mohamad Firdaus Sukri E-mail: [email protected]; Tel. No: 06-234 6802
ii
ACKNOWLEDGEMENT
All praises only to Allah the All Mighty. Only with His permission and guidance this study can be done properly and successfully. Special thanks to my students, Mr Lai Tak Oon and Mr Ewe Tek Bee for their courage and great job in fabricating the apparatus and
collecting data for this study. I would also like to forward my gratitude to Universiti Teknikal Malaysia Melaka (UTeM) for providing the financial support to this study
through the Short Term Grant.
Finally, I would like to thank to my mother Ampuan Azizah binti Chik, my beloved wife Nor Hayati bin Seman@Ismail and my children (Muhammad Muzzammil, Nur Habibah
iii
TABLE OF CONTENTS
ABSTRACT i
ACKNOWLEDGEMENT ii
TABLE OF CONTENTS iii
LIST OF FIGURES vii
LIST OF TABLES xi
LIST OF ABBREVIATIONS xi
NOMENCLATURE xii
GREEK LETTERS xiv
Chapter 1
INTRODUCTION
1.1 BACKGROUND 1
1.2 PROBLEM STATEMENTS 4
1.3 OBJECTIVES 7
1.4 SCOPES 7
Chapter 2
LITERATURE REVIEW
2.1 NATURAL COOLING 9
2.2 SINGLE-SIDED VENTILATION AND
CROSS-SIDED VENTILATION 9
iv
2.4 STACK EFFECT 13
2.5 WING WALL 15
2.6 EFFECT OF AIR GAP WIDTH 16
2.7 THE EFFECTIVENESS OF VARY VENTILATION
OPENING ANGLE ON COOLING PERFORMANCE 17
2.8 WIND INCIDENT ANGLE 21
2.9 COANDA EFFECT 21
2.10 JET FLOW THEORY 22
2.11 VENTILATION 24
2.12 WIND DRIVEN VENTILATION 25
2.13 STACK VENTILATION 26
2.14 DOUBLE SKIN FAÇADE 27
2.15 VENTILATION STANDARDS 28
2.16 VENTILATION STUDIES 29
Chapter 3
METHODOLOGY
3.1 INTRODUCTION 32
3.2 METHODOLOGY FOR AIR CIRCULATION EXPERIMETAL TEST 33
3.2.1 Air Circulation Apparatus Design 35
3.2.2 Experimental Apparatus Set-Up and Procedures 38 3.3 AIR CIRCULATION SIMULATION TEST METHODOLOGY 42
3.4 SIMULATION 43
3.5 MODEL GEOMETRY 45
3.5.1 Parameters 45
3.6 MESHING 46
3.7 BOUNDARY CONDITIONS 48
v
Chapter 4
AIR CIRCULATION EXPERIMENTAL TEST RESULTS AND
DISCUSSION
4.1 INTRODUCTION 51
4.2 RESULTS FOR ALL CASES 52
4.3 COMPARISON BETWEEN CASES 60
4.4 SUMMARY FOR AIR CIRCULATION EXPERIMENTAL TEST 70
Chapter 5
AIR CIRCULATION SIMULATION TEST RESULTS AND
DISCUSSIONS
5.1 SIMULATION RESULTS 72
5.1.1 Velocity Streamlines and Temperature Contours Distribution 72
5.1.2 Multi Points Data 87
5.2 SIMULATION TEST DISCUSSION 91
5.2.1 Flow Pattern 91
5.2.2 The Effect of Hole Angle Type 91
5.2.3 The Effect of Prism Deflector Ratio 93 5.2.4 The Effect of Distance between Walls 94
vi
Chapter 6
CONCLUSIONS
6.1 OVERALL CONCLUSIONS 96
6.2 RECOMMENDATIONS 98
6.2.1 Suggestion for The Experimental Test 98 6.2.2 Suggestion for The Simulation Test 99
REFERENCES 100
Appendices A 104
vii
LIST OF F IGURES
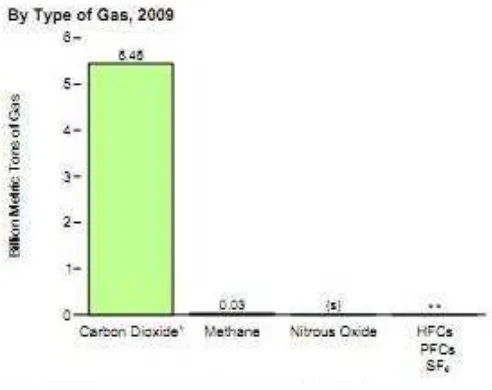
Figure 1-1 Emissions of greenhouse gases 1990-2009 4
Figure 1-2 U.S carbon dioxide emission by sector and fuel, 2005 and 2035 5 Figure 1-3 Carbon dioxide emissions from energy consumption 5 Figure 1-4 Steady rise of air conditioned homes in all regions of the U.S. 6 Figure 2-1 Sketch of cross-sided ventilation (left) and single-sided
ventilation (right) 10
Figure 2-2 Opening configuration of experimental work for investigating
ventilation flow rates in each model 11
Figure 2-3 Wind effect ventilation type 12
Figure 2-4 Stack effect ventilation type 13
Figure 2-5 Wing wall designs used to enhance air circulation 15
Figure 2-6 Schematic diagram of a thermal chimney 16
Figure 2-7 Mass flow rate of different air gap width in three cities 17 Figure 2-8 Different pitch angle of jet fan for a longitudinal
free tunnel simulation 18
Figure 2-9 Mean velocity of louver ventilator by using PIV 19 Figure 2-10 Schematic sketches of three different types of louver ventilator 20
Figure 2-11 Coanda effect on spoon curve 22
Figure 2-12 Schematic sketches of free jet (top) and
wall jet (bottom) 23
Figure 2-13 Wind driven cross ventilation 25
Figure 2-14 Stack ventilation 27
Figure 2-15 Double skin façade 28
Figure 2-16 Acceptable operative temperature ranges
For naturally conditioned spaces 29
Figure 3-1 Air circulation in a confined space apparatus concept 32 Figure 3-2 Air circulation experimental test methodology flow chart 34 Figure 3-3 Air circulation apparatus design layout
viii
Figure 3-4 Overall dimensions of the apparatus 35
Figure 3-5 Detail dimensions of the test section (side view) 36 Figure 3-6 Detail dimensions of the test section (top view) 36
Figure 3-7 Actual air circulation apparatus 37
Figure 3-8 Air circulation apparatus schematic diagram 38
Figure 3-9 Important features of the test section 40
Figure 3-10 Numbers of cases involved in experiment 41 Figure 3-11 Air circulation simulation test methodology 43 Figure 3-12 Schematic diagram of fluid model (side view) 44
Figure 3-13 Model dimension (side view) 45
Figure 3-14 Tree diagram of simulation cases 46
Figure 3-15 Fluid domain meshing 47
Figure 3-16 Velocity contours of the fluid domain 49 Figure 3-17 Temperature contour of the fluid domain 50 Figure 4-1 The effect of air circulation to confined space
temperature and roof temperature (CASE 1) 53
Figure 4-2 The effect of air circulation to confined space
relative humidity and air velocity (CASE 1) 53
Figure 4-3 The effect of air circulation to confined space
temperature and roof temperature (CASE 2) 54
Figure 4-4 The effect of air circulation to confined space
relative humidity and air velocity (CASE 2) 54
Figure 4-5 The effect of air circulation to confined space
temperature and roof temperature (CASE 3) 55
Figure 4-6 The effect of air circulation to confined space
relative humidity and air velocity (CASE 3) 55
Figure 4-7 The effect of air circulation to confined space
temperature and roof temperature (CASE 4) 56
Figure 4-8 The effect of air circulation to confined space
ix
Figure 4-9 The effect of air circulation to confined space
temperature and roof temperature (CASE 5) 57
Figure 4-10 The effect of air circulation to confined space
relative humidity and air velocity (CASE 5) 57
Figure 4-11 The effect of air circulation to confined space
temperature and roof temperature (CASE 6) 58
Figure 4-12 The effect of air circulation to confined space
relative humidity and air velocity (CASE 6) 58
Figure 4-13 The effect of air circulation in a confined space
to relative humidity for all cases 60
Figure 4-14 The effect of air circulation in a confined space
to relative humidity difference for all cases 61 Figure 4-15 The effect of air circulation in a confined space to air velocity
for all cases 63
Figure 4-16 The effect of air circulation in a confined space to temperature
for all cases 64
Figure 4-17 The effect of air circulation in a confined space to temperature
difference for all cases 65
Figure 4-18 The effect of air circulation in a confined space to cooling rate
for all cases 66
Figure 4-19 Overall temperature difference and overall cooling rate
for all cases 67
x
Figure 5-9 Velocity streamlines (side view) for case 4 78 Figure 5-10 Temperature contour (side view) for case 4 78 Figure 5-11 Velocity streamlines (side view) for case 5 79 Figure 5-12 Temperature contour (side view) for case 5 79 Figure 5-13 Velocity streamlines (side view) for case 6 80 Figure 5-14 Temperature contour (side view) for case 6 80 Figure 5-15 Velocity streamlines (side view) for case 7 81 Figure 5-16 Temperature contour (side view) for case 7 81 Figure 5-17 Velocity streamlines (side view) for case 8 82 Figure 5-18 Temperature contour (side view) for case 8 82 Figure 5-19 Velocity streamlines (side view) for case 9 83 Figure 5-20 Temperature contour (side view) for case 9 83 Figure 5-21 Velocity streamlines (side view) for case 10 84 Figure 5-22 Temperature contour (side view) for case 10 84 Figure 5-23 Velocity streamlines (side view) for case 11 85 Figure 5-24 Temperature contour (side view) for case 11 85 Figure 5-25 Velocity streamlines (side view) for case 12 86 Figure 5-26 Temperature contour (side view) for case 12 86 Figure 5-27 Designated probe points in a confined space to take data 87 Figure 5-28 Air velocity at measurement points for 0° hole angle 88 Figure 5-29 Air velocity at measurement points for 45° hole angle 90 Figure 5-30 Temperature for various cases at point 4 90
Figure 5-31 Average velocity for all cases 92
xi
LIST OF TABLES
Table 2-1 Comparison among different methods for ventilation studies 31
Table 3-1 Test section configuration 39
Table 3-2 Details value of meshing 48
Table 4-1 List of cases for experiment 51
Table 5-1 Parameter configuration for simulation test 74 Table 5-2 Coordinates for the designated measurement points 87
LIST OF ABBREVIATIONS
ASHRAE American Society of Heating, Refrigerating and Air-Conditioning Engineers
BSRIA Building Research and Information Association CFD Computational Fluid Dynamics
EIA U.S. Energy Information Administration FKM Faculty of Mechanical Engineering
HVAC Heating, Ventilation and Air Conditioning
LES Large eddy simulation
NPL Neutral Pressure Level PIV Particle Image Velocimetry
RECS Residential Energy Consumption Survey RANS Reynolds averages Navier-Stokes equation UTeM Universiti Teknikal Malaysia Melaka
xii
CD Opening’s discharge coefficient [-]
CD,total Total discharge coefficient [-]
CD1 Inlet discharge coefficient [-]
CD2 Outlet discharge coefficient [-]
Cp,leeward Pressure coefficient on leeward site [-]
Cp,windward Pressure coefficient on windward site [-]
Cpw Pressure coefficient on windward site [-]
Cpl Pressure coefficient on leeward site [-]
C2 Unit conversion factor [-]
DH Hydraulic ray [m]
do Jet’s diameter on wall [m]
g Gravity acceleration [ms-2]
H Height at required location [m]
Hc Height of confined space [m]
HNPL Height at neutral pressure [m]
K Coefficient of effectiveness [-]
L Distance between walls [mm]
Lc Length of confined space [m]
Ps Stack effect pressure different [m]
xiii
RHo Relative humidity of air at the moment of spotlight
turns on [-]
RHc Relative humidity of air [-]
Tc Confined space temperature [oC]
Tc,1 Final confined space temperature [oC]
Tc,0 Initial confined space temperature [oC]
Ti Average inside temperature [oC]
Tin Average indoor air temperature at height H [°C]
To Confined space temperature at the moment of spotlight turns on [oC]
To Average outside temperature [oC]
Tout Average outdoor air temperature [°C]
TR Roof temperature [oC]
Tc Confined space temperature difference [oC]
Tc,overall Overall temperature difference [oC]
t Time in minute [min]
x Velocity core distance from wall [m]
xiv
GREEK LETTERS
Inclination angle [o]
Air density [kgm-3] Inner wall hole angle [o]
i
Inner louver angle [o]
o
1
Nowadays, the concern on manipulating the natural air ventilation becomes more significant due to energy and environment factors. Thus, many researchers have done a lot of investigation on these matters. Initially, the understanding on how previous generation effectively used this system needs to be studied. Fordham, (2000), studied about how previous generation used the system by implementing specific building design and describe few factor that need to be considered for natural air ventilation system such as warm summer temperatures, provision of clean air, air movement, heat reclaim, and thermal capacity. Hirano et al., (2006), proposed a porous building method that used upto 50% void ratio of the building. The method achieves much more efficient natural ventilation because of the air flow rate inside the voids. Most of the researchers conducted a simulation to study the natural air ventilation system. Ayata et al., (2006) used computational fluid dynamic (CFD) method to investigate the potential use of natural ventilation in new building designs and found that the orientation of building and a proper indoor design can significantly increase the capability of air ventilation during hot days.
2
fully appreciate the utilization of the natural air ventilation system. It is significant if we can reuse again this concept to minimizing the utilization of air conditioning system.
Nowadays, air conditioning system is used intensively for ventilating and cooling buildings space. As energy demand is keeps on increasing significantly while oil price is surging high, a better solution on decreasing total energy usage is extremely needed. Thus, passive cooling strategy comes into play. Passive cooling strategy which can be easily adopted by harvesting natural surrounding air for ventilation purposes were extensively studied by researchers. These studies had proven that natural cooling can be an alternative way on cutting down energy consumption rate.
A building which is occupied by people tends to consume a lot of electricity. This is because human tends to spend most of his time for indoor activities. Scientific studies on energy used in service and residential buildings showed that 6.9% of total energy consumption for space cooling was contributed by Heating, Ventilation and Air Conditioning (HVAC) systems (Orme, 2001). Paper published by Orme (2001) only holds true in Europe and North America as the investigation was based on energy consumption of 13 countries from these two continents. On the other hand, total energy consumption for space cooling in countries with all year round hot climate was expected greater than countries which endure 4 seasons.
In the perspectives of environmental stand point, the utilization of natural cooling can protect the living environment of human being. This is because natural cooling strategy utilization in buildings able to counter the effect of global warming. Severe decrease of fossil fuel consumption will results in less release of Carbon content gases into the air atmosphere, which severely contributes to greenhouse effect.
American Society of Heating, Refrigerating and Air-Conditioning Engineers (ASHRAE) Fundamental 2001 reveals that ventilation in building is important. The level of ventilation in a given building space determines the level of sickness for that particular confined space. Thermal stress and air humidity build up in poor ventilated space will severely affects the air quality. Temperature and moisture hike in a confined space will results in deteriorative machineries performance and short machineries lifespan.
3
to be done. This is mainly due to many implemented natural ventilation strategies which used to enhance air circulation suffered from different short outcomes. However, focus on improving ventilation in confined space should remain firmed as findings from this specific field will able to provide a fuel saving solution, which will be beneficial to many parties.
There are two main types of building cooling strategy which are active cooling and passive cooling. Active cooling would be HVAC system and depends to electricity. Mechanical ventilation like fan and duct are under this category. On the other hand, passive cooling does not require any energy. There are many design of passive cooling such as wind tower, wind catcher or ventilation.
The purpose of ventilation is not just create the air flow in a building, it also remove heat generated from people and other equipment in the occupied space. Other than that, ventilation is needed to remove hazardous chemicals from the confined space. The most likely purpose of ventilation is for maintaining human comfort and health.
Natural ventilation uses the design of the wall openings to utilize air flow in the building. There are low pressure and high pressure openings. The difference between these openings will create air flow that flows from high pressure to low pressure. The air flow also helps to cools the interior building. The wall that has high pressure openings is called windward side while the wall of low pressure side is called leeward side. There are two major type of ventilation, which is wind induced ventilation and stack ventilation. Sometimes, it is normal to have the combination of both.
4
1.2 PROBLEM STATEMENTS
A confined space which is ineffective in exchanging inside air with outside air will prone to dissipate heat less effectively. As the result, poor air ventilation will induce biological strain to occupant. In this case, energy consumption unit such as air-conditioning and fan is needed to cool down the temperature and circulates the air in confined space.
In this twenty first century, the global warming issue is becoming serious. The earth has its temperature increased. The effect of global warming is catastrophic. It makes the iceberg melts, ocean level rises and major weather changes. Crop start to reduce due to weather changes and human would end in starving if no action is being taken to prevail global warming. The cause of the global warming comes from greenhouse gases. Greenhouse gases consist of carbon dioxide, methane, nitrous oxide and refrigerant gases. Carbon dioxide has the highest global warming potential compare to others, referring from Figure 1-1. From the annual energy review 2010 as shown in Figure 1-2, carbon emission from electricity generation is the highest in present and also in predicted future. The electricity demand is increasing and so as the carbon dioxide emission.
5
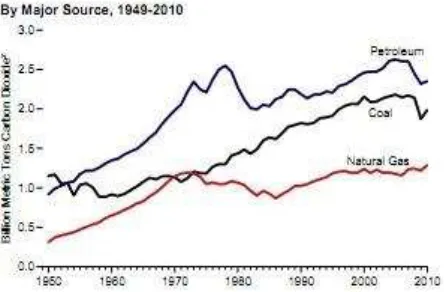
The major source of carbon dioxide production was from petroleum, coal and natural gas energy production as shown in Figure 1-3. Although the trend is start is to decrease slightly, more efforts need to be put on to prevent global warming like decreasing the demand of the electricity load. When population increases, the buildings are also increased to meet the demand. Buildings in present are often relied to HVAC system to cool or heat itself which consume a lot of energy.
Figure 1-2 U.S carbon dioxide emission by sector and fuel, 2005 and 2035 (million metric tons) (Annual Energy Review, 2010)
Figure 1-3 Carbon dioxide emissions from energy consumption (Annual Energy Review 2010)
6
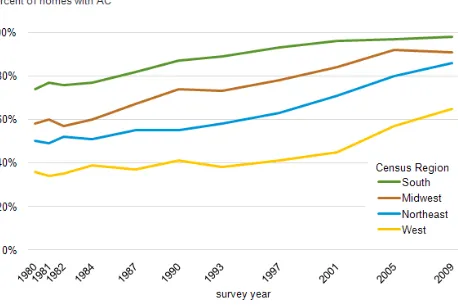
of leakage in unavoidable. As in the population of seven million in earth, more and more buildings are going to build and more HVAC system is installed. According to Residential Energy Consumption Survey (RECS, 2009) from Energy Information Administration (EIA), the survey was taken from 12,083 household from four different regions. From Figure 1-4, it was expected the air conditioning in residential to be increase. The data is reliable because it was compared with data from energy supplier.
Figure 1-4 Steady rise of air conditioned homes in all regions of the U.S. (RECS, 2009)
Carbon dioxide and refrigerant gases would become greater and global warming effect would be increase if no action has been taken. Out of many solutions, this study tackles building cooling strategy without depending to the HVAC system.
7
1.3 OBJECTIVES
1.3.1 To investigate the utilization of double-layer wall sand the prism deflector configuration in improving air circulation in a confined space by using an experimental apparatus.
1.3.2 To investigate the utilization of double layer walls and prism deflector with different configuration to enhance the air circulation in a confined space by using ANSYS FLUENT 14.0 simulation software.
1.4 SCOPES
1.4.1 Experimental Approach
a) To develop an experimental apparatus to investigate air circulation improvement in a confined space by using double-layer wall and prism deflector system.
b) To improve air circulation by using double-layer wall with certain hole angle ( =0 and 45) and prism deflector with certain ratio (R= 0.5, 1.0 and 2.0).
c) To measure air velocity, air temperature and air humidity continuously at the center of a confined space to show the air flow and air condition changes due to air circulation enhancement.