Master of Manufacturing Engineering (Industrial Engineering)
2014
Faculty of Manufacturing Engineering
WASTE REDUCTION IN TEXTILE MANUFACTURING
COMPANY BY VALUE STREAM MAPPING
WASTE REDUCTION IN TEXTILE MANUFACTURING COMPANY BY VALUE STREAM MAPPING IMPLEMENTATION
SITI NURFATIHAH BINTI AB RASID
A thesis submitted
in fulfillment of the requirements for the degree of Master of Manufacturing Engineering (Industrial Engineering)
Faculty of Manufacturing Engineering
UNIVERSITI TEKNIKAL MALAYSIA MELAKA
DECLARATION
I declare that this thesis entitled “Waste Reduction in Textile Manufacturing Company
by Value Stream Mapping Implementation” is the result of my own research except as
cited in the references. The thesis has not been accepted for any degree and is not
concurrently submitted in candidature of any other degree.
Signature : ...
Name : ...
APPROVAL
I hereby declare that I have read this dissertation/report and in my opinion this dissertation/report is sufficient in terms of scope and quality as a partial fulfillment of Master of Manufacturing Engineering (Industrial Engineering).
Signature :………..
Supervisor Name :………
DEDICATION
To my beloved father and mother Encik Ab Rasid bin Mohamed and Puan Siti Minah binti Derahman, and my siblings, thank you for your supports for me to do my best on my Master Project. The motivation and encouragement inspired me to serve the best in my projects. To my Master Project Supervisor, Dr. Effendi bin Mohamad, thank
i
ABSTRACT
ii
ABSTRAK
iii
ACKNOWLEDGEMENTS
v
2.7 Takt time 27
2.8 Yamazumi chart 27
2.9 Spageti Diagram 28
2.10 Ishikawa Diagram 29
3. RESEARCH METHODOLOGY 30
3.1 Company Background 30
3.2 Identification of product Family 31 3.3 Development of Current State Map 32
3.3.1 Observation 33
3.3.2 Time Study 33
3.3.3 Steps in developing CSM 34 3.4 Determination of Wasteand Analysing Problem Area 38
3.4.1 Spaghetti diagram 39
3.4.2 Yamazumi chart 41
3.4.2.1 Takt time 41
3.4.3 Ishikawa Diagram 42
3.5 Development of Future State Map 42
4.3 Identification and Analysis of problem 57
4.3.1 Primary process 57
4.3.2 Plating process 58
4.3.3 Inspection Process 59
4.3.3 Checking Process 60
4.4 Suggestion for improvement 61
4.5 Development FSM 70
5. CONCLUSION AND RECOMMENDATIONS 72
5.1 Conclusion 72
5.2 Recommendation 73
vi
4.7 Cycle time for quality inspection process 48
4.8 Cycle time for checking process 48
4.9 Cycle time for palletizing process 49
4.10 Average Data Collection 49
4.11 Requirement data 49
4.12 Why why Analysis 56
vii
2.5 Example of spaghetti diagram 29
3.1 Project methodology 31
3.2 Process of ball pin manufacturing 32
3.3 Stop watch for data collection 34
4.1 Primary process (Workstation 1) 44
4.2 Plating process (Workstation 2) 44
4.3 Quality inspection process (Workstation 3) 45
4.4 The Current State Map (CSM) 50
viii
4.15 Location to locate the product after primary process 63 4.16 The sign board at the primary process 64
4.17 Waiting product 65
4.18 a)Defect product, (b) Tag for rejected product 65
4.19 Condition at plating process 66
4.20 Recommended layout for placed product at plating process 66
4.21 Poor arrangement 67
4.22 Workplace area 67
4.23 Poor labeling 68
4.24 Example of template 69
ix
LIST OF ABBREVIATIONS
SOP - Standard of procedure CSM - Current State Map FSM - Future State Map VSM - Value Stream Mapping LM - Lean Manufacturing VA - Value Added
NVA - Non Value Added
NNVA- Necessary but non-value adding EOQ - Economic Order Quantity JIT - Just In Time
SMED - Single Minute Exchange Die FIFO - First In First Out
x
LIST OF PUBLICATIONS
NO PUBLICATION
1 CHAPTER 1
INTRODUCTION
1.1 Background of Study
Nowadays, manufacturing industries have become tougher and a very competitive markets ever since. Most of the companies are trying hard to make sure that their businesses can sustain in this situation. In order to sustain their businesses, the companies used several methods and approaches to keep them competitive and relevant. One of the methods is Lean Manufacturing (LM). Womack et al. (1996) state that, the LM is a philosophy that used to improve the manufacturing system by eliminating waste or non-value added activity along the process flow. Many organizations believed that by implementing LM, cost can be reduced and also optimizing the production.
2
Recently, many problems occur at the selected textile industry. One of the problems that occur is increasing of waste. This condition may lead to increase the lead time. Value Stream Mapping (VSM) will provide detailed understanding of all the processes involved in production and thus will improve it. This tool can help an
organization to minimize waste at all level, improve the quality, and reduce cost and time. Furthermore, to implement the lean concept in industry, top management also play important role to support for the LM success.
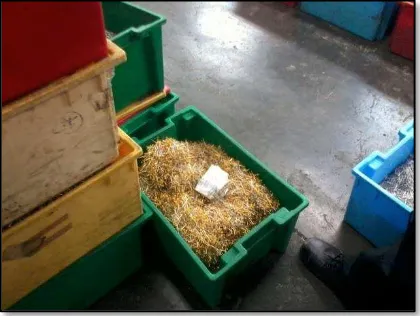
1.2 Problem Statement
3
Figure 1.1: Poor arrangement of workplace
Figure 1.2: Product waiting for the next process
1.3 Objectives
1) To develop current state map (CSM) of textile manufacturing industry. 2) To determine wastes by analysing CSM.
3) To develop future state map (FSM).
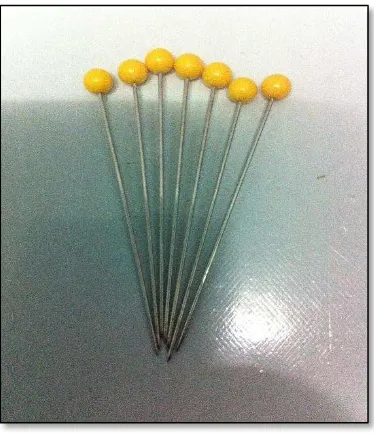
4 1.4 Scope and Limitation
The scope of this study is focusing on the production of product ball pin in a textile company. Figure 1.3 shows the product of ball pin. The processes that focus in this study are primary process, plating process, quality inspection, checking and palletizing. Indeed, the limitation of the study is only propose some improvement to the company to reduce waste and lead time.
5
1.5 Report Outline
Chapter 1 generally discusses about the introduction which consists of background of the study, problem statements, and objectives, scope of study and report outlines.
Chapter 2 were discussed about literature review based on collected data and information. This chapter discusses about lean, VSM and the implementation techniques to be used in industries.
Next, Chapter 3 were discussed the methodology in the study. This chapter will discuss the study methodologies that will be used to collect relevant data to support the development and analysis of the study.
6 CHAPTER 2
LITERATURE REVIEW
2.1 Lean Manufacturing (LM)
The LM begins when the westerner realized the potential of Japanese car in producing a car with mass production of high quality product at a lower cost. The term of LM has been introduced by Womack (1990), it described the TPS (Toyota Production System) and term it as Lean Production or Lean Manufacturing (Kumar and Kumar, 2012). LM can defined as systematical approach to identify waste and then continuous improvement will be done to eliminate (Choudhary et al., 2012). According to Chitturi et al. (2007), LM means identifying non value added activities throughout the supply chain to eliminate the waste. In other opinion, the concept of LM is the need to provide more value to customers and reduce waste for the organization. Focus of lean thinking is creating a perfect process of value creation in product development and operation (Lummus et al., 2006).
7
other hand and etc. VA is an operation that involves in the raw material process or semi-finished products using manual labor.
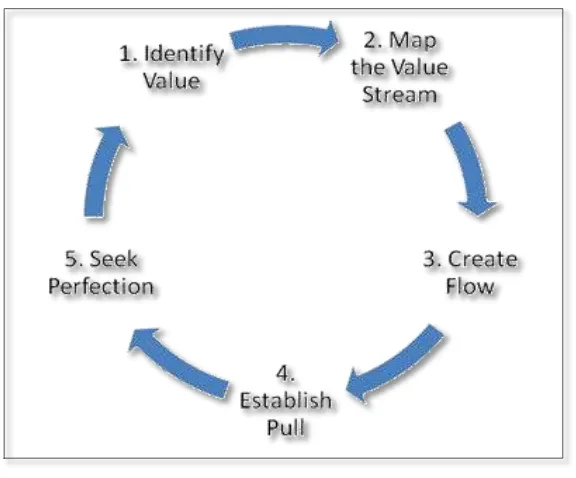
2.2 LM Principle
Five principles are proposed in order to achieve the LM. These five LM principles will ensure that the organization produces the most effective means of value for customer. Other than that, these principles will help company to identify and eliminate the non value adding and wasteful activities. According to Womack et al.(1996), five principles of LM are specify value, value stream, create flow, customer pull and pursue perfection. The Figure 2.1 below shows the principles of LM.
Figure 2.1: Principle of LM (Womack et al., 1996)
2.2.1 Identify Value
8
1996). The producer exists because of the value comes from customer point of view and was created by producer (Womack et al., 1996). Usually producer tends to make what they already make and the customer can only settle for what they offered. The situation shows that the producer does not see what customer really want and when customer no longer accept what has been offered, the producer then will lower their price as a technique to persuade customers to purchase back. It is really important to identify the value or what customer view because the indicator on what activities that add value and activities does not add value.
2.2.2 Map the Value Stream
The second step in LM principle is to identify and map the value stream. Mapping a value stream means compress of both VA and NVA from product overview starting at the raw material and finish in the hands of the customer (Duggan, 2002). A value stream map is a tool used to chart the materials and information flow from the raw material stage, through the factory floor, to the finished product. It will provide from starting to delivery process that add value and does not add value to customer perspective. The purpose of the map is to determine and eliminate waste in the process by providing a systematic approach to plan how and when they implement and changes can be made that make it satisfied to customer demand (Tapping et al., 2002).
2.2.3 Create Flow
9
continuously from a process to another process without stopping or having to wait in the manufacturing plant. It can be done by putting an effort to eliminate waste or obstacle along process flow and thus resulting in minimizing the non value added and maximizing the value added activities.
2.2.4 Establish Pull
The fourth step in LM principle is to establish pull. The idea of letting the customer pull the product for you as they need rather than pushing products onto the customer is the pull theory (Womack et al, 1996). Production only response to the customer demand by producing only what customer need and when they need it. Its mean that nothing is made until it is requested and then once requested, make it as fast as possible. In order to establish pull, it is important to properly design, schedule and fullfill the customer’s requirement.
2.2.5 Seeking Perfection
The final step in LM principle is seeking perfection or continuous improvement. The concept behind perfection is there is no endless opportunity to improve by reducing costs, scrap, mistakes, space and etc. Perfection are an aspiration goal and can be only attained by definition. However, there is always room for more continuous improvement during the process of pursuing perfection in the system.
2.3 Value Stream Mapping (VSM)
According to Pan et al., (2010), VSM is one of the methods of visually mapping
a product’s production flow. This method maps the flow of material and information