UNIVERSITI TEKNIKAL MALAYSIA MELAKA
EVALUATION OF VALUE STREAM MAPPING USING
SIMULATION IN TEXTILE MANUFACTURING INDUSTRY
This report submitted in accordance with requirement of the Universiti Teknikal Malaysia Melaka (UTeM) for the Bachelor Degree of Manufacturing Engineering
(Manufacturing Management) (Hons.)
by
NUR QURRATUL AIN BINTI ADANAN B051110050
920726065164
EVALUATION OF VALUE STREAM MAPPING USING
SIMULATION IN TEXTILE INDUSTRY
NUR QURRATUL AIN BINTI ADANAN
B051110050
DECLARATION
I hereby, declared this report entitled “Evaluation of Value Stream Mapping using Simulation in Textile Manufacturing Industry” is the results of my own research
except as cited in the references.
Signature : ………
Author’s Name : Nur Qurratul Ain Binti Adanan
APPROVAL
This report is submitted to the Faculty of Manufacturing Engineering of UTeM as a partial fulfilment of the requirements for the degree of Bachelor of Manufacturing Engineering (Manufacturing Management) (Hons.). The member of the supervisory is as follows:
ABSTRACT
This report is about the application of simulation in lean manufacturing systems which mean the value stream mapping of safety pin production line in Prym Consumer Sdn Bhd is translated to the simulation model. The factor of this study is the limitation of the traditional value stream mapping (VSM) which does not have the capability to response to rapid changes and can’t illustrate the waste impact of the changes in the production line of work processes change continuously. So, VSM translated into a simulation to demonstrate the changes behaviour based on the input of the model. From the collected data, and an adaptation of the whole production flow, the current state of VSM snapshot is developed. The analysis later is done to simulate the simulation model where the current simulation model is analysed using Witness simulation software to identify the wastes in the safety pins production line. Finally, several alternatives of recommended simulation model deployment are conducted on the validated simulation model. The experiment of improvement was built-up based on two types of wastes which are waiting time and unnecessary inventory. The result of this study includes the simulation scenarios of waste elimination and proposed final improvement simulation model where the lead time is reduced by 14.29%, from 17 days to 15 days only with no implication cost involved. The study is indeed very useful to the company because the simulation model of Value Stream Mapping is very greatful tool, where it can demonstrate the changes in the behaviour of the system adhering of the inputs to the model.
ABSTRAK
Laporan ini adalah mengenai penggunaan simulasi dalam sistem pembuatan ‘lean’ dimana ‘value stream mapping’ aliran pengeluaran ‘safety pin’ di Prym Consumer Sdn Bhd dan diterjemahkan kepada model simulasi. Faktor dalam kajian ini adalah had ‘value stream mapping (VSM)’ tradisional yang tidak mempunyai keupayaan untuk respon kepada perubahan-perubahan yang pesat dan tidak dapat menggambarkan kesan sisa perubahan dalam aliran pengeluaran perubahan proses-proses kerja secara berterusan. Oleh itu, VSM ditukarkan kepada simulasi untuk demostrasi perubahan tingkah laku berdasarkan maklumat yang diperoleh daripada model. Daripada data yang dikumpul, dan adaptasi daripada aliran pengeluaran keseluruhan, gambaran keadaan semasa VSM dibangunkan. Analisis kemudiannya dilakukan untuk mensimulasikan model simulasi di mana semasa model simulasi yang telah dijalankan dianalisis menggunakan perisian simulasi Witness untuk mengenal pasti sisa-sisa dalam aliran pengeluaran ‘safety pin’. Akhirnya, beberapa alternatif penambahbaikan model simulasi dilakukan pada model simulasi yang telah disahkan. Percubaan penambahbaikan adalah binaan berdasarkan dua jenis sisa iaitu masa menunggu dan inventori yang tidak diperlukan. Hasil daripada kajian ini merangkumi senario simulasi eliminasi sisa dan cadangan penambahbaikan akhir model simulasi di mana masa yang membawa akan dikurangkan dengan 14.29%, dari 17 hari hingga 15 hari sahaja dengan tidak mempunyai implikasi kewangan. Kajian ini sememangnya sangat berguna kepada syarikat kerana model simulasi ‘value stream mapping’ adalah alat yang sangat hebat, di mana ia dapat menunjukkan perubahan dalam tingkah laku berdasarkan sistem input kepada model.
DEDICATION
To my beloved mother Noraini Jamiah Haji Salihi, my father Adanan Mamat and all my siblings, I love you. Special to all Palestinian people, Rohingya people, all Muslims and all good people in the world who are living in the war, poverty and torture, I finished my Final Year Project is because of you. I really hope that I can
help you with all the knowledge that I gain one day.
ACKNOWLEDGEMENT
First of all, I would like to express my gratefulness to Allah S.W.T for giving me a strength and wisdom to finish my project. I also would like to express my appreciation to the following individuals for providing me the encouragement and help. My genuine thanks go to my lecture also known as supervisor, Mr. Nor Akramin bin Mohamad for support, enthusiasm and treasurable guidance. His constructive comments were vital to the development of this study.
Correspondently, I’m thanking to my parents for helping me throughout the project and giving a financial support until I successfully complete this study. Their undivided love and livelihood are the beacons that have continued to motivate me through the harshest of situations. I also thank all my friends for their continuing inspiration and support. I’m appreciatively expressing my thanks to all my lecturers, friend and many other personnel I have spoken with about this study for sharing their helpfulness, ideas and kindness.
Last but not least, I wish to acknowledge all persons who give support, advice, and assistance that are directly or indirectly involved to the success of my study. Thank you so much.
TABLE OF CONTENT
2.3.3.1 Values Stream Mapping Icons 15 2.1.3.2 Value Stream Mapping Phase 16
2.1.3.3 Current State Map 17
2.1.3.4 Future State Map 18 2.1.3.5 Benefits of Value Stream Mapping 19 2.1.3.6 Limitation of Value Stream Mapping 20 2.1.3.7 Various Method used in Value Stream Mapping 20
2.2 Simulation 22
2.2.1 Simulation of Manufacturing System 23 2.2.2 Development of Manufacturing Simulation 23 2.2.3 Application Areas of Manufacturing Simulation 23
2.2.4 Simulation Model Study 26
2.2.5 System and System Environment 26
2.2.6 Component of the System 27
2.2.7 Discrete and Continuous System 27
2.2.8 Model of a System 28
2.2.9 Types of Models 28
2.2.10 Discrete-event System Simulation 28 2.3 Value Stream Mapping and Simulation 29
2.4 Summary 31
3.2.1.1 The Process flow of the Production Line 38
3.2.1.2 Time Study 38
3.2.2 Secondary Source 38
3.3 Steps in Simulation Study 39
3.3.1 Problem Formulation 40
3.3.2 Setting of Objective and Overall Project Plan 40
3.3.3 Model Conceptualization 40
3.3.4 Data Collection 41
3.3.5 Model Translation 41
3.3.6 Model Verification 42
3.3.7 Model Validation 43
CHAPTER 4: RESULT AND DISCUSSION 45
4.1 Production Line for Safety Pin 45
4.2 Data Collection 48
4.2.1 Demand, Cycle Time and Working Hours 48
4.2.2 Capacity 49
4.3 Developing Current State Value Stream Mapping 50 4.3.1 Analysis of Current State Value Stream Mapping 53
4.4 Conceptual Modelling 54
4.4.1 Modelling Objectives 55
4.4.2 Experimental Factors and Responses 56
4.4.3 Model Scope 56
4.8 Analysis of Current Simulation Model 64
4.9 Improvement Simulation Model 65
4.9.1 Scenario 1 66
4.9.2 Scenario 2 67
4.9.3 Scenario 3 68
4.9.4 Scenario 4 70
4.10 Comparison of All Alternatives 71
4.11 Final Improvement 72
4.12 Summary 72
CHAPTER 5: CONCLUSION & FUTURE WORK 73
5.1 Summary 73
5.2 Recommendation 74
REFERENCES 75
APPENDICES
A Details of Simulation Model for Current Model B Details of Simulation Model for Scenario 1 C Details of Simulation Model for Scenario 2 D Details of Simulation Model for Scenario 3 E Details of Simulation Model for Scenario 4
LIST OF TABLES
1.1 Organization of the report 5
2.1 Review paper on methods study 24
3.1 The collection of data and method of data collection 38
4.1 A brief description of the process and the area involved 46 4.2 The demand, working hours and lot cycle time for safety pins
production 49
4.3 Capacity of safety pin production line 49 4.4 The details of each process or area on Current Value Stream
Mapping 51
4.5 The current state of VSM 53
4.6 The capacity and value added and non-value added for each
process or area 54
4.7 Experimental factors and responses of model 56
4.8 Model scope 56
4.9 The description of the element 58
4.10 The capacity and the cycle time for each process or area 61 4.11 The comparison of lead time in simulation model 63 4.12 The output of buffer time for each process or area 65 4.13 The comparison of lead time in simulation model 67 4.14 The comparison of lead time in simulation model 68 4.15 The comparison of lead time in simulation model 69 4.16 The comparison of lead time in simulation model 71 4.17 The comparison of all alternatives with the implication of cost 71
LIST OF FIGURES
2.1 Five lean principle 10
2.2 Lean tools (Dennis, 2007) 12
2.3 Current state of VSM 14
2.4 Future state of VSM 15
2.5 Value Stream Mapping Icons 16
2.6 The key concept of Value Stream Mapping 31
3.1 Flowchart of the study 34
3.2 Gantt chart of the study 36
3.3 Steps in a simulation study 39
3.4 WITNESS 13’ Software 42
4.1 Production Phase in safety pins production line 46 4.2 Current State Value Stream Mapping for safety pin production
line 52
4.3 Added value and non-added value 53
4.4 A framework for conceptual model (Robinson, 2008) 55
4.5 Current state of simulation model 60
4.6 The illustration of the current simulation model 64
4.7 The illustration of Scenario 1 66
4.8 The illustration of Scenario 2 67
4.9 The illustration of Scenario 3 69
4.10 The illustration of Scenario 4 70
LIST OF ABBREVIATIONS, SYMBOLS AND
NOMENCLATURE
CSVSM - Current State Value Stream Mapping C/T - Cycle Time
C/O - Changeover
DES - Discrete Event Simulation EPE - Every Part Every Second FMS - Flexible Manufacturing System FSVSM - Future State Value Stream Mapping
NIST - National Institute of Standard and Technology SCM - Supply Chain Management
SD - Highly Used
UTeM - Universiti Teknikal Malaysia Melaka VSM - Value Stream Mapping
The first section of this report is the overall view of the study that describes on what the research is about, the purpose of the study as well as the limitations or the boundary of the respected study. The structure of the report of the subject area is briefly explained on top to ensure a better visualization of the successions of the entire study.
1.1 Background
The stunning growth of the Malaysian textile production network has been moderating a modest of bunch scholarly study in the range of worldwide inventory network for the abilities and performance. The textile manufacturing industry is most needed in worldwide industries. Escalating in this demanding industry requires synergistic production planning and routine analysis, letting in all levels of operations. An increasing global need for natural resources and the inherent challenges accompanying this demand pose a great labour for manufacturing companies. In fact, the demanding and the alteration of the manpower as well as the desire for new individualized products makes manufacturing industry more challenging than ever (Herrmann et al, 2014). Lean manufacturing has got into an urgent voice in the advancement of the present day manufacturing industry. Albeit such performances have been filled with achievement, the production line planning is an important role to control and cope effectively. Lean manufacturing is the methodical methodology for identifying and taking out the detected waste which is a non-value added included activities at the puff of the customer in the quest for the
INTRODUCTION
CHAPTER 1
flawlessness through the consistent change by streaming the product (NIST, 2000). Therefore, it is necessary to examine the production line planning in society to obtain an optimal outcome and reducing the piling up of stock list.
Indeed, it’s a standout amongst the most centred standards utilized as a component of numerous associations where the name of lean has become to be unbounded in the manufacture scene. Lean manufacturing gives the establishment to dispense with squanders and sustain the association with nonstop change society. On that point are numerous creatures in the Lean Manufacturing, which are applied as a portion of the waste; where the Value Stream Mapping (VSM) is a standout amongst the most looked for method’s designs. Value Stream Mapping is generally recognized as the visualization tool where it facilitates the management group to perceive squander and distinguish the causes counted within. The Value Stream Mapping delineates the stream of resources and information from the first process of the material come as crude resources through all the manufacture sequences of process till handed the product to customers. The mapping exercises incorporate all the parameters, for example, the arrival time, setup time, overall equipment efficiency, and number of lot size at the workstation. The preliminary mapping procedure acknowledged as 'Current State Map' which demonstrates how things right now resemble the other much the same, and the further change of it called as 'Future State Map', which serves as establishment after inefficiencies in the current body politic have been eradicated.
Once the current models are acquired and validated in the simulation, it can be utilized in a vast manner to investigate all the alternative solution regarding the real-world system which can bring the organization to the optimum level of performance. Hence, the operation flow of production line in the textile manufacturing industry is the ideal to employ.
Since its inception, simulation has been applied widely to various sectors, such as manufacturing, services, military applications, building engineering, simulation in industrial design, logistics, power and transport plants, aerospace and public services.
1.2 Problem Statement
At Prym Consumer Sdn Bhd, there are several unpleasant feedbacks from the customer where the finished product is arriving late in the hand of the customer. Hence, to make the continuous improvement is increasingly stressed about, lean manufacturing is one of those methods that can assist in the identification and evacuation of wastes. Though, Value Stream Mapping is one of the successful tools of lean manufacturing implemented by many manufactures. It was a potent visual tool used in testing the stream and information at the time an order is placed, at the time the product presented to the customer within the value stream waste can be identified quickly in a little time period.
Nevertheless, traditional Value Stream Mapping gives the snapshot image of the problem occurred within a system, it does not hold a capability in response to changes occurred in the production line where the work processes change continuously. Besides, traditional Value Stream Mapping can’t relate the transportation delays and changes in the transfer of batch sizes due to material handling and operation parameters such as machine cycle time and delay buffer. Without the structure of the layout in Value Stream Mapping, it is hard to illustrate the impact of waste that happens in the production line.
Simulation is defined as the procedure of projecting a model of an existing system and conducting experiments (Pedgen et al. 1995). Simulation offers a tool to
analyses, visual and experiment the model before the execution. It possesses the ability to react to changes occurred in the process and can be applied in enhancing the limitation of traditional Value Stream Mapping. Therefore, Discrete Event Simulation based Value Stream Mapping approach is preferred to model a current value stream mapping of the process flow of production line in the textile manufacturing industry and recommend a Simulation based future Value Stream Mapping.
Consequently, in this study, the simulation is used to demonstrate the changes of the system behaviour based on the input of the model.
1.3 Objectives
The objectives of this study are:
1.3.1 To study the current process flow of production line and gather the data for the Value Stream Mapping (VSM) and simulation model input.
1.3.2 To develop and analyse the Current State Value Stream Mapping and the simulation model.
1.3.3 To recommend the improvement based on the analysis done in the simulation model.
1.4 Scope
This study concentrates on the understanding of Value Stream Mapping (VSM) in the textile manufacturing industry within the Prym Consumer Sdn. Bhd. At this stage, the discrete event system simulation will be utilized in the modelling of VSM within the whole production process required of safety pins. A VSM model in the textile manufacturing industry will be built up and analyse. Then, a simulation model is developed using WITNESS based on the current state of VSM model. As a result, the program layout is assumed to be fixed and standardize in the production
workstation area. Besides, remodelled data are collected to model the current state of matters in each workstation such as the arrival time, cycle time, delay buffer, and number of lot size at the workstation. Aside from that, the waste in the production line will be analysed based on a validated simulation model. Moreover, warm up situations must be brought into consideration during the simulation model run to ensure the simulation model mimics the actual VSM atmosphere in production line flow.
1.5 Report Structure
The study is executed for the completion of Final Year Project One to show a better flow of what the report which defined in Table 1.1. It is indicated a summary of the chapters available in the study.
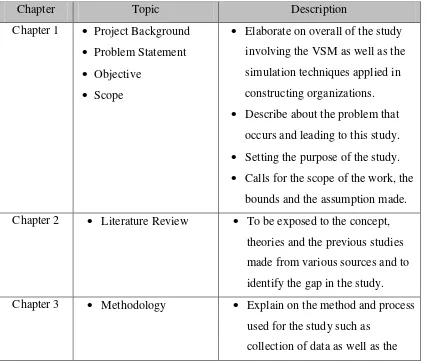
Table 1.1 Organization of the report
Chapter Topic Description
Chapter 1 • Project Background • Problem Statement • Objective
• Scope
• Elaborate on overall of the study involving the VSM as well as the simulation techniques applied in constructing organizations. • Describe about the problem that
occurs and leading to this study. • Setting the purpose of the study. • Calls for the scope of the work, the
bounds and the assumption made. Chapter 2 • Literature Review • To be exposed to the concept,
theories and the previous studies made from various sources and to identify the gap in the study. Chapter 3 • Methodology • Explain on the method and process
used for the study such as collection of data as well as the
steps involved in developing a simulation model.
Chapter 4 • Result and Discussion • Describes the systematic steps used in preparing the simulation model for the study.
• Highlights the crucial point in the simulation model development, including the conceptual
modelling, important data collected and building the base models of the subject area. • Provides the result of the study
and the simulation runs of the model development.
• Discussed on the waste area, the development the initial models using WITNESS simulation software, the experiment runs as well as the recommendation for improvement based on the simulation models.
Chapter 5 • Conclusion and Recommendation
• Consist of the overall description mainly on the achievement of the objectives of the study, the recommendation for future work as well as the important lesson learnt from the simulation study.
In this chapter, the literature review explores the dominant themes consist of the studies as well as research from various published materials. The materials, namely journals, articles, books and online resources are used as guidance for the next phase of the project. Furthermore, this chapter also includes some discussion of the gaps that have been identified in the existing literature and the details briefly elaborated to support the study. Specifically, this chapter will cover the areas that are in relation with lean manufacturing and value stream mapping, the principles and phase involved. This indeed is an effectual mode of carrying on the study on what has been made out and what has yet to be done regarding the area of research is on.
2.1 The Definition of Lean in Manufacture Industry
General understanding of a manufacturing system as a combination of production factors, including typical input factors such as raw and ancillary materials, semi-finished products, information, energy and space every bit well as typical output, e.g. products, parts and waste has been anchored in people’s head with the aid of different perspectives on manufacturing. Fabrication is a chief element in the prosperity of nations and an indispensable root of the introduction and growth. To ascertain the competitiveness of manufacturing industry, manufacturing plants has always asked to adjust to fresh challenges and trends, resulting in various varieties of manufacturing paradigms over the last two centuries. Today’s and future manufacturing plants also face several evolving trends like customers demanding for
LITERATURE REVIEW
CHAPTER 2
highly personalized products, the necessity for an eco-friendly production, reducing its environmental impacts, an increasing importance of societal aspects including the essentials of production-related learning, a still lasting technology push regarding ICT as well as the need for an improved integration of manufacturing plants in their spatial context.
Also, according to Merriam (2008), manufacturing is defined as the human activity or process producing something made from cutting materials by hand or by machinery. The word manufacturing is derived from Latin-Manu-factors, meaning fixed by hand. The word manufacture first appeared in 1567 and the word manufacturing appeared in 1683. The word product means something that is created and the word product and production appeared sometime during the 15th C. Those saying manufacturing and generation frequently all the need aid utilized interchangeableness. Moreover, manufacturing likewise characterized similarly as process make (wares alternately other products) eventually by hand, by machinery, alternately by other means; as, with assembling cloth, nails, glass, and so along. Furthermore, manufacturing will be characterized similarly as work, crude alternately mostly created materials, under suitableness structures for utilizing; as, to manufacture wool, cotton, silk, or Fe. Granting to the Business Dictionary (2008), manufacturing defined as a process to make product with tools or machines by affecting chemical, mechanical, merely the physical translation of materials, substances, gold components, simply by simulating natural processes, usually repeatedly and one has broad scale with has division of labour. Manufacture is includes all steps necessary to convert raw materials, components, or parts into finished goods that conform to a customer's expectations or specifications. Manufacturing commonly employs a man-machine setup with division of labour in a large scale production.
Japanese manufacturers were faced up with the subject of immense deficiencies of material, monetary and human assets after the World War II. These conditions brought about the creation of the ‘Lean’ fabricating ideas (Womack et al. 1990). Keeping in mind the end goal to establish a movement towards change and stay aggressive against their American automakers, Japanese pioneer, for example, Toyoda Kichiro, Shigeo Shinyo and Taichi Ohno concocted another, taught and
methodology situated framework, which is referred to today as ‘Toyota Production System (TPS)’ or ‘Lean Manufacturing’. The crucial reason of the onward motion of this fabric is to minimize the utilization of assets that increase the value of an item. The construction of ‘lean’ alludes to an accumulation of standards and procedures that concentrate on the recognizable proof and end of non-esteem included action included in rendering an item or conveying an administration to clients (Womack et al. 1990). Liqueur and Wu (2000) characterize ‘incline' as a logic of assembling that concentrates on conveying the most elevated quality item at the least cost and on time. When all is said in completing term, lean manufacturing is characterized as an operation that perceives the waste in a production line and take out the recognized squanders through a deliberate methodology which utilizing the lean tools and techniques.
As a matter of fact, involved in the study with the work study tools where create values in goods and services form by illustrating the input and output parameters of the study (Render, 2009). The snap of the whole production of safety pins process flow in production line of cloth manufacturing industry will be on the podium to lead the task and achieved the target.
2.1.1 Lean Principle
To accomplish incline flawlessness, there are five most essential lean standards to be observed in making lean association. This is included in the procedures to enhance and transform it with consistent change done and with waste disposed of along the stream process flawlessness is a definitive remunerate that organizations can gain. In the book of Lean Thinking by Womack and Jones (2003), there are five key lean standards in ensuring the achievement of lean implementation which are identify value, map the value stream, create flow, establish pull and the perfection as shown in Figure 2.1.