(Case Study of Liukang Tupabbiring Sub District, Pangkajene Kepulauan District)
AHMAD MAULIDDIN
GRADUATE SCHOOL
BOGOR AGRICULTURAL UNIVERSITY
BOGOR
I am Ahmad Mauliddin stated that this thesis emitted:
Web Based Decision Support System for Monitoring Coral Reef Management
(Case Study of Liukang Tupabbiring Sub District, Pangkajene Kepulauan District)
Is the result of my own works during the period of March 2011 to September 2011 and it has not been published before. The contents of the thesis have been examined by the advisory committee and an external examiner.
Bogor, September 2011
Scientific study result is the primary information on coral reef condition and a decision-making management tool. Performance evaluation of coral reef management needs to be based on an update (actual) and open access information in order to help decision maker to provide appropriate programs. Management of coral reef is implemented with several evaluation criteria formulated with parameters and variables in management activity aspects. DSS is one of the tools and methods for management decision. In conjunction with the coastal space, the tools can use Spatial Decision Support System (SDSS) as a comprehensive decision support integrated with Geographical Information System (GIS). This SDSS provided effective decision making process that can handle spatial and non spatial database. Using the internet will make it easier for all components in coral reef management in monitoring the condition of coral reefs. Within decision support system, all variables in coral reef management will be managed through data processing methods to produce several recommendations that perform and help decision maker to find the state of management performance. The objective of the research are; to develop database system for inventorying coral reef and socio-economic aspect; to develop a web GIS that can be used by decision makers to identify the state of reef management through the internet access; to develop prototype decision support system tool called Coral Reef Management Evaluation System (CRES). A prototype of database system has been developed to be able to visualize monitoring of coral reef data. Prototype of Web GIS has been implemented to utilize coral reef management become important input for decision maker for monitoring coral reef. Prototype of the DSS tool is capable to provide recommendation for monitoring coral reef management.
terumbu karang dan alat pengambilan keputusan. Evaluasi kinerja pengelolaan terumbu karang perlu didasarkan pada pembaruan data dan akses informasi terbuka dalam rangka membantu pengambil keputusan untuk melaksanakan program yang sesuai. Pengelolaan terumbu karang diimplementasikan dengan beberapa kriteria evaluasi yang dirumuskan dengan parameter dan variabel dalam kegiatan pengelolaan. DSS adalah salah satu alat dan metode untuk pengambilan keputusan pengelolaan. Dalam hubungannya dengan ruang pesisir, dapat menggunakan Spatial Decision Support System (SDSS) sebagai pendukung keputusan komprehensif yang terintegrasi dengan Sistem Informasi Geografis (GIS). SDSS dapat menyediakan proses pengambilan keputusan yang efektif yang dapat menangani database spasial dan non spasial. Menggunakan internet akan memudahkan semua komponen dalam pengelolaan terumbu karang dalam rangka memantau kondisi terumbu karang. Dalam sistem pendukung keputusan, semua variabel dalam pengelolaan terumbu karang akan dikelola melalui metode pengolahan data untuk menghasilkan beberapa rekomendasi yang membantu pengambil keputusan setelah menemukan kinerja manajemen. Tujuan dari penelitian ini adalah, untuk mengembangkan sistem database untuk inventarisasi kondisi terumbu karang dan aspek sosial-ekonomi, untuk mengembangkan web GIS yang dapat digunakan oleh pengambil keputusan untuk mengidentifikasi keadaan pengelolaan terumbu karang melalui akses internet, untuk mengembangkan prototipe alat dukungan keputusan disebut Sistem Evaluasi Manajemen Terumbu Karang (CRES). Sebuah prototipe dari sistem database telah dikembangkan untuk dapat memvisualisasikan data pemantauan terumbu karang. Prototipe GIS Web telah diterapkan untuk memanfaatkan pengelolaan terumbu karang menjadi masukan penting bagi pengambil keputusan untuk memantau terumbu karang. Prototipe alat DSS adalah mampu menyediakan rekomendasi untuk manajemen pemantauan terumbu karang.
Monitoring Coral Reef Managementn (Case Study: Liukang Tupabbiring Sub District, Pangkajene Kepulauan District). Under supervision of Setyo Pertiwi and Neviaty P. Zamani.
Coral reefs are composed from various connected habitats which live together in the surface of ocean bottom to water column. Scientific monitoring is the primary source of information on coral reef condition and a decision-making management tool.
Management of coral reef is implemented with several evaluation criteria formulated with parameters and variables in management activity aspects. Performance evaluation of coral reef management needs to be based on update (actual) and open access information in order to help decision maker to provide appropriate programs. Within decision support system, all variables in coral reef management will be managed through data processing methods to produce several recommendations that perform and help decision maker to find the state of System (SDSS) as a comprehensive decision support integrated with Geographical Information System (GIS). This SDSS provided effective decision that can handle spatial and non spatial database. The system allows the spatial and non spatial dataset organization, analysis and transformation for obtaining the required information.
The objective of the research are; to develop database system for inventorying ecological and socioeconomics aspect; to develop a web GIS that can be used by decision makers to identify the state of reef management through the internet access; to develop prototype decision support system tool called Coral Reef Management Evaluation System (CRES).
The criteria of coral reef management are coral reef condition, water quality condition, environment condition, demography, livelihood, institutional, fishing gear and coverage of coral reefs. These criteria based on literature and the availability data. Scoring and weighting system was applied for assessing performance of management. Decision of weighting value based on the importance of factor for coral reef management. Value of weighting is give by expert team which has capabilities and experience in coral reef management. DSS tool analysis to be use in determining the level of state management is a multi-criteria analysis with defined multi-criteria and indicators. This tool will be built on website based systems.
involves several steps: (1) Analysis, (2) Design, (3) Construction/Implementation, (4) Maintenance. All these phases are cascaded to each other so that the second phase they will started and when set of goals defined are achieved for first phase then they will be it is signed off.
The first step is to understand the requirements of developing DSS including problem identification; user will need analysis, data collecting and data preparation. Preliminary analysis was conducted to identify the problems of coral reefs management. There are lot of research data about coral reefs condition. Data presented mostly of in written report. There are difficulties in using these data for the management process, especially in observing changes of the coral reefs condition, so that appropriate programs will be hard to be chosen. The requirement analysis involves district officer as the target users of DSS. Analysis of user needs was carried out by direct interviews towards several parties including district staff, academics and NGOs. The results of interviews will then draft to a list of requirement by the stakeholders.
Spatial data such as topographical maps, satellite imagery and digitization of maps are collected from several sources. A topographic map in digital format is easier to manage because it has a standard, so can be instantly used. Maps derived from satellite imagery and digitized maps hardcopy is necessary more steps to be a spatial data such as topographic maps.
The main factor in determining coral reef condition is a percentage of life coral as this also standard of rating the coral condition according to Ministry of Environment Decree No. 4, Year 2001 on Standard Criteria of Coral State. Water Quality data is according to Ministry of Environment Decree No. 51, Year 2004 on Standard Criteria of Water Quality for Marine Biota.
Estimation of seabed coverage is obtained from coverage classification of Landsat satellite image by combining Band 321 to differentiate island/land with coral reef area. In monitoring trend of coverage dynamic, time series analysis has been conducted using Landsat image from year 2000, 2005, and 2010. Result from this analysis is expected to give comparation of coral reef coverage in study location from time to time as also compared with field measurement according with collected data in the field. Image classification analyzed just focusing on coral coverage only without considering the other substrate type of the sea bed.
Socio-economy data collected are quantitative data which referred to average income of respondents working in the fishing and other sectors. These data have been inputted into database to be compared with the initial data. Other socio-economic factors that have become focus of attention are demography and people density, occupation related with coral reef. Fishing catching tools and quantity of fish catch are also used in analyzing the relation between coral and catching tools used by the people.
Preparation of data was done after all the necessary data components have been collected. They are managed in to the system database for later introduction into the DSS. This database system is managed by using the software PostGreSQL and PostGIS. For the satellite image data, after the bottom cover classification process it is converted into vector data with a database connected to the PostGreSQL.
A set of alternative strategies/recommendations was formulated which refers to the effectivenes of previous programs on coral reef management. This will be the output of the system after the evaluation process.
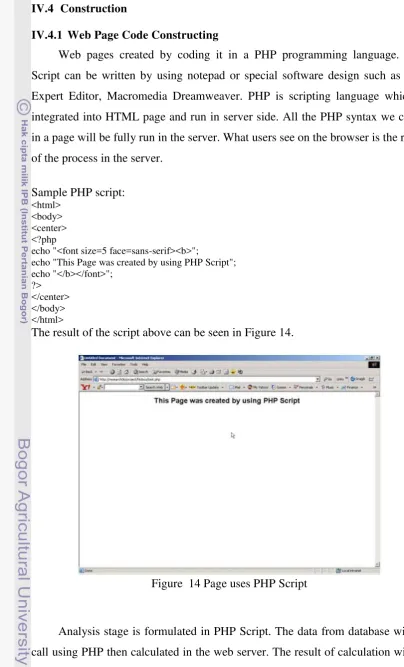
Web pages were created by coding it in a PHP programming language. PHP is scripting language which is integrated into HTML page and run in server side. PHP Script can be written by using notepad or special software design such as PHP Expert Editor, Macromedia Dreamweaver MX 2004. All the PHP syntax we coded in a page will be fully run in the server. What users see on the browser is the result of the process in the server.
Testing was done by using one personal computer which will act as the server and workstation. In order to access the web, Apache server should be installed in the operating system. Testing results indicate that the system has worked well as it is intended to perform.
As the result, a prototype of database system has been developed to be able to visualize monitoring of coral reef data. Prototype of Web GIS has been implemented to utilize coral reef management become important input for decision maker for monitoring coral reef. Prototype of the DSS tool is capable to provide recommendation for monitoring coral reef management.
Copyright @2011, Bogor Agricultural University
Copyright are protected by law,
1. It is prohibited to cite all of part of this thesis without referring to and mentioning the source:
a. Citation only permitted for the sake of education, research, scientific writing, report writing, critical writing or reviewing scientific problem. b. Citation does not inflict the name and honor of Bogor Agricultural
University.
(Case Study of Liukang Tupabbiring Sub District, Pangkajene Kepulauan District)
AHMAD MAULIDDIN
A thesis submitted for the Degree of Master of Science in Information Technology for Natural Resources Management Program Study
GRADUATE SCHOOL
BOGOR AGRICULTURAL UNIVERSITY
BOGOR
Tupabbiring Sub District, Pangkajene Kepulauan District) Student Name : Ahmad Mauliddin
Student ID : G051070011
Study Program : Master of Science in Information Technology for Natural Resources Management
Approved by, Advisory Board
Dr. Ir. Setyo Pertiwi, M.Agr Dr. Ir. Neviaty P. Zamani, M.Sc
Supervisor Co-Supervisor
Endorsed by,
Program Coordinator, Dean of the Graduate School
Dr. Ir. Hartrisari Hardjomidjojo, DEA Dr. Ir. Dahrul Syah, M.Sc.Agr
Date of Examination: Date of Graduation:
mercies to me so far. I want to thank my supervisor Dr. Ir. Setyo Pertiwi, M. Agr and my co-supervisor Dr. Ir. Neviaty P. Zamani, M. Sc for guidance, suggestions, comments, encouragement and constructive criticism during my research supervision through all the months until the study is completed.
I highly like to express my highest gratitude to beloved my parents Ibrahim Tahir and Hj. St. Aisyah Mansur that their love is never end, assistance and moral support has been tremendous brought me to this point. Also all to my brother and sisters for their care and support
I also want to thank and give an appreciation to MIT Class 2007 for togetherness, support, and enlightenment with all this, how we support each other during the study until the last semester of our research. This is really a great gift and privilege for me to find great people with different backgrounds and expertise as you. I want to thank you also to Chairman Program Dr.Ir. Hartrisari Hardjomidjojo, DEA and the staff of the Master of Science in Information Technology for Natural Resource Management (MIT) for good cooperation and facilities, special thanks also to the MIT Lecturers to share their knowledge and experience.
A big thank you also goes to:
1. Staff Center for Coral Reef Research (CCRR) Hasanuddin University, special thanks to Dr. Rijal Idrus, MSc, Ir. Dewi Yanuarita, MSc, and Nurliah Buhari, S.Pi, MSi, for his help to the author that this thesis can be resolved.
2. Prof. Dr. Ir. Chair Rani, M.Si and Dr. Nurjannah Nurdin, M.Si for the advice
and constructive input to preparation of this thesis.
3. All my friends at Marine Conservation Foundation, and especially Andi Muhammad Ibrahim, ST, M.Sc, Muh. Ikhsan A, ST, MT for all the suggestions and discussion time.
Indonesia on March 25, 1975. He spent most of his childhood and school from elementary to university in Makassar. He achieved a bachelor's degree from the University of Hasanuddin, Makassar in the Faculty of Marine Sciences. Since 2000 has been active in Marine Conservation Foundation in Makassar.
STATEMENT ... i
LIST OF APPENDIX ... xxiii
I INTRODUCTION ... 1
I.1 Background ... 1
I.2 Scope of Research ... 2
I.3 Objective ... 2
II LITERATURE REVIEW ... 5
II.1 Web Geographic Information Systems (WebGIS) ... 5
II.2 Decision Support System ... 5
II.2.1 Multi-criteria Decision Analysis (MCDA) ... 6
II.2.2 Ranking and Rating ... 8
II.3 Database Management System ... 9
II.3.1 Storage ... 10
II.3.2 Retrieval ... 10
II.3.3 Control ... 10
II.4 Monitoring Coral reef ... 11
II.4.1 Monitoring with Remote Sensing Data ... 11
II.4.2 Socio-economic Condition ... 13
II.4.3 Coral Reef Condition ... 15
II.4.4 Decision Support to Monitoring Coral Reefs ... 16
III METHODOLOGY ... 19
III.1 Time and Location of the Research ... 19
III.2 Data and Research Materials ... 19
III.3 Hardware and Software ... 19
III.4 Methods ... 21
III.4.1 Requirements Analysis ... 21
III.4.2 System Design ... 24
III.5 Decision Model ... 26
III.6 Data Collection ... 30
III.6.1 Data of Coral Reef Condition ... 30
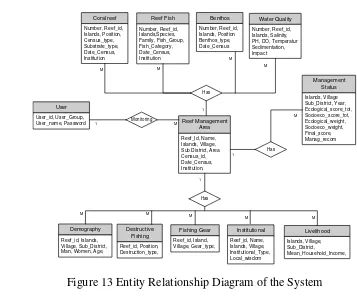
III.7 Limitation ... 33 IV RESULT AND DISCUSSION ... 35 IV.1 General Information on Study Area ... 35 IV.2 Requirement Analysis ... 36 IV.2.1 User Need Analysis ... 36 IV.2.2 The Data ... 36 IV.2.3 Data Preparation ... 38 IV.3 Decision Support System Design ... 39 IV.3.1 Process Modeling ... 39 IV.3.2 Conceptual Modeling ... 40 IV.3.3 Logical Modeling ... 41 IV.3.4 Physical Design ... 41 IV.3.5 Databases ... 42 IV.3.6 Analysis ... 42 IV.4 Construction ... 43 IV.4.1 Web Page Code Constructing ... 43 IV.4.2 Testing ... 48 IV.5 Implementation ... 49 IV.6 System Advantage ... 49 V CONCLUSION AND RECOMMENDATION ... 51 V.1 Conclusions ... 51 V.2 Recommendations ... 51 REFERENCES ... 53
LIST OF FIGURE
Figure 1 Figure application of MCA Techniques to the Selection and Scoring of Criteria and Indicator (Mendoza, G. A., 1999) ... 9 Figure 2 Cross Section Through a Coral Reef Showing the Major Zones
(Jos Hill at al., 2004) ... 13
Figure 3 The ICM Policy Cycle. (Ehler, 2003) ... 16 Figure 4 Structure of the Coral Decision Support System (Ruitenbeek et
al., 2000) ... 18
Figure 5 Location of Spermonde Islands (DFW Indonesia, 2003) ... 20 Figure 6 General Research Scheme ... 22 Figure 7 Framework of the Research... 23 Figure 8 System Proposed for Coral Reef Management ... 24 Figure 9 Design of system architecture of the Coral Reefs Evaluation
System (CRES) ... 25 Figure 10 Structure of Decision Model for Coral Reef Management ... 26 Figure 11 Context Diagram of the System ... 39 Figure 12 Data Flow Diagram of the System ... 40 Figure 13 Entity Relationship Diagram of the System ... 41 Figure 14 Page uses PHP Script ... 43 Figure 15 Display of Spatial Mapping and Zoom in Location of Study ... 45 Figure 16 Form to Input a New Data of Coral Reef Condition ... 45 Figure 17 Add New Data Socio-economic ... 46 Figure 18 Coral Reef Comparison Area ... 46 Figure 19 Page of comparison coral reef area by villages ... 47 Figure 20 Page of Report of Coral Condition ... 47 Figure 21 Page of Report Analysis of Total Score of Each Criteria ... 48
LIST OF TABLE
Table 1 Regular Ranking Value... 9 Table 2 Matching Management Problems on Coral Reefs to the
Available Toolbox (Jos Hill, 2004). ... 17 Table 3 Category and Scoring for Each Variable ... 27 Table 4 Weighting of Evaluation Parameters by Experts ... 28 Table 5 Range of Scores Indicating Performance of Coral Reef
Management ... 29 Table 6 Matrix Recommendation Program for Coral Reef Management ... 30 Table 7 Table Logical Data Model ... 42
LIST OF APPENDIX
Appendix 1 Strategy and Action Plan for coral reef management ... 57 Appendix 2 Physical Design of the system ... 60 Appendix 3 Database structure on PostgreSQL ... 62 Appendix 4 Weight analysis for determine status of coral reef
management and appropriate program recommendations
for sample site (village Mattiro Bombang) ... 63
I.1 Background
The coral reefs are composed from various connected habitats which live together in the surface of ocean bottom to water column. Scientific monitoring is the primary source of information on coral reef condition and a decision-making management tool (Tissot at al., 2002).
Management of coral reef is implemented with several evaluation criteria formulated with parameters and variables in management activity aspects. Performance evaluation of coral reef management needs to be based on update (actual) and open access information in order to help decision maker to provide appropriate programs. Within decision support system, all variables in coral reef management will be managed through data processing methods to produce several recommendations that perform and help decision maker to find the state of management performance.
Management of coastal area is the complex problem. Policy makers need tools that can integrate coastal area resources data, so that appropriate decisions which based on valid data can be made. One tool and method used is DSS. In conjunction with the coastal space, the tools can use Spatial Decision Support System (SDSS) as a comprehensive decision support that integrated with Geographical Information System (GIS). This SDSS provided effective decision that can handle spatial and non spatial database. The system allows the spatial and non spatial dataset organization, analysis and transformation for obtaining the required information.
Generally, spatial decisions making has a meaning as “closed” process with limited parameter input to get a better output. Nowadays some spatial decisions, have been made by people as a planner who work for government with less real specification, while it is claimed that the decision reflects public needs and also claimed as public opinion (Malczewski, 1999).
Implementation of coral reefs management requires open access data, because of the community as important part which directly involved in the management of coral reefs. All stakeholders in coral reef management should share data and information to build a good system in the management of coral reef. The policy makers also require data sharing and information from all stakeholders involved in coral reef management. Therefore the role of the internet is important as the bridge between decision-makers with other stakeholders. Internet became an option because of its easy and cheap.
I.2 Scope of Research
Management and conservation of coral reef ecosystems is a long-term program that requires time to return or close to the initial condition. To achieve the use of coral reef in Indonesia, there are two dominant aspects that must be considered; those are coral reef condition and socio-economic condition.
Percentage of live coral cover is one of the important indicators in coral reef management. Socio-economic conditions can also be a sign the sustainable for management of coral reefs. Those two aspects are the basis of this research for designing a tool for policy making. The tools are planned to be constructed by using the internet media and they are expected to help decision makers at local level. Also can use for monitoring and evaluation of performance management at local/regional level.
The research sample area is sub district of Liukang Tupabbiring, Pangkajene Kepulauan district, which will be focused on coral reef management area based on the village level.
I.3 Objective
The objective of this research will be divided into three, those are:
1. To develop database system for inventorying Coral reef and socio-economic aspects.
2. To develop a webGIS system that can be used by decision makers to identify the state of reef management through the internet access.
II.1 Web Geographic Information Systems (WebGIS)
A geographic information system (GIS) integrates hardware, software and data for capturing, managing, and displaying all forms of geographically referenced information. GIS allows us to view, understand, question, interpret, and visualize data in many ways that reveal relationship, patterns, and trends in the form of the maps, globes, reports and charts. A GIS helps you answer question and solve problem by locking at your data in a way that is quickly understood and easily shared (ESRI, 2000).
Much recent attention has focused on developing GIS functionality in the internet, Worldwide Web, and private intranets and is sometimes termed in Web GIS. Internet users will be able to access GIS applications from their browsers without purchasing proprietary GIS software. Web GIS will make it possible to add GIS functionality to a wide range of network-based application in business, government, and education. The challenge of Web GIS lies in creating software systems that are platform independent and run on open TCP/IP-based network, that is on any computer capable of connecting to the internet (or any TCP/IP-based network) and running a web browser (Foote and Kirvan, 1997).
II.2 Decision Support System
Decision support system (DSS) is an interactive, flexible, and adaptable Computer Based Information System (CBIS), specially developed for supporting the solution of a particular management problem for improved decision making. Decision making is a process of choosing among alternative courses of action for the purpose of achieving a goal or goals (Efraim Turban, 1993). A decision support system (DSS) is a computer-based system that helps the decision maker utilizes data and model to solve unstructured problems (Ralph H. Sprague at al., 1982).
development of SDSS has been associated with the need to expand the Geographic Information System (GIS) capabilities for tackling complex, ill-defined, spatial decision problems (Densham at al., 1989).
Similar to DSS, SDSS is composed of several software components which are the Data Base Management System (DBMS) with containing the functions to manage the geographic data base, the Model Base Management System (MBMS) with containing the function to manage the model base and the Dialog Generation and Management System (DGMS) with managing the interface between the user interface with display and report forms and the rest of the system or Graphical User Interface (GUI).
The decision making process adopted to solve semi-structured spatial problems is often perceived as unsatisfactory by decision makers. (Densham, 1991) list the distinguishing capabilities and function of SDSS, which should be capable of providing mechanisms for the input of spatial data, allowing representation of the spatial relations and structures, including the analytical techniques of spatial and geographical analysis and providing output in a variety of spatial forms, including maps.
II.2.1 Multi-criteria Decision Analysis (MCDA)
MCDA is a discipline knowledge that aimed at supporting decision makers who are faced with making numerous and conflicting criteria evaluations. MCDA aims at highlighting these conflicts and deriving a way to come to a compromise in a transparent process. MCDA help the decision makers in the territory management, several actors have shown the adequacy of the association of the geographical information systems (GIS) and the multi criteria decision aid (MCDA) methods.
The general objective of MCDA is to assist a decision maker or a group of decision about the problems they face to choose the best alternative from a range of alternatives in an environment of conflicting and competing criteria such in the way the idea of multiple criteria is considered, using computation of weights and scoring with the mathematical algorithm, the model to describe the system of preferences of the individual facing decision-making. The MCDA technique selected will typically need to (Andrea De Monti at al., 2000):
• Deal with complex situations (criteria), consider different scales and aspects (geographical scales, micro-macro-link), social/technical issues and type of data (uncertainties)
• Involve more than one decision maker (stakeholder participation, actors, communication, and transparency)
• Inform stakeholders in order to increase their knowledge and change their opinion and behavior (problem structuring, tool for learning, transparency)
The MCDA component consists of a collection preference structure modeling techniques and associated in multi-criteria decision models. The preference modeling techniques might include with criterion weighting techniques and method as well as the methodology for generating the hierarchical value structure of evaluation criteria, with these MCDA overcomes the limitations of less structured methods, basic methods can be used to reduce complex problems to a singular basis for selection of a preferred alternative. In some methodologies when decide to use MCDA are similar steps of organization and decision matrix construction. In another perspective different methods require diverse types of value information and using some many algorithms. Several techniques use rank options, with indicate some identify and a single maximum alternative, and others differentiate between acceptable and unacceptable alternatives (Malczewski, 1999).
methods is best suited for a one-decision problem with several alternatives and criteria.
In associate with GIS and MCDA method is not only to set the spatial reference information that is required, but also to implement new methods of analysis that allows information to get the most relevant and most appropriate solutions in the search for necessary information. However, most of the MCDA problem does not only consider quantitative criteria, but also qualitative, to make some analysis and the appropriate criteria, which makes the problem becomes complex and difficult to use as decision and analysis.
II.2.2 Ranking and Rating
There are two simple techniques that MCA utilises to identify and select relevant Criteria & Indicator are Ranking and Rating. Ranking involves assigning each decision element a rank that reflects its perceived degree of importance relative to the decision being made. The decision elements can then be ordered according to their rank (first, second etc.). Rating is similar to ranking, except that
the decision elements are assigned „scores‟ between 0 and 100. The scores for all
elements being compared must add up to 100. Thus, to score one element high means that a different element must be scored lower (Mendoza, G. A., 1999). There are three general steps in Criteria and Indicators (C&I) assessment. Multi criteria analysis (MCA) has specific application as a decision making tool in steps 1 and 3.
1. The identification and selection of Criteria and Indicators. 2. The scoring of indicators based on the selected set.
3. The assessment of the system in terms of its overall performance at all levels of the C&I hierarchy.
There are two different ways to rank a set of decision elements, Regular Ranking and Ordinal Ranking. Regular Ranking assigns each element relevant to the
decision process a „rank‟ depending on its perceived importance. Ranks are
Table 1 Regular Ranking Value
Ordinal Ranking is a technique where each expert is asked to put the list of decision elements in order of importance. Unlike regular ranking where different decision elements can be given the same ranking, ordinal ranking forces the experts to put the elements in a hierarchy of importance; each element is deemed more or less important relative to the other elements involved (Mendoza, G. A., 1999).
Initial set of Criterias & Indicators
Ranking and Rating Process
Weighted Set of
Criterias & Indicators Relative Weights Scores Weighted Score Discarded Criterias & Indicators
Figure 1 Figure application of MCA Techniques to the Selection and Scoring of Criteria and Indicator (Mendoza, G. A., 1999)
II.3 Database Management System
the database are stored together with a minimum of redundancy to serve multiple applications, so the database is independent of the computer program that uses it and the type of hardware where it is stored. A database can be defined from several perspectives (Fathansyah, 1999), such as:
- Collection of data group (archives) that related each other, which is organized in such way so that in the future it can be utilized again quickly and easily. - Collection of interrelated data kept together in such a way without unnecessary
redundancy, to fulfill many kinds of needs.
- Collection of files/tables/archives that related each other, kept in electronic storage medium.
DBMS performs three basic functions. It enables storage of data in the database, retrieval of data from the database, and control of the database.
II.3.1 Storage
DBMS varies the configuration of the stored data. Mainframe systems store many large files, each containing many records, each record containing many data items, and the data items containing many characters. The systems for microcomputer offer more constrained capacities because of limited primary and secondary storage spaces. This limitation is becoming less and less factor.
II.3.2 Retrieval
The feature of DBMS most visible to the user is data retrieval. Current DBMS offer great flexibility in terms of how the information is retrieved and displayed. With a sophisticated DBMS, the user can specify certain processing of data and customize the output (e.g., reports or graphs) in terms of heading and spacing.
II.3.3 Control
There are some capabilities of DBMS in DSS (Efraim Turban, 1993) - Captures/extract data for inclusion in a DSS database
- Quickly updates (adds, deletes, changes) data records and files - Interrelates data from different sources
- Quickly retrieves data from a database for queries and reports
- Provides comprehensive data security (protection from unauthorized access, recovery capabilities, etc.)
- Handles personal and unofficial data so that users can experiment with alternative solutions based on their own judgment
- Performs complex retrieval and data manipulation tasks based on queries
-
Tracks usage of data.II.4 Monitoring Coral reef
Managing the coral reef need to balance between sustainability and conservation of coral reefs, therefore the relations between human behavior and reef ecosystems are critical. Reefs condition is strongly influenced by human
activities and environmental conditions in which poverty level contained in the coastal areas and small islands highly dependent on the presence of coastal and marine resources. There are close links how coastal communities in the use of coral reefs and social conditions of its economy.
Due communities are not yet know and understand the importance function of coral reefs. Moreover, many institutions in the national and locally yet have enough data and accurate about the potential and status of coral reefs and other marine resources. Sustainable use and protection of coral reefs, policy makers need to know (GCRMN, 2000):
- Status of coral reefs and changes in the health of coral reef and reef fish. - Condition of the people that use and affect coral reef include the ability to
use, perception of management and characteristics of the people who feel the impact of coral reef.
II.4.1 Monitoring with Remote Sensing Data
sensing technology is one method more practical and efficient because it can cover vast areas and distances (Lehmann at al., 1997, Stoffle at al., 1994).
Satellites collect data from extensive geographical areas in very short periods. These data consist primarily of electronic records of the intensities of electromagnetic radiation reflected or emitted from the earth's surface through the atmosphere to the satellite. Taken repetitively, these data may help identify and monitor changes in the average amount of radiation recorded from analytical units called pixels. However, the satellites can neither interpret what is observed in ecological terms nor explain what has caused the observed changes (Stoffle et al., 1994).
Some combination methods and data analysis model has been carried out to obtain the expected aims using of satellite imagery. This is closely related to the ability of satellite imagery that can provide spatial information in serial and the information contained in coral reefs. Application of the model was performed for determine many marine protected areas and monitoring of coral reefs, and results helpful for management of coral reefs (Scopélitis at al., 2007, Serge Andrefouet, 2006, Wood at al., 2007).
Numerous theoretical studies have been undertaken to obtain a model for extracting bathymetry and substrate information from passive multispectral remotely-sensed data (Jupp D.L.B., 1988, Lyzenga, 1978, Lyzenga, 1981). Simple algorithms have been implemented in an attempt to map the bathymetry, assess water turbidity, and map the type of substrate. Algorithms which have been used successfully in the mapping of the coral reef substrate include band-ratioing and the creation of pseudo-bands from the original spectral bands (Jupp D.L.B., 1988, Jupp, 1985). However, the existence of water turbidity, the effects of the atmosphere on the radiation emerging from the water column, and the mixing of different reef substrates within a given pixel will often limit the effectiveness of many such algorithms.
measurement using visible band and close infra red from Landsat-TM, and (Lyzenga, 1978) made water column correction using seichi-disck transparency (SDT) to show the transparency level of the water with visible band ratio.
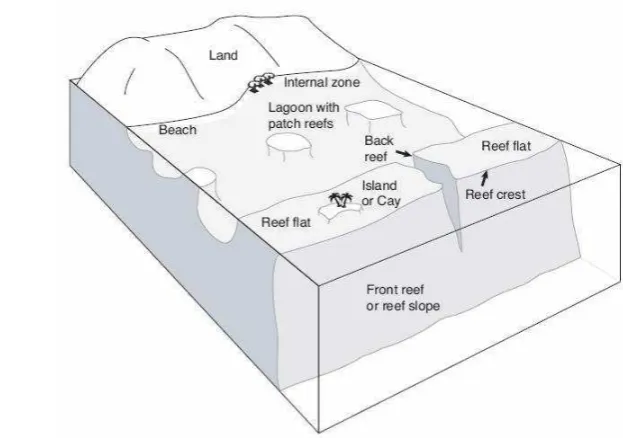
Remote sensing has been touted to provide information on several parameters that are of importance to reef management. Those are coral reef boundaries, may be used for routing planning requirements and locating the boundaries of management zoning schemes, geomorphologic zone of the reef (e.g. reef flat, reef crest, spur and groove zone), ecological component and determination of live-coral cover. Ecological component may be defined in several ways, such as assemblages of coral species, assemblages of major reef-dwelling organisms, or assemblages of species and substrata (Edmund P. Green at al., 2000).
Figure 2 Cross Section Through a Coral Reef Showing the Major Zones (Jos Hill at al., 2004)
II.4.2 Socio-economic Condition
facilities, components for use in market more broadly, outside the market value and which are not used. Understanding socio-economic conditions are important in the inventory, predict and manage coral reefs.
Information on socio-economic provide guidance to stakeholders for (GCRMN, 2000):
- Determine the relevant stakeholder groups, and concerned in the management process. This will increase the legitimacy of that decision making and adherence to rules and regulations become more stringent. - Determine the effects of management decisions to the stakeholders, which
will improve policy decisions to minimize impacts and maximize benefits to stakeholders.
- Shows the value of coral reef resources and services to the general public, stakeholder groups and policy makers, which will generate greater support for coral reef management programs.
The linkage between human activities and coral reef ecosystem is very important. That is because the corals are not only influenced by human activities, but also the livelihoods and welfare of the people living in coastal areas depend on marine resources including coral reef. How humans use and use of coral reef and related ecosystems and social background of its economy. Knowing the socio-economic background of the stakeholders is important to make a prediction and planning management.
In addition to data from the field, a social assessment also requires the collection of secondary data which includes the existing statistical data, research reports already published, various kinds of documentation, various kinds of maps, data and documentation of historical and existing web data. All secondary data are required, among others; to support field data will be collected. In addition, by first collecting data that already exists, not to repeat the same thing ever done by others. Various kinds of secondary data is compiled, reviewed and evaluated.
methods of collecting qualitative data such as maps, historical transect, and Venn diagrams.
Observation is a qualitative description of what researchers see and observe in the study area. Observation is important because by doing observations researchers could quickly find out what community activities related to the utilization of marine resources. Depth interviews were conducted using an interview guide that had been prepared beforehand. By conducting in-depth interviews are the benefits that can be obtained by researchers could delve more deeply into the respondent answers at once to check and re-check the answers in the can. Meanwhile, one of the FGD is a qualitative data collection technique by interviewing approximately four to 10 people who should have the same background. As well as in-depth interviews, FGD is based on interview guides that have been prepared beforehand. Advantages of this technique are able to dig deeper than all of the information also enables the exchange of information through the interaction between them. Survey were conducted with structured questionnaires that had been prepared this questionnaire is usually designed with answers that are already available (choose) or filled with short answers (COREMAP LIPI, 2002).
II.4.3 Coral Reef Condition
The aim of any coral reef ecosystem assessment program is to distinguish relevant biological signals from caused by natural spatial and temporal variations. In choosing biological indicators, one should focus on attributes that are sensitive to the underlying condition of interest (e.g., human influences) but insensitive to extraneous conditions. Faced with the dizzying number of variables, disturbances, endpoints, and processes, marine managers and researchers have periodically failed to choose those attributes that give the clearest signals of human impact (Ruitenbeek at al., 2000).
of the change, and communicating these finding to policy maker and citizen are the tasks of biological monitoring programs (Ruitenbeek at al., 2000).
Several way and methods have been introduced by the experts to conduct an inventory of coral reefs including Line Intercept Transect (LIT) (English at al., 1997), Reef Rapid Assessment (RRA), Manta tow and Reef Check (COREMAP LIPI, 2002, Hodgson et al., 2004).
II.4.4 Decision Support to Monitoring Coral Reefs
As a policy maker, government has an important role in any integrated management process (figure 3). It is also implemented in an integrated coastal management (ICM). Greater emphasis on performance can help make ICM more oriented toward outcome-based results rather than on input-based accounting. Too often, the performance of ICM initiatives has been based on the level of investments, the number of permits issued for coastal development, or the number of laws and regulations adopted. These „„input‟‟ measures may or may not be indicative of success. Actual success in both environmental and socio-economic terms can only be judged „„on the ground‟‟, as a matter of outcomes and impacts. Outcomes should be measured in terms of improved water quality, increased public access to beaches, decreased habitat loss, reduced coastal hazards, or increased employment in coastal related activities (Ehler, 2003).
Figure 3 The ICM Policy Cycle. (Ehler, 2003)
In an evaluation of performance management the government requires tools that can be used for understanding of coral reefs management. Tables 2 provide causes and consequences of environmental change on coral reef.
Table 2Matching Management Problems on Coral Reefs to the Available Toolbox (Jos Hill, 2004).
Documented problem and cause Expected consequences Management tools
Global
Ocean acidification (rising carbon dioxide concentration facilitate coral recovery by managing herbivores and water quality (RECOVERYb)c
Coral bleaching ↓ disease in calcifying organism;
↓ redu ed oral-based services a Low fisheries yield (overfishing) ↑ E o o i hardship for fisheries;
↓ iodi ersit a d e os ste fu tio ↓Fishi g effort EFFORT ; MRs; ↓loss of a gro e urser ha itats; ↑alter ati e li elihoods; ↓i ter atio al e port of reef
fishes Local
Crown-of-thorns starfish outbreaks (agricultural runoff and/or fishing of predators)
↓ Redu ed oral-based services a Watershed management (WATER)b; EFFORT
Algal blooms (fishing of herbivores, eutrophication)
↓ Redu ed oral-based services a;
↓ pu li health
WATER; EFFORT; RECOVERY Rising number and prevalence of diseases
(high physiological stress; nutrient runofff)
↓ Redu ed oral-based services a; NS; WATER; RECOVERY Tropical cyclone damageg Areas of extensive coral mortality; reduce
resilience of reefs locally
NS; RECOVERY Invasive species (release of ballast;
aquarium discharge)
Disease (e.g. loss of Caribbean Diadema); disrupt tropic pathways (e.g. novel predator Pterois volitans in Bahamas)
Enforce and implement controls to ballast water treatment.
↑ a d↓ de ote i reasi g a d de reasi g, respe ti el . Ma age e t tools are des ri ed o e a d gi e a ode i apitals hi h is
used thereafter. MR= marine reserves.
a
Coral-based services include diversity and density of invertebrates and vertebrates (particularly small reef fishes), coastal defence from storms, reduced beach erosion, sediment production, fisheries production, aquarium-trade industry, diving and fishing tourism.
b
RECOVERY includes reduce fishing effort (EFFORT) and watershed management of agrichemicals, sewage and sediment runoff (WATER)
c
Much uncertainty about consequences and efficacy of tools in this context.
d Appropriate design of MRs unknown
e Defences are expensive, and so are restricted to affluent areas f Causative agents and treatments are often unknown g
Only a problem when combined with overfishing and poor watershed management.
The decision support system consists of the following (Ruitenbeek et al., 2000):
- A user interface;
- The computational model in database - The database of model parameters
- The database of information contain in interactive text and graphic file available to the user.
The user definitions (scenario, economic development and environmental protection option) drive the socio-economic model, which results in a set of impacts distributed over the area. These used as input into the ecological response model, which estimates changes in the reef health over the impact areas. The change will affect the health of the reef fisheries, which has a feedback effect on commercial fisheries production. The cost of the environmental protection option and the changes in the reef health are considered in the cost effectiveness analysis.
III.1 Time and Location of the Research
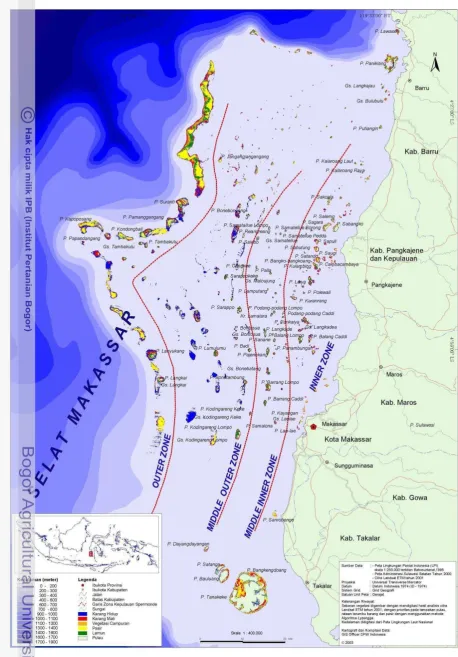
The research was conducted from April to August 2011; the study site is sub district of Liukang Tupabbiring, Pangkajene Kepulauan District, which is part of Spermonde Islands (Figure 5). Spermonde Islands are coral islands which consist of approximately 126 islands. Spermonde Islands or the Sangkarang islands, in number of literatures is described as a collection of islands located in the southern Makassar Strait or on the west side of South Sulawesi peninsula, known as the
Spermonde Shelf, which apart from the Sunda Shelf (Moka, 1995).
Geographically, District Pangkajene Kepulauan located at 118o56.7'E - 119o48.06'E and 5o 9.57'LS - 4o28.856'LS. Some islands in the Spermonde islands are inhabited, even some of them have a very dense population.
III.2 Data and Research Materials
This research using several type data that were used as input for the system to be develop. The data can be divided into two categories: spatial and non spatial data, i.e.
a. Spatial data:
- Vector: administration boundary, coastline, bathymetri, road; taken from RBI Bakosurtanal scale 1:50.000
- Raster: image of Spermonde Islands (Landsat satellite image, acquisition 2000, 2005, 2010); downloaded from USGS
b. Non-spatial data:
- Coral reef condition: coral reef, reef fish, mega benthos, water quality - Socio-economic condition: demography, livelihood, institutional,
destructive fishing, fishing gear.
III.3 Hardware and Software
Development the system has determined selected hardware that can run the program. The system hardware is:
- Personal Computer (PC) dengan AMD Turion II Dual Core 2.3 GHz,
- PC with 20 Giga Bytes (GB) free Hard Disk space, or higher
- SVGA monitor with 1024 X 768 pixels minimum resolution Below are software selected for the system development:
- Software for Database Management: PostgreSQL, PostGIS,
- Scipting Languange: PHP
- Software of GIS: Quantum GIS, GvSIG
- Software of Developing Web GIS: MapServer, Apache, Ka-Map
- Software for constructing web interface and management: Joomla
- Software for Operating System and Client Side: Microsoft Windows XP or
other version above, web browser software.
III.4 Methods
The DSS is developed by prototyping method. This method simplifies and accelerates the steps of system development life cycle (SDLC). The main idea is using GIS web based and decision support system for coral reefs management. SDLC approach is used to ensure the success of the research. SDLC approach commonly called a system development life cycle, involved the following/phases: (1) Analysis, (2) Design, (3) Implementation and (4) Maintenance (Efraim Turban, 1993). All of these phases are cascaded to each other so that second phase is started as and when defined set of goals are achieved for first phase and it is signed off (Figure 6).
III.4.1 Requirements Analysis
Figure 6 General Research Scheme III.4.1.1 Problem Identification
Several data and monitoring of coral reef ecosystems by the institutions has indicated the understanding and awareness of various agencies and public about the importance of coral reef ecosystems function. Implementation of monitoring has been referring to the various scientific methods applied by various research institutions such as LIPI and community-based Reef Check. Based on monitoring, policy makers are expected to be able to formulate appropriate action in the management of coral reefs at the national and local levels. Availability of data, both primary and secondary data from various sources helped the Indonesian authorities at the national or local level on management of coastal zone.
III.4.1.2 User Need Analysis
A number of data and information about the condition of coral reef ecosystems have an impact on decision makers in making plans and policies related to management of coral reefs. Generally, such data is built from a variety of methods and needs. LIPI have Life form methods that focus to the level of detail on types of coral reefs, data on reef fish, substrate type (32 classes) on coral reefs as a standard to follow AIMS (English et al., 1997).
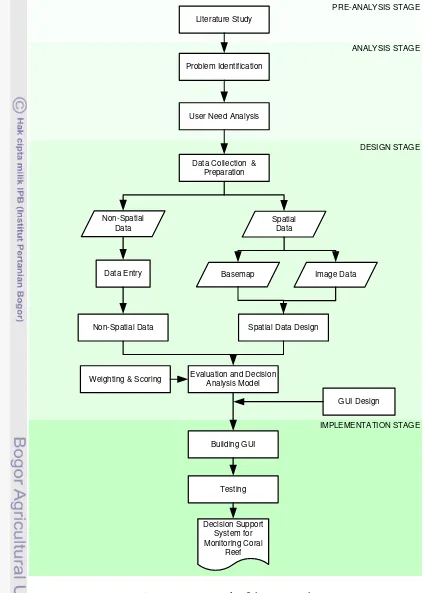
The system will be built based on how to define decision in the management of coral reefs. The structures decisions are planned such as the following Figure 8.
PRE-ANALYSIS STAGE
IMPLEMENTATION STAGE DESIGN STAGE ANALYSIS STAGE Literature Study
Problem Identification
User Need Analysis
Data Collection & Preparation
Non-Spatial Data
Spatial Data
Basemap Image Data
Spatial Data Design Data Entry
Non-Spatial Data
Evaluation and Decision Analysis Model
Building GUI Weighting & Scoring
GUI Design
Testing
Decision Support System for Monitoring Coral
Reef
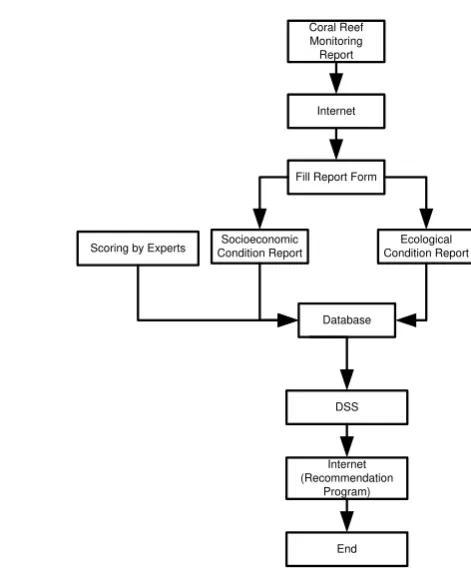
Internet
Fill Report Form
Ecological Condition Report Socioeconomic
Condition Report
Database Scoring by Experts
DSS Internet (Recommendation
Program) End Coral Reef Monitoring Report
Figure 8 System Proposed for Coral Reef Management III.4.1.3 Data Preparation
Preparation of data was done after all the necessary data components have been collected and they are managed into the system database for later introduction into DSS. This database system is by using the software PostGreSQL and PostGIS. For the satellite image data, after the bottom cover classification process it is converted into vector data with a database connected to the PostGreSQL.
III.4.2 System Design
System Design helps in specifying hardware and system requirements and also helps in defining overall system architecture (Figure 9). The system design specifications serve as input for the next phase of the system development. Besides, it specifies build a variety of technical aspects of software development such as functions that are required to the system. The selection of technology will be applied, such as client-server technology, database design, and various other aspects related to the design and analysis.
Client/server architecture allows distributed clients to access a server remotely by using distributed computing techniques. The client side components are usually platform dependent (Zong-Ren Pheng at al., 2003).
A client-server system has one or more client process and one or more server process, and a client process can send a query to any one server process. Thus, a client process could run on a personal computer and send queries to a server running on a mainframe (Ramakrishnan at al., 2000).
Browser Client Web Server –
Map Server PHP
Figure 9 Design of system architecture of the Coral Reefs Evaluation System (CRES)
In figure 7 the dataset, spatial and non – spatial, is analyzed and inputted into GIS database. These spatial datasets are be analyzed by using mathematical modeling and digital maps, then we inputted into RDBMS in Postgis. Postgis can communicate with Quantum GIS or GvSIG database.
There are four steps in the development the web based DSS; software and hardware selection, database design, system design and graphic user interface (GUI) design.
1. Software and Hardware Selection
2. Database Design
The database design can be divided into six steps: (1) Conceptual Database Design, (2) Logical Database Design, (3) Scheme Refinement, (4) Physical Design and (5) Security Design.
3. Graphical User Interface (GUI)
Graphical user interface (GUI) is a type of user interface which allows users to interact with computer devices, to connect visually information system and users. Users utilize GUI to access and run the system applications. GUI contains pages that show about the content of system, help or guidance to utilize the system, button and links to access system. Therefore GUI should be as simple, easy to use, user-friendly, and understandable as possible.
III.5 Decision Model
The decision model is involving two steps, those are step to define the status of coral reef management in certain area/site and step to determine the appropriate program for the area/site based on the result of first step. Analyses of parameters are using multi-criteria analysis with scores and weights.
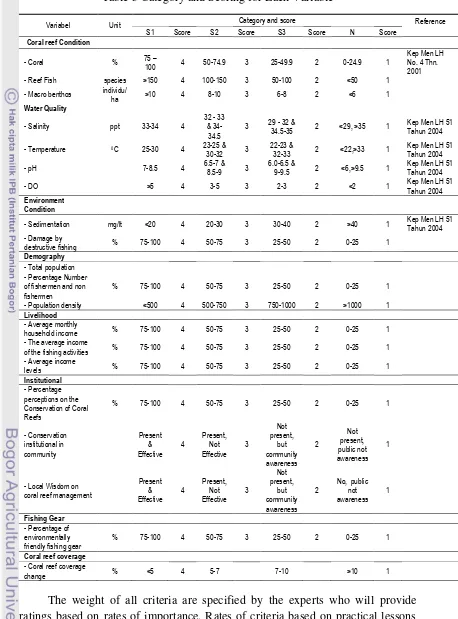
The coral reef management status is determined by some criteria. The criteria‟s are intended to be the indicators and parameters of coral reef management. The criteria in the assessment of coral reefs can be seen in the Figure 10. Category and score of each variable listed on Table 3.
Coral Reef Monitoring
Fishing Demography Institutional Livelihood Fishing Gear
Program
Table 3 Category and Scoring for Each Variable
Variabel Unit Category and score Reference S1 Score S2 Score S3 Score N Score - Macro benthos individu/
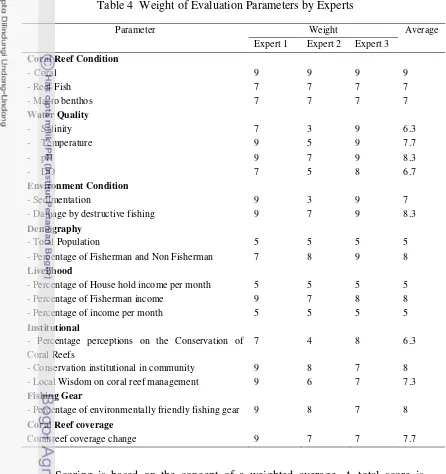
important, 3 as moderately important and 1 as not important. The weights given by the experts can be seen in Table 4.
Table 4 Weight of Evaluation Parameters by Experts
Parameter Weight Average
Where xij is the score of the ith area with respect to the jth attribute, and the weight wjis a normalized weight, so that ∑ wj = 1. (Malczewski, 1999).
Based on total evaluation score, performance of coral reef management is classified into four categories. The ranges of score for each category are shown in Table 5.
Table 5 Range of Scores Indicating Performance of Coral Reef Management
Score Range
Value Performance Description
1 0 – 135 Bad Poor performance; unfavorable; may be the norm for the region, but major improvement needed.
2 136-272 Moderate Acceptable; at or above the norm for good operations in the region.
3 272-408 Good
Very favorable performance; well above the norm for the region, but still needing improvement to be state of the art.
4 409-542 Very Good
„State of the art‟ in region; clearly outstanding
performance which is way above the norm for the region
Achieving some coral reef management required strategies and programs that will be a recommendation. Strategies and programs will influence a direct condition of coral reef ecosystems and communities who benefit directly from the coral reef. Strategies and programs that became a national reference in the management of coral reefs can be seen in the following Appendix 2.
The next stage is to determine of program management in accordance with the conditions at a site. To determine of the appropriate program refers to the weight of coral reef conditions and socioeconomic conditions. The suitability classes of coral reef condition were calculated based on the total maximum scores minus total of minimum scores divided by four classes. The ranges of suitable value for coral reef condition are:
Very Good : 218 - 267
Good : 168 – 217
Moderate : 118 – 167
Bad : 0 – 117
pressure to coral reef condition. So it is classified only into two categories, i.e. High and Low. The ranges score for each category of socioeconomic condition are:
High : 0 – 171
Low : 172 – 273
Based on the score of coral reef conditions and socio-economic conditions, and then constructed several scenarios conditions such on the Table 6.
Table 6 Matrix Recommendation Program for Coral Reef Management Coral reef
condition
Socio-economic condition (pressure)
High Low
Bad - improved utilization
management
- Rehabilitation
Moderate - leave it alone
- increase monitoring with community involvement
- law enforcement consistently
- Leave it alone
- increase monitoring with community involvement
Good - pressure control through law enforcement
- surveillance
Very Good - Increased management surveillance and professional managerial
- Leave it alone and set as Marine Protected Area.
III.6 Data Collection
In this research, data collection is done at the Ministry of Marine Affairs and Fisheries, both national and local levels. Coral reefs condition data is also obtained from government programs such as COREMAP, MCRMP, Mitra Bahari which conducting coral reef research, and also from NGOs at the national and local level. Data in the distribution of coral reefs can be extracted from satellite images extraction which captured by sensors.
III.6.1 Data of Coral Reef Condition
Coral reef assessment was conducted as part of primary data collection through survey and monitoring of coral reefs, such as data:
1) Percent cover of coral reef benthic community;
rolls of rope or 50 m parallel feet along the coastline. All forms of coral growth and biota that lies below of transects are recorded. Large percentage cover of dead coral, live coral, seaweed, and other life form type is calculated by formula (English et al., 1997):
Where:
C = coverage (%)
a = life form length (cm) A = total length of transect (cm)
2) Species and abundance of reef fish (visual census);
The abundance of reef fish species is specified in individu/m2. Data on the fish abundance can be used as a base for the zoning, management and monitoring of coral reefs (English et al., 1997). Reef fish census is used to record the fish target, indicator and major by counting the abundance and diversity. Identification of reef fish types refers to Matsuda at al., (1984), Kuiter, (1992) and Lieske E. at al., (1994). Especially for grouper (grouper) used a reference from Randall, (1991) and Heemstra at al., (1993).
3) The species and abundance of macro benthos;
4) The coral reef ecosystem distribution
At this stage the image processing is used in the transformation of satellite image (Lyzenga, 1978) to sharpen the object feature of coral reef. For the record, the use of medium resolution satellite imagery or course, such as Landsat, can produce only the classification coral reefs based on geomorphologies aspects, not on the Coral reef aspects. Except in cases where there is a stretch of a vast coral reef, this is strongly associated with spatial resolution imagery. To deepen the existing information, mapping of coral reef ecosystems is displayed with a pie chart that shows the condition of coral reef. Moreover, preparation tools to use in field surveys are also included in the preparation stage. In this field survey, collected data on coral reefs, including data about the aquatic environment, which is an attribute of coral reef data.
Water quality parameters are needed as supporting data on general conditions of the water in the region of the islands. Measured parameters are: brightness, currents, temperature, salinity, pH, TSS, dissolved oxygen, nitrate, nitrite, phosphate, and chlorophyll-a. In general, the methods used for the determination and analysis of water quality are a standard method (Parson at al., 1984, Strickland at al., 1968).
III.6.2 Data of Socio-economic Condition
Considering the large number of the island in the research location, hence the choice of location to be observed as samples was done by using the approach planned multilevel methods (purposive stratified sampling method). Factors to be considered in this method are (1) community involvement on coral reef resources, (2) affordability for intervention programs and monitoring (3) the level of success of previous program. Data collection (sampling) was done using random sampling methods to the head of the family. The data collection was done using several approaches:
2. Qualitative approach with in-depth interview method in the form of focus discussion groups (group discussions) to provide responses to questions about the views and perceptions.
3. Rapid Rural Appraisal (RRA) to collect profile information of the island and social system.
III.7 Limitation
IV.1 General Information on Study Area
As its name, Pangkajene Kepulauan District has territories on the mainland of Celebes (Sulawesi) and islands. One of the territories in the islands is Liukang Tupabbiring sub district. Liukang Tupabbiring sub district is covering most of the Spermonde archipelago. Spermonde archipelago is located on the west coast of South Sulawesi (Makassar Straits). The archipelago is spreaded from the north to the south with approximately 300 km of length and area of 16,000 km2. The archipelago has 126 islands which based on administrative boundary consist of five district, i.e. Barru District, Pangkajene Kepulauan District, Maros District, Makassar City and Takalar District (COREMAP CRITC SULSEL, 2002).
Mattiro Bombang Village is one of 15 villages in Liukang Tupabbiring sub district. Mattiro Bombang Village is geographically located 04 20'22 .4 "- 04 43'15 .7" LS and 119 25'42 .6 "- 119 30'35 .3" BT. The village borders to the east is mainland, Barru district in the north, Mattiro Walie village in the west and the Mattiro Baji village in the south. Mattiro Bombang village includes four islands; those are Salemo Island, Sakoala Island, Sabangko Island and Sagara Island. The center of the village is located in pulau Salemo. All islands in the Mattiro Bombang village can be accessed through Limbangan River, within about one hour by traditional ship.
Most of the Fisherman at Mattiro Bombang using nets, fishing hooks and traps. Other works are fish fishpond and sea cucumber collector. The main job for the women in Mattiro Bombang is peeling crab and processing the waste of the crab for animal feed.
IV.2 Requirement Analysis
IV.2.1 User Need Analysis
The first step is to understand the requirements of developing DSS including problem identification, user need analysis, data collecting and data preparation. Preliminary analysis was conducted to identify the problems of coral reefs management. There are a lot of research data about the coral reefs condition. The data is presented in most of a written report. There is difficulty in using these data for the management, especially in seeing changes of the coral reefs condition, so that appropriate programs hard to take.
The requirement analysis involves district officer as the target users of DSS. Analysis of user needs was carried out by direct interviews to several parties including district staff, academics and NGOs. The results of interviews are then drafted to a list of needs required by the stakeholders.
List of the stakeholders are need for information for status of coral reef management and the appropriate program for the coral reef management. Based on the interview result the users who will involve for the CRES are:
District of Marine and Fisheries Office at sub program of conservation program
Ministry of Marine and Fisheries at the Directorate Marine, Coastal and Small Islands
NGO in coordination with local government
IV.2.2 The Data
Collected and analyzed data came from tabular data, satellite images or GIS data. There are 2 data category will using in this research i.e. ecological condition and socio-economic condition.