ISSN 1941-7020
© 2009 Science Publications
Corresponding Author: M. Abdullah, Department of Electrical, Electronic and Systems Engineering, Faculty of Engineering, Universiti Kebangsaan Malaysia, 43600 Bangi, Malaysia
TEC and Scintillation Study of Equatorial Ionosphere: A Month Campaign over
Sipitang and Parit Raja Stations, Malaysia
1,2
M. Abdullah,
2,3A.F.M. Zain,
4Y.H. Ho and
3S. Abdullah
1Department of Electrical, Electronic and Systems Engineering, Faculty of Engineering,
Universiti Kebangsaan Malaysia, 43600 Bangi, Malaysia
2
Institute of Space Science, Universiti Kebangsaan Malaysia, 43600 Bangi, Selangor, Malaysia
3Wireless and Radio Science Centre (WARAS), Universiti Tun Hussien Onn Malaysia,
Batu Pahat, Johor, Malaysia
4
Faculty of Electronics and Computer Engineering, Kolej Universiti Teknikal Kebangsaan Malaysia,
Ayer Keroh, Melaka, Malaysia
Abstract: Problem Statement: Ionospheric scintillations, which cause significant effects on satellite
signals for communication and navigation, often takes place in equatorial region such as Malaysia. However, this disturbance are not fully understand due to few studies performed. This research reports the study and monitoring activity on Total Electron Content (TEC) and ionospheric scintillation in Malaysia using GPS measurements. Approach: One dual-frequency GPS receiver was positioned at the main station in Parit Raja, West Malaysia (1.86° N, 103.8° E) and Sipitang, East Malaysia (5.10° N, 115.56° E) respectively. Dual-frequency GPS data collected during the one-month ionospheric experimental campaign was used for TEC and scintillation computation and analysis. The TEC with 15 sec interval were computed from combined L1 and L2 code-pseudorange and carrier phase measurements. Whereas, the scintillation parameter S4 index was computed as a standard deviation of the received signal power normalized to average signal power every 60 sec on L1. A corrected S4 (without noise effects) was also computed and used in the analysis. Results: It was found that the daily maxima vTEC for Parit Raja (PR) ranged from 38-100 TECU, which is generally higher than those of Sipitang, which ranged from 30-42 TECU. However, a general consistency for both stations can be seen during the 1 month campaign period. Conclusions/Recommendations: In conclusion, these results show good agreement in the existence of the equatorial anomaly observed during moderate solar flux conditions and undisturbed geomagnetic condition. This will contributes to the knowledge of equatorial ionosphere and help in space weather condition. However, to better understand and characterize the ionosphere over Malaysia, more campaigns should be encouraged.
Key words: TEC, scintillation, equatorial ionosphere, GPS
INTRODUCTION
The ionospheric disturbances cause significant effects on satellite signals for communication and navigation, which are dependent on the signal frequency and the ionospheric electron content. Ionospheric scintillations, the most significant manifestation of such disturbances, often takes place in equatorial region such as Malaysia. The ionosphere morphology is mainly due to the temporal and diurnal variability of the electron density. This is dependent on the solar and geomagnetic activity of the earth. Determination of the total electron content will aid in reliable and secure radio communications.
The observations of oblique total electron content can be obtained from the delay or advance of GPS signals on channels L1 (1575.42 MHz) and L2 (1227.6 MHz). The Total Electron Content (TEC) is the number of electrons in a column of 1 m2 cross section along the ray path[4,9]. Measurements of TEC are useful for the study of ionospheric dynamics, structure and characteristics.
The ionosphere in Malaysia is unique because of her location near the equator, where a lot of phenomena such as the equatorial anomaly and fountain effect makes it good for studies[10,16,20]. Zain and Abdullah[21] reported on the analysis of TEC using the GPS station at Arau, Perlis, in the northern part of Malaysia. Short term TEC analysis was also made using GPS station at Miri, Sarawak[22]. Furthermore, D region analysis from GOES-7 soft solar x-ray data at Universiti Kebangsaan Malaysia has also been carried out[1,2]. Ho et al. reported on typical hourly variations for quiet ionosphere over Malaysia during 24 h on July 14, 2000and continued with the variation during the geomagnetic storm on July 15-17, 2000[23].
In order to be close to the magnetic equator, an ionospheric monitoring was held from Nov 30-Dec 23, 2005 at Sipitang, Malaysia, which lies about 5.5° North. Sipitang is located at latitude 5.10° N and longitude 115.56° E at an altitude of 5.5 m. During the observation, TEC and scintillation parameters were extracted from dual-frequency GPS monitoring data. The ionospheric parameters were further compared to the main observatory at Wireless and Radio Science Centre (WARAS), Parit Raja, Batu Pahat, which is located at latitude 1.86° N and longitude 103.8° E at an altitude of 7.3 m.
MATERIALS AND METHODS
Total Electron Content (TEC) from GPS: The
ionosphere is the region between 70-1000 km above the earth containing ionized gas and electrons. A wave traveling through it will experience a time delay. The radio signals from GPS on channels L1 (1575.42 MHz) and L2 (1227.6 MHz) will experience difference delays[13,14]. TEC is a measure of the number of electrons along the path from the GPS satellite and is reported in TEC units (TECU = electrons×1016 m−2). As mention before, TEC can be obtained from the ionospheric delay between L1 and L2 signals as Eq. 1:
CAL = TEC result due to internal receiver L1/L2 delay and the offset
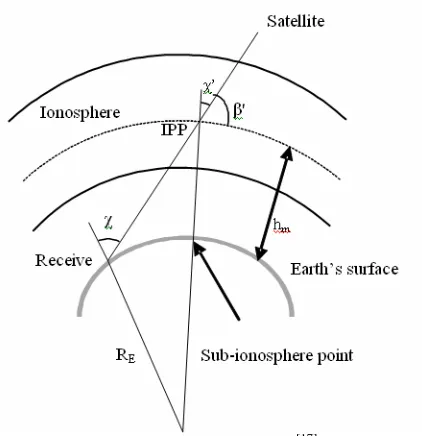
In other words, the TEC introduced in Eq. 1 (slant TEC) is defined as the total number of electrons integrated along the path from the receiver to each GPS satellite in a column having a cross sectional area of one m2 and is measured at different elevation angles. The vertical TEC (at elevation angle of 90°) or simply vTEC, as seen in Fig. 1, is modelled using a mapping function[15,18] as below:
(
)
Amplitude scintillation from C/A code GPS receiver:
Amplitude scintillation monitoring is traditionally accomplished by monitoring index S4. The S4 index is derived from signal intensity of signals received from satellites. Signal intensity is actually received signal power, which is measured in a way that its value doesn’t fluctuate with noise power. When the S4 index is normalized, the receiver’s absolute gain is not important, as long as it is relatively constant during the period. It is also important that the intensity measurements be linear with respect to the signal power over its entire range including deep scintillation fades.
Fig. 1: Ionosphere single layer model[17]
S4T = Total amplitude scintillation index
SI = Satellites signal intensity
where S4T represents the expected (or average)
value over the interval of interest (i.e., 60 sec)[5,12]. Unfortunately, the total S4 defined in Eq. 3 can have significant values simply due to ambient noise. Thus, it is desirable to remove. The ambient noise of Eq. 3 can be removed by estimating the average signal-to-noise density over the entire evaluation interval (60 sec) and using that estimate to determine the expected S4 due to ambient noise. This is legitimate since the amplitude scintillation fades do significantly alter the average signal-to-noise density over a 60 sec time interval.
If the signal-to-noise density (S/N) is known, the predicted S4 due to ambient noise is:
N
Subtracting the Eq. 5 from Eq. 3 yields the corrected value of S4 as following:
2
The results of the observed vTEC and S4 parameters are presented in this section. In both cases, comparisons are made between the campaign location (Sipitang) and the main observatory (Parit Raja). The daily maxima vTEC and S4 parameter are shown and discussed.
vTEC: The one-month results obtained during the the daily maxima vTEC for Parit Raja (PR) with values ranging from 38-100 TECU during the campaign period. However, vTEC values for Sipitang are generally lower as compared to Parit Raja, ranging from 30-42 TECU. It is also of interest to note that a general consistency for both stations at Parit Raja and Sipitang Hill can be seen during the 1 month campaign period.
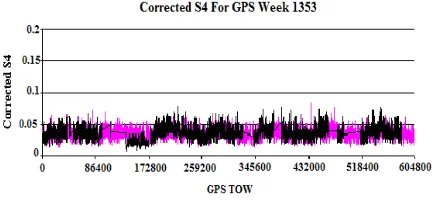
Scintillation parameter, S4: The scintillation parameter, S4 index, was computed as a standard deviation of the received signal power normalized to average signal power every 60 sec, based on 50 Hz sampling data rate (3,000 data samples) on L1.
Base on GISM Chart (Global Ionosphere Scintillation Model), scintillation activity indicated by S4 has four categories i.e. S4≤0.25 is quiet, S4>0.25 and S4≤0.5 is moderate, S4>0.5 and S4≤1 is disturbed, then S4>1 is severe[6]. Figure 3-6 show the scintillation parameter, S4 for both stations during the campaign period. Results indicate the overall S4 values for both stations are quite consistent.
Fig. 3: Corrected scintillation parameter, S4 for GPS week 1351 at Parit Raja and Sipitang (Parit Raja=Pink Line, Sipitang=Black Line)
Fig. 4: Corrected scintillation parameter, S4 for GPS week 1352 at Parit Raja and Sipitang (Parit Raja=Pink Line, Sipitang=Black Line)
Fig. 5: Corrected scintillation parameter, S4 for GPS week 1353 at Parit Raja and Sipitang (Parit Raja=Pink Line, Sipitang=Black Line)
Fig. 6: Corrected scintillation parameter, S4 for GPS week 1354 at Parit Raja and Sipitang (Parit Raja=Pink Line, Sipitang=Black Line)
DISCUSSION
The TEC parameters maxima vTEC observed at Sipitang are lower as compared to the station at Parit Raja. It is because of the location of Sipitang is closer to the magnetic equator as compared to Parit Raja. The equatorial fountain effect makes the lower electron density for such location near to magnetic equator. This can also be seen in the Fig. 1, that the Sipitang vTEC is much lower than the Parit Raja vTEC shows the presence of equatorial anomaly[1].
However, both observation stations are showing a general consistency for their TEC parameters. It is because the TEC parameters are mainly due to solar and geomagnetic activities of the earth. The geomagnetic index that is the Kp index is undisturbed condition during the observation which is less than 5 (The index runs from 0-9, where 9 is the most disturbed).
CONCLUSION
From the results, quiet scintillation event was observed at most of the week. Observations are taken on December 2005 (GPS week 1351-1354) where the geomagnetic is undisturbed condition during observations.
Although the duration of this observation was only for almost a month, results confirm the presence of the equatorial anomaly. More campaigns should be carried out to properly understand and characterize the ionosphere over Malaysia and the equator.
ACKNOWLEDGMENT
REFERENCES
1. Abdullah, M. and A.F.M. Zain, 2000. Determination of D-region electron densities from GOES-7 X-Ray detector measurement. Journal the Institution on Engineers, Malaysia, 61: 67-80. ISSN 0126-513x. 2. Abdullah, M. and A.F.M. Zain, 2005. Determination
of enhancement in D-region electron density using a solar flare model and GOES-7 measurements. Jurnal Kejuruteraan, Malaysia, 17: 13-26. ISSN 0128-0198 3. Beach, T.L., 2006. Perils of the GPS phase scintillation index (σ φ). Radio Science., 41: 1-7. DOI: 10.1029/2005RS003356.
4. Breedd, A. M., Goodwin, G. L.,Vandenberg, A.M., Essex, E. A., Lynn, K. J. W., Silby, J. H. 1997. Ionosphere, Radio Science: Ionospheric total electron content and slab thickness determined in Australia. Radio Sci., 32: 1635-1644 DOI: 10.1029/97RS00454.
5. Briggs, B.H. and I.A. Parkins, 1963. On the variation of radio star and satellite scintillations with zenith angle. Journal of Atmospheric and Solar-Terrestrial Phy., 25: 339-366. DOI: 10.1016/0021-9169(63)90150-8
IRI prediction with the observed equatorial anomaly in the total electron content around 120°E longitude. Advances in Space Research, 20: 1793-1793(1). DOI: 10.1016/S0273-1177(97)01044-2
8. Coisson, P., S.M. Radicella, R. Leitinger and B. Nava, 2002. Comparison of experimental topside electron concentration profiles with IRI and NeQuick models. Annals of Geophysics, 45(1):111-116.
http://www.earthprints.org/bitstream/2122/666/1/11 1_116%20Coisson.pdf
9. Davies, K. and G.K. Hartmann, 1997. Studying the ionosphere with the global positioning system. Radio Science, 32(4): 1695-1703. observations from the GPS and TOPEX satellites to investigate night-time TEC enhancements at mid-latitudes in the southern hemisphere during a low sunspot number period. Journal of Atmospheric and Solar-Terrestrial Phy., 62: 371-391. DOI: 10.1016/S1364-6826(99)00101-7
12. Klobuchar, J.A., 1996. Ionospheric Effect on GPS (Global Positioning System). In: Theory and Applications. Parkinson, B.W. and J.J.J. Spilker (Eds.). American Institute of Aeronautics and Astronautics, Washington DC, pp: 485. ISBN 1-56347-106-X
13. Klobuchar, J.A. and J.M. Kunches, 2000. Eye on the ionosphere: The spatial variability of ionospheric range delay. GPS Solution, 3: 70-74. DOI: 10.1007/PL00012808
14. Mannucci, A.J., B. Iijima, L. Sparks, P. Xiaoqing, B. Wilson and U. Lindqwister, 1999. Assessment of global TEC mapping using a three-dimensional electron density model. Journal of Atmospheric and Solar-Terrestrial Phy., 61: 1227-1236.
DOI:10.1016/S1364-6826(99)00053-X
15. Mannucci, A.J., B.D. Wilson, D.N. Yuan, C.H. Ho, U.J. Lindquister and T.F. Runge, 1998. A global mapping technique for GPS-derived ionospheric total electron content measurements. Radio Science, 33(3): 565-582. DOI:10.1029/97RS02707
16. McNamara, L.F., 1994. Radio Amateurs Guide to the Ionosphere. Krieger Publishing Company, Florida, USA, 1st Binding, pp: 166. ISBN: 0894648047
17. Mubarak, W. A., Abdullah, M., Misran, N., 2008. Total Electron Content variation before the Sumatra earthquake of 12 September 2007, Proceedings of the Engineering Postgraduate Conference 2008 (EPC 2008), pp 1-6, ISBN:978-983-2982-22-7. 18. Schaer, S., G. Beutler, L. Mervart, M. Rothacher 20. Zain, A.F.M., Abdullah, M., Ho Yih Hwa., Rhazali,
21. Zain, A.F.M. and M. Abdullah, 1999. Initial results of total electron content measurements over arau, Malaysia. Proceedings of the 4th IEEE Malaysia International Conference on Communications, Melaka, 17-19 Nov. 1999, Vol. 1, pp. 440-443. ISBN: 983-99335-2-3(V.1)
22. Zain, A.F.M. and M. Abdullah, 2000. Measurements of total electron content variability at Miri, Sarawak: Short Term Analysis. Proceedings of the 2nd International Conference on Advances in Strategic Technologies (ICAST2000), Vol 2, pp: 1767-1775, Putrajaya, Malaysia, 15-17 August 2000. ISBN: 983-9152-70-x
23. Zain, A.F.M., Y.H. Ho and M. Abdullah, 2002. Enabling GPS technology on equatorial ionosphere monitoring during geomagnetic storm of July 15-17, 2000. Proceedings of the 15th Int. Tech. Meeting of Satellite Division of the Institute of Navigation (ION GPS 2002), September 24-27, 2002, Oregon Convention Centre, Portland, Oregon, USA , pp:1341-1344.