ON THE UNSTEADY AERODYNAMICS OF ROAD VEHICLES
IN THE DYNAMIC MOTIONS
S.Y. Cheng
1,5, M. Tsubokura
1, Y. Okada
2, T. Nakashima
3, T. Nouzawa
2,
and T. Kobayashi
41
Hokkaido University, Japan
2
Mazda Motor Corporation, Japan
3
Hiroshima University, Japan
4
Japan Automobile Research Institute, Japan
5
Universiti Teknikal Malaysia Melaka, malaysia
[email protected]
Abstract
Unsteady aerodynamics of road vehicles in dy-namic pitching motion were investigated by numerical analysis. Dynamic coupling simulation of flow and vehicle motion was realized based on a large eddy simulation (LES) technique with moving boundary methods. Fully unstructured finite volume code pre-viously developed was implemented for the road ve-hicle aerodynamics. Arbitrary Lagrangean-Eulerian (ALE) method was employed to handle vehicle’s ro-tating motion, particularly the dynamic pitching. This vehicle motion type is chosen because of the unsteady aerodynamics are expected to be crucial in regards to the comfort of passenger. By using the numerical simulation, a method to estimate the vehicle’s aero-dynamic damping was proposed.
1
Introduction
Conventionally, the aerodynamic performance of road vehicles has mainly been assessed on the basis of their drag coefficient Cd, which is obtained through
steady-state wind tunnel measurements. Thus, it is not adequate to reflect a vehicle's performance with re-spect to unsteady are-spects that are commonly encoun-tered in real life. To consider the stability factors, several assessment methods have been proposed in the literature (e.g. Okada et al, 2009; Howell and Le Good, 1999; Aschwanden et al, 2006). But these methods rely on drive test or wind tunnel measurement, which provide only limited flow information. This can im-pede detailed flow analysis needed for understanding the underlying mechanism.
A more generalized approach that can be used to assess the aerodynamic stability performance of ve-hicle under transient situation is highly desirable. Therefore, the present study aims to develop a com-putational method which can simulate the desired test environment and vehicle motion, for evaluations of vehicle’s aerodynamic performance. The method will enable direct comparison of vehicle’s stability per-formance. In addition, the details of flow information that can be obtained with the present numerical
method will also enable comprehensive study of the physical mechanism that govern the aerodynamic stability of vehicle.
2
Mathematical formulation
The governing equations adopted in this study are given by the spatially filtered continuity and Navier-Stokes equations for incompressible Newto-nian flow, which are expressed in tensor notation as
, (1)
, (2)
where the over-bar denotes the spatially filtered quantity, and , , and are the i-th velocity com-ponent, kinetic viscosity, and fluid density, respec-tively. The strain rate tensor and the filtered pressure in eq. (2) are
, (3)
. (4)
The effect of subgrid-scale (SGS) turbulence on the grid-scale turbulence motion is represented by the SGS eddy viscosity, which is modeled by Smagorinsky (1963) as
, (5)
where is the volume of the generic numerical ele-ment. The model coefficient is given as 0.15, which is typically used in simulations of flow around a rectangular cylinder. The eddy viscosity is damped in the vicinity of a solid wall using a Van-Driest func-tion:
, (6)
where is the distance from the wall in wall coor-dinates.
method. The second-order central differences were applied for the spatial derivative, blended with the first-order upwind scheme for the convective term in the Navier-Stokes equations to avoid excessive nu-merical oscillation appearing at coarse tetrahedral elements. It should be noted that the dissipation property of upwind schemes is desirable to a certain extent for engineering applications of the LES on un-structured meshes. As a compromise, the contribution of the upwind discretization to the convective fluxes was set to be as low as 5%. The diffusive fluxes on the volume surface were treated based on the deferred correction formula suggested by Muzaferija (1994) to avoid a checker-board type oscillation. The monotone upwind scheme for conservation laws (MUSCL) by van Leer (1977) was also adopted for the convective term at the region away from the vehicle where up-wind dissipation does not affect the wake or near-wall turbulence of the target vehicle.
The time marching was based on the fractional step method by Kim and Moin (1985), in which the 3rd-order Adams-Moulton scheme or the implicit Euler scheme was adopted for the velocity prediction step. The coupling of the velocity and pressure fields to obtain the pressure and to correct the velocity was based on the simplified marker and cell (SMAC) method by Amsden and Harlow (1970). The flow rate on the control-volume surface was estimated follow-ing the method proposed by Rhie and Chow (1983) to keep the checker-board type pressure oscillation off. The pressure Poisson equation was solved using the incomplete Cholesky conjugate gradient (ICCG) method.
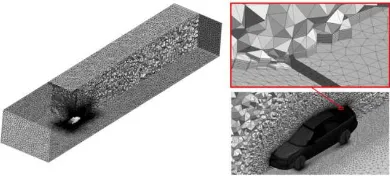
We used the ALE method (Hirt et al, 1974) to recreate the vehicle’s pitching motion during flow simulation. In this method, numerical grids move ar-bitrarily to capture a vehicle’s pitching motion with-out changing the nodes’ topological connectivity. Figure 1 shows the computational domain and grid allocation around the vehicle model. The computa-tional domain comprises of prism and tetrahedral cells. Overall, the whole domain encompasses around 12 million elements with three million nodes.
Figure 1: Computational domain (left) and prism mesh layers on vehicle surface (right).
A constant velocity of 39m/s is imposed at the inlet while a simple gradient-free boundary condition is imposed at the outlet. The ground surface was di-vided into two regions in which free-slip wall boundary was imposed to the 5.0L from the inlet to simulate the suction floor effect which prevent the development of boundary layer, while the remaining
ground surface was treated by the wall-model as-suming a fully developed turbulent boundary layer. Meanwhile, the ceiling and lateral boundaries of the domain were also treated as free-slip wall boundary.
For the given inlet velocity, the airflow Reynolds number with respect to vehicle length is 1.21 x 10⁷. At this high Reynolds number range, it is impossible to allocate sufficient grid resolution at the vehicle sur-face to resolve the wall boundary layer. Thereby, a universal velocity profile of fully developed turbulent boundary layer is assumed on the vehicle surface. In the assumed velocity boundary, the fluid velocity at the first nearest grid point from the wall is supposed to fit the universal logarithmic law of the mean velocity, and the surface friction is estimated. Then, the ob-tained surface friction is imposed as a Neumann-type boundary condition of the velocity on the first nearest control-volume surface. To implement this, we em-ployed two strategies to ensure that the resulting y+ of the first nearest grid point is within the log-law region. First, we created the prism mesh layers at the vehicle surface which enable us to control the normal distance of the first grid point (i.e. 1 mm). Second, we reduced the Reynolds number by one order of magnitude (by decreasing the dynamic viscosity of the fluid). As a result, the y+ around the vehicle surface is below 30, which enable us to resolve the boundary layer above the buffer layer region.
3
Software and Hardware
The computational code adopted in the present study was originally developed in the "Frontier Sim-ulation Software for Industrial Science" project. The project started in 2002 as an IT research program sponsored by the Ministry of Education, Culture, Sport, Science and Technology of Japan. The authors intensively optimized the code for LES applications under the subsequent IT project “Revolutionary Sim-ulation Software (RSS21)”, and parallel and vector efficiency as high as 96% and 99%, respectively, were achieved in simulations performed on 100 nodes/800 CPU. This allowed completion of LES calculations of flow around a formula car with complex geometry in about 120 hours (Tsubokura et al, 2007). The code was then optimized for unsteady vehicle aerodynam-ics simulations (Tsubokura et al, 2009) under a project supported by an Industrial Technology Research Grant Program in 2007 from the New Energy and Industrial Technology Development Organization (NEDO) of Japan. We are now improving this code for the very large-scale simulation of up to some bil-lion numerical elements to be executed on “K,” the world’s fastest supercomputer, in Japan.
4
Validation
The numerical method was validated in the steady state under the condition that the vehicles were fixed on the floor without any motion. The vehicles used in the validation are simplified sedan-type vehicles with differences in the A-pillar, side skirt, and underbody configurations (see Figure 2). Table 1 summarizes the Cd and Cl measured in the Mazda full-scale wind
tunnel and obtained by the present numerical simula-tion. It should be noted that comparison of the abso-lute values of Cd and Cl between the wind tunnel data
and numerical simulation is only for reference, be-cause the numerical models shown in Figure 2 are the simplified representations of the real vehicle used in wind tunnel measurement (i.e. they are not entirely identical).
Figure 2: Vehicle models used in validation: Original vehicle (left) and modified vehicle (right).
Table 1 shows that the LES has successfully cap-tured the Cd and Cl improvement tendency in the
modified vehicle. In particular, the ∆Cd of numerical
simulation is in excellent agreement with the experi-ment. Whereas a slightly larger discrepancy is identi-fied in ∆Cl, it is still acceptable because the qualitative
improvement is well reproduced. Hence, we can de-duce that the geometrical differences between these two models are well reproduced numerically.
Table 1: Comparison of Cd and Cl between
wind-tunnel measurements and present LES.
Cd Cl
Vehicle Exp. LES Exp. LES Original 0.32 0.323 0.20 0.207 Modified 0.30 0.301 0.16 0.142 Difference -0.02 -0.022 -0.04 -0.065
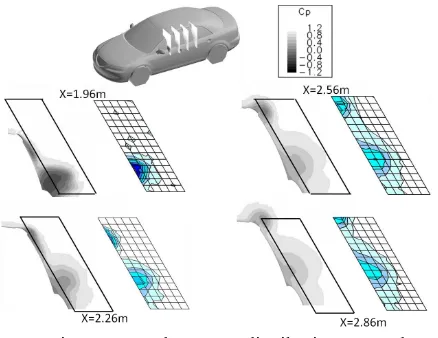
Figure 3 compares the total pressure distribution behind the side mirror observed in the wind tunnel with that predicted by the present simulation. The typical flow structures around this region are the in-teraction of two eddies generated by the A-pillar and the side mirror, which are observed on the planes at x=2.26 to 2.86 m in the figure. The simulation results show good agreement with the wind-tunnel meas-urements.
Figure 4 shows vortex structures extracted from the LES results (left) by expressing the streamlines and velocity magnitude above the trunk deck, and their comparison with the postulated flow structures obtained with wind-tunnel visualization (Okada et al,
2009). The important flow structures above the trunk deck are the two couples of eddies coming from the A and C pillars. In our previous studies on pitching sta-bility, we found that the interactions of these two kinds of eddies profoundly contribute to the aerody-namic damping mechanisms of a vehicle’s pitching motion. We can observe that our present simulation generates the expected flow structures above the ve-hicle. These results clearly indicate that our simulation properly reproduced the difference in flow structures between Vehicle-A and Modified Vehicle-A gener-ated by the slight geometrical differences shown in Figure 2. Based on these simulation results and an intensive comparison of them with the full-scale wind-tunnel measurements, we can say that our sim-ulation is sufficiently correct to discuss the vehicle’s aerodynamic stability during pitching.
Figure 3: Total pressure distributions around A-pillar and side mirror of Vehicle-A: left, simulation;
right, wind-tunnel. The location of each plane is measured from the front end of the vehicle.
Figure 4: vortex structures of Vehicle-A: Simula-tion (left) and schematics suggested by wind-tunnel
measurements (after Okada et al, 2009) (right).
5
Periodic pitching oscillation
To probe the stability attitude of the vehicles, a periodic pitching oscillation was imposed on them during LES by employing the ALE method. The pitching axis is located at the front-wheel axle. Hence, the models were rotated in a manner that simulates the rear-ride height (RRH) fluctuation of the real vehicles. This corresponds to the fact that the sedan-type vehi-cles were mainly suffered from RRH fluctuation during road test (Okada et al, 2009). The pitch angle θ of the models is defined as
( )
0 1Cos tθ θ θ
= +ϕ
By setting θ0 and θ1 equal to 0.9, the vehicle models
were forced to oscillate at amplitude of 0.9°. The frequency fp was 1 Hz, which corresponds to Strouhal
number (St) of 0.13, normalized by L and inlet flow. This value was chosen in consideration of the road test’s RRH fluctuation St of 0.15 obtained by Okada et al (2009).
6
Aerodynamic damping coefficient
To assess the dynamic responses of the models under the influence of pitching oscillation, we de-composed the phase-averaged M into the steady and unsteady components. The equation for phase-averaged M in terms of θ is given as the fol-lowing expansion,
0 1 2 3
M =C +Cθ+C θ+Cθ (8) where, respectively, the single dot and double dots in the third and fourth terms indicate the first and second derivatives with respect to θ. Both C0 and C1 are static
components; the former denotes the pitching moment at zero pitch, while the latter describes the quasi-static behavior by taking into account the pitch-angle vari-ation in a static manner. C2 is associated with
aero-dynamic damping, and C3 is an added moment of
in-ertia that is proportional to angular acceleration. Substituting Equation (7) into (8) and introducing new coefficients gives
( )
( )
stat angsin t discos t
M+=C C + φ C φ (9)
In Equation (9), the Cstat is a constant, and Cdis is
in-phase with the imposed displacement. In the case of periodic pitching oscillation, these two components produce zero net work on the model over a full cycle of oscillation. On the contrary, Cang which is in-phase
with the angular velocity produces work on the model. Hence, this parameter reflects the dynamic response of the vehicle. It depends on the sign of Cang, a
nega-tive value implies a tendency for aerodynamics to damp the pitching oscillation, whereas a positive value enhances it. The coefficient thus enables quan-titative evaluation of vehicle stability.
7
Comparison of two aerodynamic
con-figurations
On the basis of wind tunnel visualization and road test results, Okada et al (2009) reports that the type of flow structures formed above the truck deck strongly affect the pitching stability attitude of sedan-type ve-hicle. And the characteristic of the flow structures are depends on the geometrical configurations of the A- and C-pillars. However, the limited flow information that can be obtained through experimental fluid dy-namic study impedes comprehensive analysis of the mechanism involved. Therefore, we employed the LES method, which can resolve the details of spatial and temporal information of the flow, to further con-firm the findings and investigate the mechanism of aerodynamic damping.
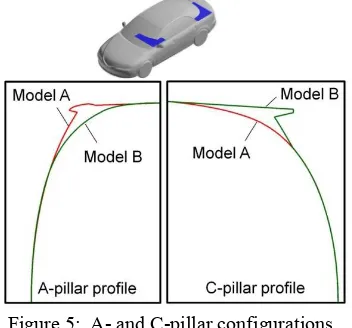
The general geometrical features of the models employed at this stage are based on the original vehi-cle (Figure 2) but with a flat underbody configuration. We modified the A- and C-pillar configurations to obtain two vehicle models which conform with the characteristic geometry of the stable and less stable sedans reported in our previous investigation. The models are at full scale with similar height H, width W, and length L measurements of 4.7, 2.0, and 1.6m, re-spectively. The model that represents the vehicle with higher pitching stability has a rounded A-pillar and angular C-pillar configurations, while the one with lower stability adopted the opposite configurations, see Figure 5. The slant angles of the A- and C-pillar of the models are 30° and 25°, respectively. In order for convenient in the discussions, the model represents the vehicle of lower pitching stability is designated “model A”, while the other model is termed “model B”, hereafter.
Figure 5: A- and C-pillar configurations.
The Cang of the two models are obtained by fitting
their respective phase-averaged M using the nonlinear least squares regression. Figure 6 shows the curves of phase-averaged M and the corresponding fitted func-tions. The shapes of the curves are similar, but there is a phase shift between them. As a result, model B has a higher negative Cang than model A, by about 20.5%.
The higher Cang obtained with model B indicates that
its aerodynamic forces induce a higher resisting force on its body motion - stabilizing behaviors. This find-ing is consistent with the fact that model B was cre-ated with aerodynamic features of the real vehicle with higher stability.
(2009) on the basis that the aerodynamic force had acted on the trunk deck of vehicle with lower stability to promote its pitching motion. While in the higher stability vehicle, the aerodynamic force induced a re-straining effect.
Figure 6: Phase-averaged M and fitted functions.
Figure 7: Body-part designations.
Table 2: Contribution of body part on Cang. Cang Model A Model B diff. %
Underbody -92.28 -97.26 -5.0 20.5 Panel -6.60 -9.73 -3.1 12.9 Car roof -7.39 -8.50 -1.1 4.6 Windshield -6.89 -6.26 0.6 -2.6 Rear shield -3.01 -7.41 -4.4 18.1 Deck 3.79 -3.71 -7.5 30.9 Front 0.09 0.08 0.0 0.1 Bonnet 0.37 0.49 0.1 -0.5 Base 5.91 2.02 -3.9 16.0 Overall -106.01 -130.29 -24.3 100
8
Mechanism of aerodynamic damping
To look into the mechanism of how the models produce the opposite aerodynamic damping charac-teristics, particularly at the trunk deck, we performed a detailed flow analysis above the trunk deck regions. Figure 8 shows the phase-averaged aerodynamic lift exerted on the trunk deck. During tail-up pitching cycle, Ldeck progressively decreases in model B, which
indicates that the resulted M tended to resist the vehi-cle’s pitching motion - stabilizing. In model A how-ever, Ldeck increases in the latter half of the cycle.
Hence, the resulted M is destabilizing. During tail-down pitching cycle, the progressively increasing trend in model B again implies a stabilizing tendency. While model A exhibits a destabilizing tendency in the earlier half of the cycle.
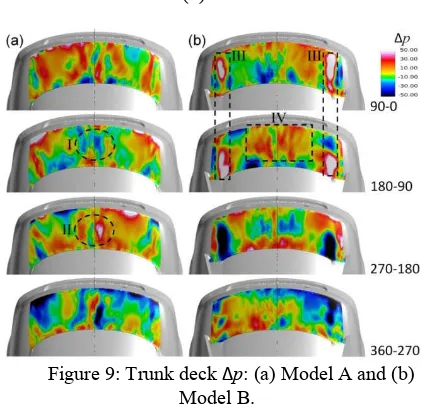
Figure 9 shows the static pressure difference ∆p in trunk deck between each quadrant of pitching cycle. First, let us examine the causes for the destabilizing influence by aerodynamics in model A. From φ = 90 to 180°, the Ldeck decreases due to the decreases of
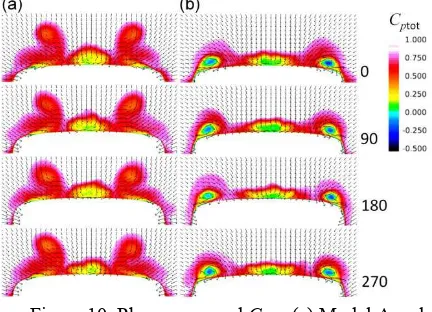
static pressure in the central region (marked I). The cross flow velocity vectors in Figure 10 depicts that there are stronger circulatory structures in the central region of trunk deck at φ = 180°. This is due to two factors. First, the strength of A-pillar vortex has in-creased with pitch angle, as may be evidenced by the higher Cptot core. Second, at maximum pitch angle, the
clearance between the stronger A-pillar vortex and trunk deck becomes smaller. Hence, relatively stronger cross flows are generated in the clearance. These cross flows which approach from both sides form an upwash structures as they converged at the centerline. This observation agrees with the results obtained with sedan-type simple bodies by Cheng et al (2011 and 2012).
Figure 8: Phase-averaged L on deck: (a) Model A and (b) Model B.
Figure 9: Trunk deck ∆p: (a) Model A and (b) Model B.
From φ = 180 to 270°, the destabilizing tendency is caused by the rise of static pressure in the central re-gion (marked II). At φ = 270°, the trunk deck surface is farther away from the A-pillar vortex. This could be the reason why the upwash structures decreases and results in a higher static pressure on the trunk deck.
of C-pillar vortex with pitch angle. At larger pitch angle, the slant angle of C-pillar decreases. Hence, it generates a weaker longitudinal vortex with lower induced pressure drop.
At each side of trunk deck, the C-pillar vortex ro-tates in direction that draws the airflow towards the centerline. As such, the surface pressure in the central region increases (marked IV) when the weakening C-pillar vortex induces lesser cross flow at higher pitch angle. This additional pressure increment might be the reason for the steeper drop in Ldeck from φ = 180
to 270°. During tail-down pitching cycle, the opposite tendency occurs. First, the vortex induced pressure at the sides decreases as the C-pillar vortex becomes stronger. Second, the surface pressure in the central region decreases.
Figure 10: Phase-averaged Cptot: (a) Model A and
(b) Model B.
9
Conclusions
The present study has introduced a numerical method for assessment of vehicle performance under a transient situation. The results show that the outcomes obtained with sedan-type simple bodies are transfer-able to the aerodynamics of real vehicle. Hence, the present study has again confirmed that a rounded A-pillar configuration is important for obtaining a stabilizing aerodynamic effect with respect to pitching. With the present numerical method, we are able to improve realism in vehicle aerodynamic simulation by incorporating vehicle body motion, which is inevitable in real life driving situation.
Acknowledgements
This work was supported by the Industrial Tech-nology Research Grant Program in 2007 from the New Energy and Industrial Technology Development Organization (NEDO) of Japan. A portion of this re-search was also supported by the grant for “Strategic Program—Preliminary Research Field No. 4: Next-Generation Industrial Innovations” from the Ministry of Education, Culture, Sports, Science, and Technology (MEXT)’s “Development and Use of Advanced, High-Performance, General-Purpose
Su-percomputers Project,” and carried out in partnership with the University of Tokyo. This is a cooperative research with Mazda Motor Corporation, and the ex-perimental data provided are greatly acknowledged.
References
Amsden A.A., and Harlow F.H. (1970), A simplified MAC technique for incompressible fluid flow calcu-lations, J Comput Phys, 6, pp.322-325
Aschwanden P., Müller J., Knörnschild U. (2006), Experimental study on the influence of model motion on the aerodynamic performance of a race car, SAE Paper 2006-01-0803
Cheng S.Y., Tsubokura M., Nakashima T., Nouzawa T., Okada Y. (2011), A numerical analysis of transient flow past road vehicles subjected to pitching oscilla-tion. J. Wind Eng. Ind. Aerodyn, 99, 511-522 Cheng S.Y., Tsubokura M., Nakashima T., Okada Y., Nouzawa T. (2012), Numerical quantification of aerodynamic damping on pitching of vehicle-inspired bluff body, J. Fluid Struct, 30, pp. 188-204
Kim J., and Moin P. (1985), Application of a frac-tional step method to incompressible Navier-Stokes equations, J Comput Phys, 59, pp.308-323
Hirt C.W., Amsden A.A. and Cook J.L. (1974), An Arbitrary Lagrangian-Eulerian Computing Method for All Flow Speeds, J Comput Phys, 14, pp. 227-253 Howell J. and Le Good G. (1999), The Influence of Aerodynamic Lift on High Speed Stability, SAE Technical Paper 1999-01-0651
Muzaferija S. (1994), Adaptive finite volume method for flow predictions using unstructured meshes and multigrid approach, Ph.D thesis, Univ. of London Okada Y., Nouzawa T., Nakamura T., and Okamoto S. (2009), Flow structures above the trunk deck of se-dan-type vehicles and their influence on high-speed vehicle stability, 1st report: On-road and wind-tunnel studies on unsteady flow characteristics that stabilize vehicle behavior, SAE Int. J. of Passenger Cars – Mechanical Systems, 2(1), pp.138-156, 2009
van Leer B. (1977) Toward the ultimate conservative difference scheme 4, a new approach to numerical convection, J Comput Phys, 23, pp.276-99
Rhie C.M., and Chow W.L. (1983), A numerical study of the turbulent flow past an isolated airfoil with trailing edge separation, AIAA Journal, 21, pp.1525-32
Tsubokura M., Kitoh K., Oshima N., Nakashima T., Zhang H., Onishi K., and Kobayashi T. (2007), Large Eddy Simulation of Unsteady Flow around a Formula Car on Earth Simulator, SAE 2007 Trans. J. of Pas-senger Cars –Mechanical Systems, 2007-01-0106 Tsubokura M., Nakashima T., Kitoh K., Sasaki Y., Oshima N., and Kobayashi T. (2009), Development of an Unsteady Aerodynamic Simulator Using