Open Switch Faults Analysis in Voltage Source
Inverter using Spectrogram
A.R.Abdullah, N.S.Ahmad, E.F.Shair, A.Jidin Faculty of Electrical Engineering Universiti Teknikal Malaysia Melaka (UTeM)
Malacca, Malaysia
Abstract—The performance and effects is critical factor in industry, especially usage power inverter such as motor, switching and control circuit. Until now, the statistic of effects still increase in the application. In order to overcome this, the spectrogram technique is used to represent the signals in time frequency representation (TFR). This paper introduces time-frequency distribution (TFD) technique for detecting and identifying the open circuit fault in application of inverter. The condition monitoring is based on time-frequency distribution. Since Fast Fourier Transform (FFT) is one of the techniques to analyze the signal, but it has some limitations in non-stationary signal. From TFR the parameters such as root means square voltage (Vrms), total waveform distortion (TWD), total harmonic distortion (THD) and total non-harmonics (TnHD) for voltage source inverter (VSI) are used to identify the characteristic of the signals. The result shows that spectrogram technique capable to identify and evaluate the information of voltage source inverter (VSI). The proposed technique is verified as simulation results.
Index Term-Voltage Source Inverter; Fast Fourier Transform; Spectrogram
I. INTRODUCTION
Inverters are widely utilized to drive application of ac motor. Such as in power electronic applications drive motor, air conditioning, uninterruptible power supplies and others. In statistic, about 38% failures that found in the application of power inverter and mostly that come from power switches [1]. Signal condition of voltage source inverter (VSI) and their performance severity can be determined by frequency component of signal current. The time-frequency distribution (TFD) used as a method for several of applications such as power quality because it is appropriate for examining non stationary.
The better electrical apparatus usage in life depends on a design and performance of inverter.If any failure of the system occurs in real application, the main effects to the human life is high cost for maintenance. Regarding this issue, the knowlegde and parameter identify about the fault mode behaviour of a inverter a extremely important from the stanpoint of improved system design and protection. There could be a quite high chance of failure in the switching devices due to the high electrical [3]. The failure of switching devices can take place in the form of open and short. Therefore, the knowledge and information about the behavior
of inverter is important to improve system design and protection [4].
Several pieces of research use fast Fourier transform (FFT) to analyze the performance of current VSI. But, the FFT not appropriate for non stationary signal. As regards real signals, that consists of harmonics and inter-harmonics components. Meanwhile have several technique used to identify the harmonic and inter-harmonics component and evaluate performance of the signal
. As stated in, advantages of the spectrogram is able to present time-frequency representation and accurate compare using FFT [5]. Smith et al. [6] used a technique based on stator current time-domain response. The purpose research to detect intermittent misfiring fault of switched in the inverter. Mohamed Trabelsi et al. [7] develop simulation for PWM-Switching pattern either open-circuit fault upper switches and analyze open-circuit fault lower switches. Previous researches familiarize two methods to identify the inverter fault modes. The research is Peuget et al. [8] introduce technique based on analysis of the current vector trajectory and the second technique determines by current vector instantaneous frequency.
This paper presents the performance of the inverter under open circuit power device failures, in voltage source inverter by using simulation. The new approach is achieved by analyzing the switching pattern and the change of the line-to-line voltage levels during the switching times, under both healthy and faulty operating conditions. The spectrogram technique is used to represent the signals in time frequency representation (TFR) to evaluate and present the parameter performance voltage source inverter when open-circuit fault identified. Under these fault conditions time domain and frequency domain analyses are performed to discriminate fault condition.
II. SWITCHING FUNCTION MODEL FOR VSI
Fig.1. Standard three-phase ac drive structure
Based on the theory switching function of the voltage source inverter, the relationship between the input and output variables can be obtained. In application inverter, fault occurs in one of the power switches (S11
-
S32), the inverter faultdetects the fault occurrence and isolates the faulty leg. If the fault is an open circuit, the isolation is implemented by removing the gate signal from the switches of the faulty leg [10].
Fig. 2. Gating signals of the inverter in an ideal case
A switching function of the VSI is defined as fig. 2, where j represents the phase, and variable p represents the upper and
n represent lower component of the phase. When a three-phase VSI is considered, j = {a, b, c}. The switch Sj is closed whenever current flow through the IGBT or the anti-parallel diode (D1- D6), and otherwise open show the gating signal when in an ideal case. The switching status represent in term of “1” when the switch is closed and “0” when open.
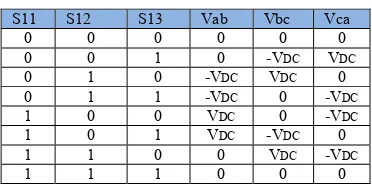
According of the eight switching states as shown in Table 1 two of them produce zero ac line voltage at the output. In this case, the ac line currents freewheel through either the upper or lower components. The remaining states produce no zero ac output line voltages. In order to generate a given voltage waveform, the inverter switches from one state to another. Thus the resulting ac output line voltages consist of discrete values of voltages, which are -VDC, 0, and VDC.
TABLE1
SWITCHING VOLTAGE POSSIBILITIES 3-PHASE VSI
S11 S12 S13 Vab Vbc Vca
0 0 0 0 0 0
0 0 1 0 -VDC VDC
0 1 0 -VDC VDC 0
0 1 1 -VDC 0 -VDC
1 0 0 VDC 0 -VDC
1 0 1 VDC -VDC 0
1 1 0 0 VDC -VDC
1 1 1 0 0 0
III. DEFINITION OFOPEN-CIRCUIT FAULT
An open-circuit fault in the VSI makes the current in the phase be zero for either the positive or negative half-cycle depending on whether it occur to the upper or lower switch. On the other hand, it was demonstrated here that an open-circuit switch fault will still permit the operation of the motor-drive system, but at a much inferior performance due to the presence of significant torque pulsations. For illustration, consider the one inverter leg a, as they are shown in Fig. 3, which illustrates which semiconductor is conducting, the output phase current and corresponding line-to-line voltage be consider.
Fig. 3. Gating signals of the inverter in an ideal case
A. Open-Circuit Fault of the Lower Switches
The open-circuit fault that considering the switching dead-time and Fig. 4(a) shows the basic configuration of phase a
leg of a three phase PWM VSI. When the system is under the fault condition as can be seen in Fig. 4(a).
Open-circuit fault
Fig. 4(a) Gating signals of the inverter in an open-circuit fault (lower)
The switching gate signal below defined the condition switch voltages under open-circuit fault in lower power switch S12 where Sjp and Sjn represent the upper and lower switching signals of phase a. In this case, the faults occur and detect at certain time and the back normal operation.
B. Open-Circuit Fault of the Upper Switches
Similarly to the open-circuit fault at S12, the switching voltage at Sjp occurs of the upper switches where S11 open-circuit fault occur. In the case, the upper switching consists delay at certain time then current drop occur at VSI. The normal operation switching, the upper and lower side not similarity, it because only one IGBT function for phase a. IM
Sjn
Sjp iA
iB iC
Sjp
Sjn
1
0
1
Fig.4(b) shows the switching gate signal consist delay at certain time. That mean, the switching at the “0” condition until return to normal.
Open-circuit fault
Fig. 4(b) Gating signals of the inverter in an open-circuit fault (upper)
VI. PERFORMANCEPARAMETER
The performance of parameter in VSI by using time-frequency analysis techniques presents a three-dimensional plot of a signal in terms of the signal energy or magnitude with respect to time and frequency [11].
This study focused on spectrogram to perform time-frequency for evaluate performance of the open-circuit fault VSI signal.
A. Spectogram
The spectrogram is the result of calculating the frequency spectrum of windowed frames of a compound signal [9- [10]. The spectrogram time frequency representation is calculated as follows:-
(1)
B. Instantaneous RMS voltage
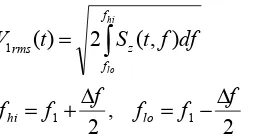
The instantaneous RMS voltage [17] is : -
maximum frequency of interest.
C. Instantaneous RMS fundamental voltage
Instantaneous RMS fundamental voltage is defined as the RMS voltage at power system frequency [12]. It can be calculated as
where f1 is the fundamental frequency that corresponds to the power system frequency and Δfis the bandwidth. In this paper,
the fundamental frequency that used is 60 Hz.
D. Instantaneous Total Waveform Distortion
Waveform distortion represents all deviations of the voltage waveform from the ideal sinusoidal waveform in terms of magnitude or frequency the signal [12, 15]. The instantaneous total waveform distortion can be expressed as:-
()
where V1rms(t) is the instantaneous RMS fundamental voltage and Vrms(t) is the instantaneous RMS voltage.
E. Instantaneous Total Harmonic Distortion
Total harmonic distortion, THD is used to measure of how much harmonic content in a signal [13,15]. It and can be defined as highest measured harmonic component.
F. Instantaneous Total Nonharmonic Distortion
Voltage often contains interharmonic components that are not multiple integer of the power system frequency [14]. It can be written as:-
To evaluate the performance of the proposed method, simulation software has been implemented. The simulations by using an induction motor are completed and the parameters used for the simulation are as follows: ts=50µs, V=60v. The evaluation result as figure below.
A. Analysis Open-Circuit Fault of the Upper Switches
Fig. 5(a) shows the current waveforms three phases VSI consist of normal and fault condition for phase a open-circuit fault in the upper power switch. The faults occur at 0.2 to 0.3second. When IGBT switch open fault occurs, the positive current of the phase a is rapidly decreased to 0A because the positive voltage is not applied to the terminal. However, negative current flows normally even if the upper switch has
fault. The clearly result shows in Fig. 5(b), where the current negative when fault detection.
Fig. 5(a) Simulation result for 3phase VSI and fault-detection output when open-circuit fault occur in the upper IGBT
Fig. 5(b) Open-circuit fault condition in phase a
Fig. 6. Time-Frequency Represent of open-circuit fault signal using spectrogram
The open circuit fault current is sinusoidal shape contained the distorted waveform with different amplitude. Fig. 6 shows time and frequency of open circuit fault signal using spectrogram. The signal consists of fundamental frequency 60 Hz and 0 Hz. The highest amplitude represents red color and lowest represent blue color.
Fig. 7(a) Instantaneous RMS Voltage, Vrms (pu)
Fig. 7(b) Instantaneous RMS Fundamental Voltage, Vrms(pu)
Fig. 7(c) Instantaneous Average Voltage
Fig. 7(a) shows the RMS voltage decrease starting at 0.15 to 0.2 second and increase at 0.2 to 0.3 second. The fig. 7(c) shows the average voltage for open-circuit fault in the upper inverter.
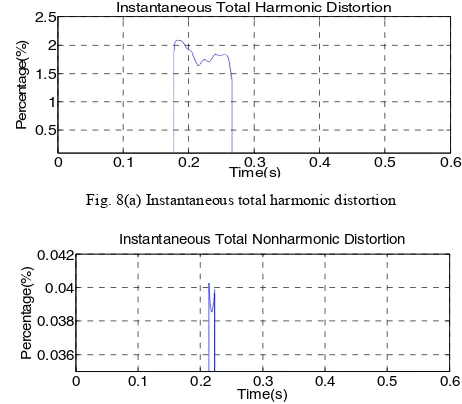
Fig. 8(a) Instantaneous total harmonic distortion
.
Fig. 8(b) Instantaneous total non harmonic distortion
0 0.1 0.2 0.3 0.4 0.5 0.6
Open-Circuit Fault (Upper Switches)
normal operation fault operation normal operation
0 0.1 0.2 0.3 0.4 0.5 0.6
fault operation normal operation normal operation
Instantaneous RMS Fundamental Voltage(pu)
0 0.1 0.2 0.3 0.4 0.5 0.6
Instantaneous Total Harmonic Distortion
0 0.1 0.2 0.3 0.4 0.5 0.6
Instantaneous Total Nonharmonic Distortion
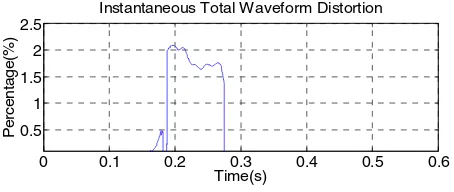
Fig. 8(c) Instantaneous total waveform distortion
Fig.8(a)-(c) shows the parameter estimation from TFR which is THD, TnHD, and TWD. Fig.8a show THD occurs in this signal starting at 0.18 until 0.28second. The TnHD also occur in this signal as per Fig. 8(b).It means this signal consist of multiple integer and non multiple integer frequency. The value of TWD is obtained from the total of THD and TnHD.
B. Analysis Open-Circuit Fault of the Lower Switches
Fig. 9 Open-circuit fault condition in phase a
Similarly, simulation result for S12 open-circuit fault is
shown in Fig. 9 and the current is nonnegative. When an open-circuit occurs at 0.2second, current of phase a can be positive, it indicates open-circuit fault lower occurs. The faults detections for the current signal starting with 0.2 to 0.3second.
Fig. 10 Time-Frequency Represent of open-circuit fault signal using spectrogram
Fig.10 shows the time-frequency distribution used to analyze the performance of the signal. The TFR shows by using spectrogram where the open-circuit fault signal lower switches consist which is 60 Hz and 0 Hz. The result time-frequency represents in red color for highest amplitude and lowest is represent in blue color. The figure also shows the fault occurs at 0.18 to 0.3second at 0 Hz .This technique is used to analyze the performance of the signal after fault occurs.
Fig. 11(a) Instantaneous RMS Voltage, Vrms (pu)
Fig. 11(b) Instantaneous RMS Fundamental Voltage, Vrms (pu)
Fig. 11(c) Instantaneous Average Voltage
Fig. 11(a) shows the RMS voltage decrease starting at 0.15 until 0.3second. After 0.3 second voltage operate in normal condition and fig. 11(c) present the average voltage when fault occur at the lower IGBT.
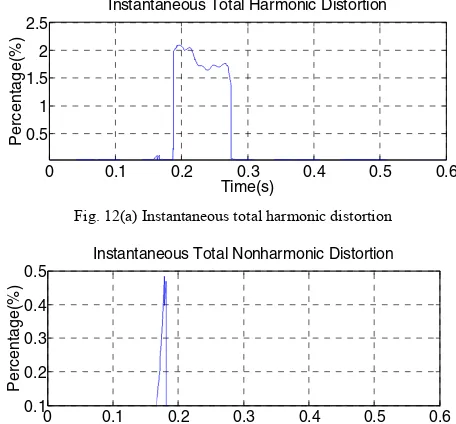
Fig. 12(a) Instantaneous total harmonic distortion
Fig. 12(b) Instantaneous total non-harmonic distortion
0 0.1 0.2 0.3 0.4 0.5 0.6
Open Circuit Fault ( Lower Switches )
Normal Operation Fault Operation Normal Operation
Time(s)
Instantaneous RMS Fundamental Voltage(pu)
0 0.1 0.2 0.3 0.4 0.5 0.6
Instantaneous Total Waveform Distortion
0 0.1 0.2 0.3 0.4 0.5 0.6
Instantaneous Total Harmonic Distortion
0 0.1 0.2 0.3 0.4 0.5 0.6
Instantaneous Total Nonharmonic Distortion
Fig. 12(c) Instantaneous total waveform distortion
Fig. 12(a) - (c) shows the parameter estimation from TFR which is total harmonic distortion (THD), total non harmonics distortion (TnHD), and total waveform distortion (TWD). Fig.12(c) show THD two distortion occurs in this signal at 0.5% and 2% compare with open circuit fault upper. That consist one distortion. The result of TWD is obtained from the total of THD and TnHD. The TnHD occur in this signal as per Fig. 12(b).It means this signal consist of multiple integer and non-multiple integer frequency.
TABLE2
COMPARISON PERFORMANCES OF PARAMETER BETWEEN FAULT CIRCUIT UPPER &FAULT CIRCUIT LOWER
Parameter measures
Normal operation
Upper fault
Lower fault
Vrms(pu) 1.0075 1.0939 1.0918
Vaverage -61.878µ -61.964µ -62.096µ THD 0.0354 2.0916 2.0902 TnHD 0.0312 0.0403 0.4839 TWD 0.0415 2.0916 2.0903
The performance of normal operation, upper fault and lower fault operation are shown in Table 2. The results show that the comparison maximum values of parameter measures in term of RMS voltage, average voltage, THD, TnHD and TWD.
VI. CONCLUSION
As a conclusion, this paper has showed the estimated parameter such as Vrms, THD, TnHD and TWD to identify performance of open-circuit fault detection of VSI. The results are extremely important for monitoring and analysis fault condition and simulation for the open fault of switches in VSI. That also can be classified the upper and lower switches fault in open-circuit switches. The spectrogram technique has advantage of the VSI for gives the better information in term of time and frequency component. Therefore, faults can be detected early through information of performance. Moreover, the presented technique can be easily to reduce the cost maintenance.
ACKNOWLEDGMENT
The authors gratefully acknowledgment the Faculty of Electrical Engineering, University Teknikal Malaysia Melaka for giving the support in this study.
REFERENCES
[1] Qun-Tao An, Li-Zhi Sun, Ke Zhoa, and Li Sun,”Switching Function Model-Based Fast-Diagnostic Method of Open-Switch Fault in Inverters Without Sensors” IEEE Transaction on Power electronics., vol. 26, pp.119-1126, January 2011.
[2] Mohamed Trabelsi, Mohamed Boussak, and Moncef Gossa “PWM-Switching pattern-based diagnosis scheme for single and multiple open-switch damages in VSI-fed Induction motor drives” ISA Transactions, 2012
[3] Jingang Li, Jia Li and Shaocheng Ding “Research on a Novel Method for Improving Inverter Output , Waveforms”,2010.
[4] Shin-Myung Jung, Jin-Sik Park, Hag-Wone Kim, Kwan-Yuh Choa and Myung-Joong Youn “ An MRAS-Based Diagnosis of Open-Circuit Fault in PWM Voltage-Source Inverters for PM Synchronous Motor Drive Systems”, IEEE Transactions on Power Electronics, vol. 28, 2012
[5] K.S. Smith, R.Li, and J.Penman, “Real-Time Detection of intermittent misfiring ina voltage-fed PWM inverter induction-motor,” IEEE Trans.Ind. Electron, vol.44, no.4, pp.468-476,Aug.1997
[6] Y. Yorozu, M. Hirano, K. Oka, and Y. Tagawa, “Electron spectroscopy studies on magneto-optical media and plastic substrate interface.” IEEE
Transl. J. Magn. Japan, vol. 2, pp.740-741, August 1987 [Digests 9th
Annual Conf. Magnetics Japan, p.301, 1982].
[7] R. Peuget, S.Courtine, and J.P.Rognon, Fault detection and isolation on a PWM inverter by knowledge-based model,”IEEE Trans. Ind.Appl.,vol.34,no. 6,pp. 1318-1326, Nov,/Dec. 1998.
[8] B. Biswas, P. Purkait, S. Mandal and D. Mitra, “ Current Harmonics Analysis of Inverter-Fed Induction Motor Drive system under fault Conditions ,” IMECS 2009, 2009
[9] IEEE, “IEEE Recommended Practice for Monitoring Electrical Power Quality,” IEEE Std. 1159-2009
[10] A R Rahim Abdullah, A.Z. Sha’meri, N.A. Mohd Said, N. Mohd Saad, A. Jidin, “ Bilinear Time-Frequency Analysisi techniques for Power
Quality Signals”, Proceedings of the International MultiConference of
Engineers and Computer Scientists 2012,IMECS 2012
[11] A. Kusko, T. Thompson, Power Quality in Electrical Systems. McGraw Hill, 2007
[12] N. Urasaki, T. Senjyu, K. Uezato and T. Funabashi, “Adaptive Dead-Time Compensation Strategy for Permanent Magnet Synchronous Motor Drive”, IEEE Trans. on Energy Conversion, Vol. 22, Issue. 2,pp. 271-280, June 2007
[13] H. J. Bollen and Y. H. Gu, Signal Processing of Power Quality
Disturbances, Wiley-Interscience, 2006
[14] A. R. Abdullah and A. Z. Sha’ameri, “Power quality analysis using linear time-frequency distribution”, Proceedings of IEEE International
Conference on Power and Energy (PECON 2008), pp.313-317, Johor,
Malaysia, December 2008
[15] A. R. Abdullah, A. Z. Sha’ameri and A. Jidin, “Classification of power quality signals using smooth- windowed Wigner-Ville distribution”,
Proceedings of IEEE International Conference onElectrical Machines
and System (ICEMS 2010), pp.1981-1985,Incheon, Korea, Oct. 2010
0 0.1 0.2 0.3 0.4 0.5 0.6
0.5 1 1.5 2 2.5
Time(s)
P
er
c
ent
age(%
)