Virtual Instrument of Harmonics Detection Based on
Neural Network Adaptive Filters
Xianfeng Zheng*1, Zheng Fan2
1
Department of Electrical Engineering,Henan Mechanical and Electrical Engineering College, Henan,453003,China
2
Department of Automatic Control Engineering,Henan Mechanical and Electrical Engineering College, Henan, 453003,China
*Corresponding author, e-mail: [email protected],[email protected]
Abstract
This study investigated the adaptive detection principle based on a single artificial neuron, and constructed a method for detecting harmonics using the artificial neural network technique. Based on the established method, and by comprehensively processing the obtained harmonics data using the LabVIEW software-developing environment of the virtual instrument, the harmonic waves were detected and analyzed. Finally, the analysis of current ball crusher harmonics verified that the designed system was effective.
Keywords: Harmonics Detection, Neural Network, Virtual Instruments
1. Introduction
With the wide application of all kinds of nonlinear power electronic devices, harmonic pollution has become increasingly serious in power networks, resulting in the frequent occurrence of various faults and accidents caused by harmonics occur. To intensify the treatment, management and charge for harmonic pollution, the research on the power harmonics monitoring systems, which are capable of doing real-time, accurate and continuous measures of power harmonics, is of great theoretical and engineering practical significance [1].
2. Detection method for power harmonics based on artificial neural network
Harmonics detection is a key technique of active power filter and harmonic monitoring systems. Only when harmonic currents are accurately detected in real time can they be effectively analyzed, compensated, and inhibited. Existing power harmonics detection includes those methods based on notch filters or bandpass analog filters, Fryze time domain power definition, fast Fourier transforms, the instantaneous reactive power theory of three-phase circuits, simultaneous detection, wavelet transforms, and adaptive filters [2]-[3].
To effectively monitor and eliminate power harmonics and therefore reduce the damage of power harmonics, harmonics detection methods are supposed to present the advantages of low computation amounts, real-time well, high accuracy and reliability, ease of realization, and strong adoptive ability. With these advantages, the fundamental active current, fundamental reactive current, total harmonic current, and the content of each harmonic can be detected simultaneously, which benefits the compensation and analysis of power harmonics. By considering the above requirements and comparing multiple detection methods, the power harmonics detection method based on an adaptive filter was applied in the research. This method not only shows high detection accuracy, but also can perform tracking measurements. Additionally, it exhibits a strong adaptive ability. Therefore, this method presents the best effects, strongest adaptive ability and broadest prospects among the aforementioned power harmonics detection methods [4]-[5].
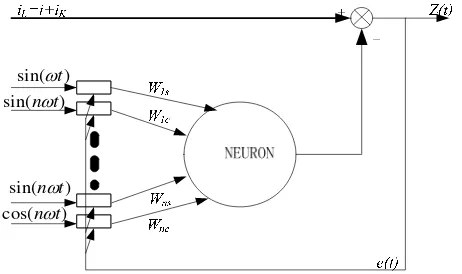
sin(n t) cos(n t)
sin(t) sin(n t)
Figure 1. Detection principle for power harmonics based on signal neuron
When the power voltage us of the single-phase circuit passes through the lock-phase circuit, sin(t) andcos(t) are obtained. Then by increasing the frequency doubling, the sine and cosine signals in the number (2~N) are acquired, which are used as the reference input signals of the single artificial neuron. These linear combinations of the sine and cosine signals are the net inputs of the signal artificial neuron [6]-[7].
The reference input vector X t( ), net input s t( ) , and output y t( ) of the signal artificial neuron are:
( )
[sin
, cos
;
,sin(
), cos(
)]
X t
t
t
n t
n t
(1)2
1
( )
( ) ( )
( )
ni i i
s t
w t x t
t
(2))] ( [ ) (t f s t
y (3)
As y t( )can be obtained by the linear combination of the reference input, the action function of the artificial neuron is f x( )x. Because the alternating current (AC) transmission bus does not contain direct current (DC) components, ( )t is zero. Under this condition:
2
1
( )
( ) ( )
ni i i
y t
w t x t
(4)The least mean square (LMS) algorithm [8] was adopted in the learning rule of the neuron. As the algorithm applies the estimations of the relevant functions of input vectors in the estimation of the instant gradient vectors, the convergence rate is distinctly faster than found in the typical LMS algorithm, with slight computation complexity.
Next, the error feedback signal e t( ) is used to adjust the weight w ti( )
)] 1 ( ) ( [ ) ( ) ( ) ( ) 1
(t w t et x t w t w t
wi i i i i
(5)
Where is the learning rate 0 1, is the damping coefficient, which accelerates
learning rate and reduces vibration0 1.
The concrete procedures are as follows:
1
(
q)
H;
0,1, 2
,
1
n n n N
e
y
W
X
n
N
(6)
Where(Wnq1)H
is the transposed matrix of the qth learning result of the weight vector matrix.
According to the learning rule of the artificial neuron, the weight approaches the optimal value by several iterations. Under this condition, 2
[ ( )]
E e t approaches the minimum value, which
indicates that in the least mean square, the output y t( ) of the neuron optimally approximates the noise interference current i t( ) , while the output z t( ) of the system optimally approximates
the signal i tk( )to be detected. Furthermore, it proves that the weights of each subcircuit adaptive filter optimally approximate the peak values of the sine or cosine signals that correspond to the subcircuit in the noise interference current i(t) [9]-[10]. Therefore, the power harmonics can be detected using the output z t( )of the system or the weight of each sub circuit of the artificial neuron based on the real situation [11].
After obtaining the data of each harmonic, the power network parameters are calculated using the following formulae:
1) The effective value of the nth harmonic:In (ns2 nc2) / 2
2) The phase angle of the nth harmonic: jn arctg W( nc/Wns) 3) Fundamental active power:P1 UI1cos1
4) Fundamental reactive power: Q1 UI1si n1
5) The content of the nth harmonic: HRIn In/I1100%
6) Harmonic content: 2
2
H n
n
I I
7) Total harmonic distortion:THDi IH /I1100%
3. System design and implementation 3.1. Overall structure of the system
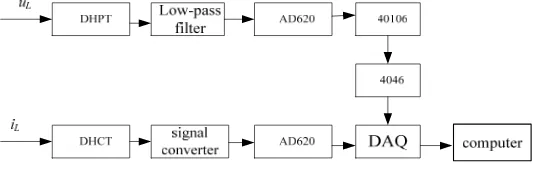
The data acquisition circuit is designed as shown in Figure 2. In the figure, DHPT and DHCT are the micro high-accuracy voltage and current sensors, respectively, and have been designed to perform AC measurements for any voltage below 1000V, current in the range of 1mA to 100A, and frequency in the range of 40 to1000Hz.AD620, as a high-accuracy instrumentation amplifier, has a wide voltage range and good output linearity, and meets the system requirements for input signals by adjusting backward resistors and bias resistors.
Figure 2. Structure of system hardware
the conformity of the output signals and input signals by automatically tracking the frequency variation of input signals in a certain scope.
After the load voltage uL has been transformed by DHPT and filtered by a low-pass filter, the obtained sine signal is amplified using AD620; afterwards, it is shaped using 40206. The signal is then sent into the phase-locked control circuit 4046 to generate an interruption of the rectangular signal, which is synchronous with uL. Therefore, when uL frequency changes, the calculating step size is adjusted correspondingly. It is worth mentioning that the external component of 4046 was designed based on the 50 Hz of the center frequency of the voltage-controlled oscillator.
The load current iL is transformed to AC voltage using DHCT and the signal converter. After being amplified and biased, the AC voltage signal changes from bipolar to unipolar. When it satisfies the requirements of the acquisition equipment, the signal is applied as the one to be detected to extract harmonics data, which will be processed using a computer.
3.2. Software implementation of the system
Software is the core of a virtual instrument. To reduce development efforts and improve the designed system's universality and expansion capabilities, the most successful and widely used software development environment, LabVIEW 2010,was used to comp print statement, rehensively process the collected data. This allowed for the development of an integrated and intelligent detection system for power harmonics, implementing multiple functions, such as real-time detection, display, analysis, prediction, alarm, and protection. The functions are described in detail below:
1) Data acquisition, including the actuation and initialization of data acquisition cards, and the acceptance of acquired data.
2) The realization of adaptive filtering. This refers to using a computer to perform adaptive filtering of the acquired data in order to calculate each harmonic datum in the signal.
3) The display, storage and backup of the data.
4) An exceeding-limit alarm and protection for the data. 5) Data queries, statistics, and print statement.
Because LabVIEW does not have the neural network function, among its functions, the concrete computation of adaptive filtering is realized by CIN nodes, or by MATLAB using the MATLAB interface.
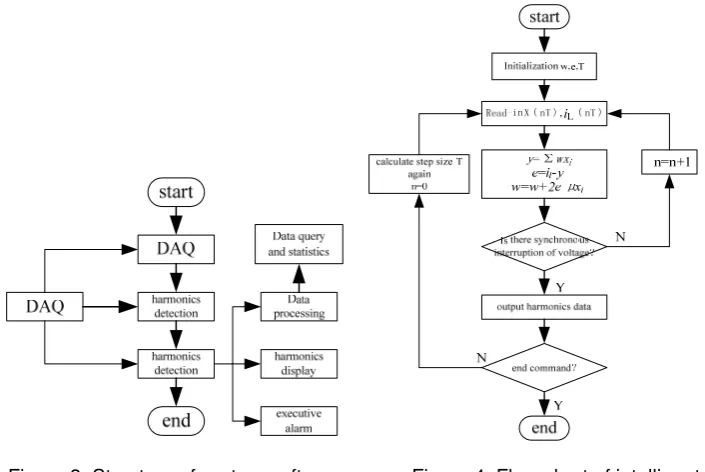
The structure of system software is illustrated in Figure 3.
parts of the software. First of all, harmonics detection was performed for the acquired data using the above adaptive filter algorithm, obtaining the data of each harmonic, as displayed in Figure 4. Afterwards, based on the received harmonic weight, the power network parameters, including the effective value of the nth harmonic, phase angle, fundamental active power and fundamental reactive power, content of the nth harmonic, the harmonic content, and total harmonic distortion were analyzed and displayed using display module. Considering the necessary legibility and intuition characteristics of the data, harmonics data are usually displayed in the form of graphs. Therefore, the LabVIEW software's Waveform Graph control was used to show the effective value and content of harmonics. The prototype waveform, fundamental waveform, harmonic waveform, fundamental active power, fundamental reactive power, and total harmonic distortion were displayed using the Waveform Chart control, and the effective value and content of harmonics were presented using a histogram while other data were displayed using linetypes.
4. Operation test
After finishing the design, operation tests were conducted for the power utilization of a micro-powder plant. The major load in the tests was a ball crusher that was 2.2m in diameter; its sampling frequency was 4.8 kHz, and the sampling lasted for 100mS, which lasted for about 5 fundamental wave periods. The above LMS algorithm was used for learning; the forgetting factor wasu0.99, and the constant was0.01.
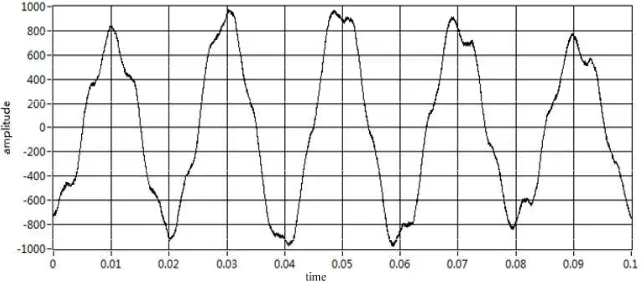
By using the online monitoring system for power quality, the a-phase current waveform of the ball crusher in normal operation was obtained, as demonstrated in Figure 5 and Figure 6.
Figure 5. Current waveform of the ball crusher
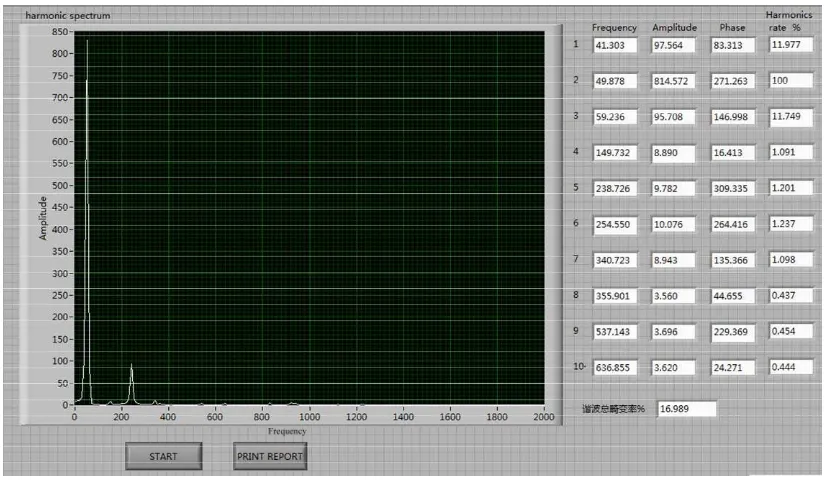
By using the above method, 19 sine components were acquired in the current signal of the ball crusher; the estimations of the current parameters of the ball crusher are displayed in Table 1.
Table 1 Estimated results of current harmonics of the ball crusher
Serial number Frequency /Hz Amplitude Phase Harmonic rate 1 2 3 4 5 6 7 8 9 10 11 12 13 14 15 16 17 18 19 41.303 49.878 59.236 149.732 238.726 254.550 340.723 355.901 537.143 636.855 830.039 923.974 940.699 1121.311 1223.168 1784.413 1859.637 1930.749 2076.858 97.564 814.572 95.708 8.890 9.782 10.076 8.943 3.560 3.696 3.620 5.400 5.774 4.102 2.154 2.624 0.244 0.503 0.255 0.288 83.313 271.263 146.998 16.413 309.335 264.416 135.366 44.655 229.369 24.271 59.590 95.024 235.142 343.700 255.472 239.325 36.540 128.600 46.854 11.977% 100% 11.749% 1.091% 1.201% 1.237% 1.098% 0.437% 0.454% 0.444% 0.663% 0.709% 0.504% 0.264% 0.322% 0.030% 0.062% 0.031% 0.035% THD 16.989%
Limited by screen space, Figure 7 shows specific data of 10 harmonics with their minimum frequencies, which were directly displayed on the user interface, while the others were printed in a statement.
Figure 7. User interface of the comprehensive detection system for harmonics
source, writing the operating command, and executing the command. Therefore, the database structure has to be determined first, based on which database and data source were established. Afterwards, the function nodes of SQL Toolkit were adopted to connect and operate the data source, thus effectively managing harmonics data.
According to the function requirements of the system, the constructed database contains five data tables that store the monitoring parameters, normal operation power network parameters, power network parameters before and after a fault, power network parameters before and after an alarm, and power network parameters before and after a trip. The last four instances apply the date (year, month, and day) as the primary key and index, which is convenient for the query, statistics, backup, clearing, and recovery of the database.
5. Conclusions
Test results verified that the system performed well, realizing all the functions in demand analysis and the expected design objective. Compared with most existing monitoring systems for power harmonics, the system developed in this paper exhibited the following advantages:
- It detected specified harmonic by changing parameters online;
- By adopting the adaptive power harmonics detection method based on a single artificial neuron, the system responded quickly with high detection accuracy and strong adaptive ability;
- The comprehensive monitoring system demonstrates strong functions, high flexibility, good openness and expandability through use of LabVIEW;
- Its cost is low and therefore can be popularized on a larger scale.
- In conclusion, the integrated and intelligent monitoring system for power harmonics designed in this paper presents broad application prospects.
References
[1] Xu Z, Wakileh GJ. Power System Harmonics: Fundamentals, Analysis and Filter Design. China Machine Press. 2003.
[2] Wakileh GJ. Harmonics and rotation machines. Electric Power Systems Research. 2003; 66: 5-14. [3] Y Kusuma L, YP Obulesu. Unified Power Quality Conditioner for voltage sag and harmonic mitigation
of nonlinear loads. TELKOMNIKA (Telecommunication Computing Electronics and Control). 2011; 1(1): 65-74.
[4] Soo HC, Gilsoo J. Time-frequency analysis of power-quality disturbances via the Gabor-Wigner transform. IEEE Transactions on Power Delivery. 2009; 25(1): 494-499.
[5] Han Y, Xu L, Muhammad MK. Robust deadbeat control scheme for a hybrid APF with resetting filter and Adaline-based harmonic estimation algorithm. IEEE Transactions on industrial electronics. 2011; 58(9): 3893-3902.
[6] Y Kusumalatha, Ch Saibabu. Harmonics Mitigation of Industrial Motor Drives with Active Power Filters in Cement Plant-A Case Study. TELKOMNIKA (Telecommunication Computing Electronics and Control). 2012; 2(1): 1-8.
[7] Kusljevic MD. Simultaneous frequency and harmonic magnitude estimation using decoupled modules and multirate sampling. IEEE Transactions on Instrumentation and Measurement. 2010; 59(4): 954-962.
[8] Barros J, Diego RI. Application of the wavelet-packet transform to the estimation of harmonic groups in current and voltage waveforms. IEEE Transactions on Power Delivery. 2006; 21(1): 533-535. [9] Huang L, Wu S, Li X. Redueed-rank MDL method for source enumeration in high-resolution array
Proeessing. IEEE Transactions on Signal Proeessing. 2007; 55(22): 5658-5667.
[10] Suresh M, Anup KP. PI and fuzzy logic controller based 3-Phase 4-Wire shunt active filters for the mitigation of current harmonics with the id-iq control strategy. Journal of Power Electronics. 2011; 11(6): 914-921.