Simulation of Air Flow Distribution in a Tray Dryer by CFD
S. MISHA
1,2,*, S. MAT
1, M.A.M. ROSLI
1,2, M. H. RUSLAN
1,
K. SOPIAN
1, E. SALLEH
11
Solar Energy Research Institute, Universiti Kebangsaan Malaysia,
43600 Bangi, Selangor, Malaysia
2
Faculty of Mechanical Engineering, Universiti Teknikal Malaysia Melaka,
Hang Tuah Jaya, 76100 Durian Tunggal, Melaka, Malaysia
*[email protected]
Abstract: - Application of tray dryer is widely used in agricultural drying because of its simple design and
capability to dry products at high volume. However, the greatest drawback of the tray dryer is uneven drying because of poor airflow distribution in the drying chamber. Implementing the proper design of a tray dryer system may eliminate or reduce non-uniformity of drying and increases dryer efficiency. This This study investigates the airflow distribution throughout the drying chamber by using Computational Fluid Dynamics simulation for kenaf core drying. The experimental and simulation data exhibit very good agreement. The drying rate of dried products in each tray was predicted using the validated data. The result shows that, the higher the air velocity, the higher the drying rate of the products. The alternate arrangement of tray position was adopted to ensure that all trays are exposed directly to drying air and to improve airflow distribution throughout the drying chamber. There was a variation of final moisture content for product at different columns. As the distance of product far from the air inlet, the air velocity decreased. However the uniformity of air flow distribution to each level of product at the same column are acceptable.
Key-Words: - Tray dryer, drying simulation, kenaf core drying.
1 Introduction
Tray dryers are the most widely used dryers for various drying applications because of their simple design and low cost. The main drawback of this dryer is the non-uniformity of the final moisture content of the dried product [1]. In a conventional tray dryer, the hot air inlet is usually located at the bottom and the air passes through the others trays. Thus, the products located on the bottom trays are more dried than those on the upper trays, which are subjected to decreased temperature and air velocity. Generally, drying air temperature and velocity significantly affect drying rate [2],[3].
Measuring the drying parameters in the drying chamber is expensive, difficult, and time consuming because sensors and data loggers have to be installed in several positions, particularly in a large-scale dryer. CFD simulation is used extensively in drying analysis because of its ability to solve systems of differential equations for the conservation of mass, momentum, and energy with the use of advanced numerical methods to predict temperature, velocity, and pressure profiles in the drying chamber.
Mathioulakis et al. [4] developed an industrial batch-type tray dryer for drying fruits. They used CFD simulation to predict the air velocity profiles in
the drying chamber and found that the final moisture content in several trays was not uniform. Comparison of the CFD simulation result and the experimental data revealed a strong correlation between drying rate and air velocity. Margaris and Ghious [5] studied the numerical simulation inside a drying chamber. A set of measurements was obtained experimentally above a single tray to validate the model. The validation of the measured data and the simulation results through CFD showed that the standard k–e model is the most adequate turbulence model.
2 Method and simulation
2.1 Dryer system
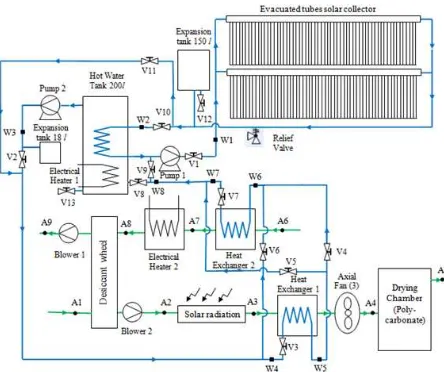
The industrial scale of solar assisted solid desiccant dryer was designed and developed to investigate system performance and drying uniformity in the drying chamber. The experiment setup has been discussed by Misha et al. [8]. However some improvement have been carried out to produce better drying air condition. The new schematic diagram of the experimental setup as shown in Fig. 1. The suggestion of dryer system improvement to connect solar collector directly to heat exchanger 1 and 2 were obtained from the previous work [9].
Fig. 1 Schematic diagram of the experiment
The design of the drying chamber is shown in Fig. 2, and includes seven layers of trays, with each layer comprising six trays with dimensions of 64 cm x 92 cm each, for a total of 42 trays. When viewed from the side, only 21 trays are visible, with the remainder visible on the other side. The drying chamber is designed symmetrically from the top view. The sensors are installed only at the right side, assuming that values from the left side are the same, owing to this symmetry. The volume of the drying chamber is 1.7 m (height) x 2 m (width) x 3 m (length). The wall of the dryer system was constructed using 6-cm thick hollow polycarbonate with a hollow space in the middle, 4 cm deep. The top roof is made of glass. The middle trays were positioned between the trays in the first and third columns. This tray arrangement was adopted to ensure that all trays are exposed directly to drying air and to improve airflow distribution throughout the drying chamber. In a conventional arrangement (straight position), the trays in the first column blocks the drying air from the trays in the second
and third columns, which reduces drying performance.
Fig. 2 Drying chamber design.
Five positions (A10 to A14) in the drying chamber were selected randomly to be installed with velocity, temperature, and humidity sensors, as shown in Fig. 3. The inlet (A4) and outlet (A5) of the drying chamber were also installed with the same type of sensors. The load cell was also installed to trays 4, 9, 11, 13, and 18 to monitor weight loss. The detailed specifications of the sensors are shown in Table 1. The sensors at others position were not discussed because the focus of this paper is only on airflow distribution in the drying chamber.
Fig. 3 Sensors position and flow diagram of drying air
Table 1 Characteristic of measuring instruments No Instruments Properties Range Accuracy Uncertainty
1 Air humidity sensor
0-10V, 4-20mA
5 - 95% RH
±3% ±1%
2 Temperature sensor (IC AD595C)
10mV/oC -55 - 125 ±1oC ±0.75
3 Velocity sensor
1mV/m/s 0.4 - 30 m/s
±(2%+0.1 mV)
4 Load cell 2mv/V 0 - 10 kg ±0.02 kg ±0.012 kg
2.2
Material
The kenaf core fiber was supplied by the Lembaga Kenaf and Tembakau Negara (LKTN). The sample of the kenaf core fiber is a very light material with a density of approximately 100 kg/m3. The total weight of the sample in all trays is approximately 155 kg. The core fiber is dried without the outer layer and was chipped. The thickness of the product on the tray is approximately 6 cm. The initial moisture content was determined by oven-drying at 105 °C until constant weight was obtained. The average initial moisture content of the sample was approximately 55% wet basis.
2.3
Basic governing equations for CFD
simulation
The mass, momentum and energy conservation of drying air result in the continuity, Navier-Stokes and energy equation, respectively [11]. The turbulent model is used in this CFD simulation. The turbulent kinetic energy, k, and its rate of dissipation, ε, are calculated from the following transport equations :
Convective heat and mass transfer modeling in the k -ε models is given by the following equation [12]:
Product trays are assumed to be porous media for airflow. Porous media are modeled by adding a momentum source term to the standard fluid flow equations. The source term is composed of two parts: a viscous loss term and an inertial loss term.
2.4
Simulation details
The numerical finite volume method used in Fluent
14.0 was used to solve Eq. (1) to (4) and to build a numerical model based on an unstructured 3D mesh using tetrahedral cells. The simulation was conducted under steady state condition because the study focused on the pattern of the air stream in the drying chamber. The boundary conditions are shown in Fig. 4. The boundary conditions were set up as follows:
• Inlet 1: The air mass flow rate was 0.29 kg/s (approximate velocity of 1.5 m/s normal to air inlet), and the air temperature was 52 °C. • Inlet 2: The air mass flow rate was 0.145
kg/s (50% of inlet 1 but has the same velocity of 1.5 m/s), and the air temperature was 52 °C.
• Outlet: The gauge pressure was assumed to be equal to 0 at the outlet.
• Porous media: The trays were assumed to be porous with 10% porosity.
• Wall: The heat transfer coefficient of the
chamber wall is 4 W/(m2K) and
environmental conditions were defined. The environmental temperature was assumed to be 34 °C, and the temperature at the roof top is 43 °C (contact with the heat source from radiation). The bottom surface was assumed to have no heat loss. Only half of the drying chamber was analyzed because its shape was made symmetrical by defining the symmetry surface to the middle boundary.
Fig. 4 Drying chamber layout and boundary conditions.
3 Result and Discussion
dryer achieve moisture content below 15% by remove the dried product (first tray) and shift the second and third trays to the front position. However for the validation purpose, only the first experiment data required because at the initial stage all the products have similar moisture contents. The reduction of moisture contents for five trays as shown in Fig. 5.
Variations of final moisture content were observed along the experiment. The highest drying rate was at tray 4 and is followed by trays 13, 11, 9, and 18. The average inlet air velocity at point A4 is 1.5 m/s and the average outlet air velocity at point A5 is approximately 8.9 m/s. The sensors were installed approximately 3 cm from the product level in the tray and the position can’t be adjusted to the higher position. The drying air in this region should carry moisture because of its proximity to the product.
Fig. 5 Moisture contents against time
It was found that, the tray at the first column, which is close to the air inlet, was experience higher air velocity, followed by the second and third columns. When the moisture content of the sample is high, the drying rate is strongly influenced by air velocity. The drying rate for trays number 9, 11, and 13 is approximately the same because all trays were located at second column.Tray 18 only achieved 39% moisture content at the end of the experiment. The variation of final moisture contents for selected trays as shown in Table 2. the performance of the dryer system is not discussed in this paper. 3D CFD simulation was conducted to predict the airflow distribution in the drying chamber because the result of a 2D simulation would not represent the real problem, as discussed by Misha et al. [13]. The product was assumed to be porous with 10% porosity. The anemometers were installed at the end of trays 4, 9, 11, 13, and 18 (sensor positions A10 to A14) for validation purposes. Unfortunately, the velocity was not recorded at all points because the anemometer range was 0.4 m/s to 30 m/s. The average air velocity at all points were lower than 0.4 m/s. The outlet velocity (A5) was recorded with an average of 8.9 m/s.
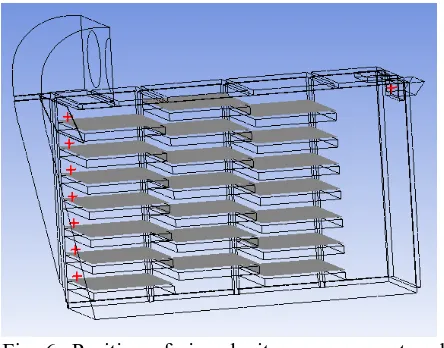
Since only one positions of the velocity can be validated (exit channel), manual measurements were carried out at the fronts of trays in column one (parallel to the center of fan 1) as shown in Fig. 6. These positions are located in the middle between upper and lower trays. However, the value of velocity at tray 2 and 3 can’t be measured since the value is below 0.4 m/s. The value of measurement data and simulation result for all locations are shown in Table 3. The simulation values for all points were within the range of anemometer accuracy. Therefore, the simulation results are highly consistent with the experimental data.
Table 3 Velocity of experimental and simulation result
As shown in the Fig. 7, the product with the higher drying rate has higher air velocity as expected. The straight line represents the relation between these two parameters, with a high R-squared value of
0.96. The equation for the straight line is given by
y=2.705x-0.235 (5)
where y is the predicted drying rate and x is the air velocity from the simulation result.
Fig. 6 Position of air velocity measurement and plane above the trays
Table 4 Prediction of drying rate
Tray positions
Average velocity from simulation result (m/s)
Drying rate (kg/h)
Prediction of drying rate (kg/h)
Percentage of error
(%)
4 0.26 0.48 0.47 2.08
9 0.22 0.34 0.36 5.88
11 0.20 0.32 0.31 3.13
13 0.21 0.32 0.33 3.13
18 0.18 0.26 0.25 3.85
Average percentage of error 3.61
The values of the actual and predicted (using equation) drying rates are shown in Table 4. The average percentage error was extremely small and acceptable. Therefore, the drying rate at the other tray positions can be predicted by using Eq. (5). The graph in Fig. 8 shows the air velocity from the simulation and the predicted drying rate. The simulation result shows that the highest air velocity was at tray 1 and 7 because of the additional baffle and incline wall that channels the air to the each tray level. Without the baffle, less air was channeled to the top tray and lower air velocity was produced. The simulation without a baffle was conducted to predict air flow in the drying chamber [15]. The
drying rate of the dried products are depend on the air velocity. The product with higher average air velocity has lower moisture content (Table 2).
Fig. 7 Drying rate against velocity from simulation.
Fig. 8 Velocity from simulation and predicted drying rate for each tray.
Such findings also show that the incline wall at the inlet contributed to the uniform distribution of hot air to each tray level. The 3D simulation result of the air stream is shown in Fig. 9. In this study, air flow was produced by the axial fan at 1.5 m/s, which is considered high velocity and not influenced by temperature. Therefore the simulation was conducted under steady state condition. In a natural flow, air flow is depends on the temperature gradients in the air.
Fig. 9 3D streamline in the drying chamber.
4 Conclusion
A kenaf core drying experiment using a solar-assisted solid desiccant dryer was performed under average solar radiation of 834 W/m2. CFD simulation was used to predict air flow distribution in the drying chamber by considering the product as porous media. The experimental and simulation data were in good agreement. The drying rate of the product was significantly influenced by the average air velocity above the tray. The higher the average air velocity, the higher the drying rate of the products. As the distance of product far from the air inlet the air velocity decreased. However the uniformity of air flow distribution to each level of product at the same column are acceptable. The alternate arrangement of tray position was adopted to ensure that all trays are exposed directly to drying air. Since the products that close to the air inlet were dry earlier, therefore drying using semi-continuous mode was recommended to shorter the drying time.
Acknowledgement
The authors would like to thank the Solar Energy Research Institute, Universiti Kebangsaan Malaysia, as well as Universiti Teknikal Malaysia Melaka and Kementerian Pendidikan Malaysia for sponsoring this work under Grant PRGS/1/12/TK07/UKM/02/2
References:
[1] S. Misha, S. Mat, M.H. Ruslan, K. Sopian and E. Salleh, Review on the application of a tray dryer system for agricultural products, World
Applied Sciences Journal, Vol. 22, No. 3, 2013,
pp. 424–433.
[2] F. Pinaga, A. Mulet, A. Berna and M. Borras, Effect of air flow rate on carrot drying, Drying
Technology, Vol. 5, No. 2, 1987, pp. 245–258.
[3] V.G. Belessiotis, and V.T. Karathanos, Sun and artificial air drying kinetics of some agricultural products, Journal of Food
Engineering, Vol. 31, No. 1, 1997, pp. 35–46.
[4] E. Mathioulakis, V.T. Karathanos and V.G. Belessiotis, Simulation of air movement in a dryer by computational fluid dynamics: Application for the drying of fruits, Journal of
Food Engineering, Vol. 36, 1998, pp.183–200.
[5] D.P. Margaris, and A.G. Ghiaus, Dried product quality improvement by air flow manipulation in tray dryers, Journal of Food Engineering, Vol. 75, 2006, pp. 542–550.
[6] S. Misha, S. Mat, M.H. Ruslan, K. Sopian and E. Salleh, The Effect of Drying Air Temperature and Humidity on the Drying Kinetic of Kenaf Core, Applied Mechanics and
Materials, Vol. 315, 2013, 710–714.
[7] S. Misha, S. Mat, M.H. Ruslan and K. Sopian, Review of solid/liquid desiccant in the drying applications and its regeneration methods,
Renewable and Sustainable Energy Reviews,
No. 16, 2012, pp. 4686–4707.
[8] S. Misha, S. Mat, M.H. Ruslan, E. Salleh, and K. Sopian, Performance of a solar assisted solid desiccant dryer for kenaf core fiber drying under low solar radiation, Solar Energy, No. 112, 2015, pp. 194-204.
[9] S. Misha, S. Mat, M.H. Ruslan, K. Sopian, E. Salleh, and M.A.M. Rosli, Performance Test of Solar Assisted Solid Desiccant Dryer, 8th
WSEAS International Conference on Renewable Energy Sources (RES’ 14), Kuala
Lumpur, Malaysia, 23 -25 April 2014.
[10]T. Norton and D.W. Sun, Computational fluid dynamics (CFD) – an effective and efficient design and analysis tool for the food industry: A review, Trends in Food Science &
Technology, Vol 17, 2006, pp. 600–620.
[11] O. Yongson, I.A. Badruddin , Z.A. Zainal, and P.A Aswatha Narayana, Airflow analysis in an air conditioning room, Building and
Environment, Vol. 42, 2007, pp. 1531–1537.
[12] S. Misha, S. Mat, M.H. Ruslan, K. Sopian, and E. Salleh, Comparison between 2D and 3D simulations of a tray dryer system using CFD software, World Applied Sciences Journal, Vol. 29, No. 10, 2014, pp. 1301–1309.
[13] S. Misha, S. Mat, M.H. Ruslan, K. Sopian, and E. Salleh, The CFD simulation of tray dryer design for kenaf core drying, Applied
Mechanics and Materials, Vol. 393, 2013, pp.
717-722.
[14] S. Misha, S. Mat, M.H. Ruslan, K. Sopian, and E. Salleh, The prediction of drying uniformity in tray dryer system using CFD simulation,