COMPLEX ARCHAEOLOGICAL PROSPECTION USING COMBINATION OF
NON-DESTRUCTIVE TECHNIQUES
M. Faltýnová a, *, K. Pavelkaa, P. Novýb, J. Šedinaa
aDepartment of Mapping and Cartography, Faculty of Civil Engineering, Czech Technical University in Prague, Czech Republic (martina.faltynova, karel.pavelka, jaroslav.sedina)@fsv.cvut.cz
b Museum of Central Bohemia, Roztoky, Czech Republic [email protected]
Commission VI, WG VI/4
KEY WORDS: shaded relief, ground-penetrating radar, aerial laser scanning, RPAS, aerial photogrammetry
ABSTRACT:
This article describes the use of a combination of non-destructive techniques for the complex documentation of a fabulous historical site called Devil’s Furrow, an unusual linear formation lying in the landscape of central Bohemia. In spite of many efforts towards interpretation of the formation, its original form and purpose have not yet been explained in a satisfactory manner. The study focuses on the northern part of the furrow which appears to be a dissimilar element within the scope of the whole Devil’s Furrow. This article presents detailed description of relics of the formation based on historical map searches and modern investigation methods including airborne laser scanning, aerial photogrammetry (based on airplane and RPAS) and ground-penetrating radar. Airborne laser scanning data and aerial orthoimages acquired by the Czech Office for Surveying, Mapping and Cadastre were used. Other measurements were conducted by our laboratory. Data acquired by various methods provide sufficient information to determine the probable original shape of the formation and proves explicitly the anthropological origin of the northern part of the formation of the archaeological community. The higher interest in ecological, ethical, demographical and other issues demanded complex understanding of large sites instead of focusing on detailed excavations. From this point of view, non-destructive approaches were suitable, since they are easily applicable to large areas and in comparison to traditional archaeological techniques, cause minimal or no damage to the investigated archaeological source (Kuna et al., 2004).
One of the most frequently mentioned techniques for archaeological prospection in the last few years has been airborne laser scanning (ALS). The increasing use of ALS data for heritage landscape assessment (Kuna et al., 2004; English Heritage, 2011) is connected to the rapidly growing availability of these datasets during the past decade. Another widely used technique is aerial photography, which was for decades an invaluable tool for archaeological prospection. Many valuable historical sites were found and mapped using aerial photography; however, the application of this tool is limited to deforested areas. The greatest advantage of the ALS technique compared to aerial photography lies in its potential to discover objects covered in high dense vegetation via laser beams, which are able to penetrate even dense vegetation. Archaeological features localized by these widely applicable techniques can be than investigated in detail by other non-destructive geophysical techniques on site, e.g. magnetometry or ground-penetrating radar.
The following paragraphs describe a complex archaeological prospection using a combination of mentioned non-destructive techniques; a site called Devil’s Furrow was chosen for the case study.
1.2 Devil’s Furrow in Literature
Northwest from the town Kouřim, in the landscape between the
villages Lipany and Chotouň, lies the relics of an unusual linear
formation. This formation has been from time to time related to the fabulous Devil’s Furrow, which has been under historical and archaeological prospection for the last few decades. According to medieval legend described in an amount of sources since 16th century, St. Prokop furrowed the formation from the village town Sázava to the village Chotouň (or in the
opposite direction – depending on the source) by the devil. The formation has, during centuries, almost disappeared, but the traces of it are still visible in the landscape. In spite of many efforts towards an interpretation of the formation, its original form and purpose have not yet been explained in a satisfactory manner.
At the beginning of 20th century, the Devil’s Furrow was described in detail by Miškovský (1903); according to his interpretation the formation could be a relic of an old pathway or an administrative boundary. The interest in the Devil’s Furrow decreased for the next hundred years until Bernat and Štědra (2003), during archaeological prospection around town
Sázava, pointed to an unsolved situation around Devil’s Furrow. Authors presented a hypothesis that the Devil’s Furrow is a relic of a prehistoric pathway. The hypothesis by Bernat and Štědra was based partly on a terrain formation which is located
south of the Moštice grange (southern part of the furrow) and it has not yet been confirmed.
Field surveys, literature searches and map searches in the last few years enabled us to divide the area of Devil’s Furrow into three parts, according to the prevailing origin of each part (natural processes or human activity). The natural origin of the southern part of the furrow was verified in 2013. The verification is based on a DTM analysis and it is described in detail in our previous work (Faltýnová et al., 2013). The current study focuses on the northern part.
1.3 Current State visible on available ortophotomaps. According last findings (Štuka; Nový, 2014a) the linear formation is much longer than was earlier expected and the hypothesis about old pathway has been preliminarily rejected. The origin and the purpose of the formation still remain hidden despite the fact that its existence is documented up to the 10th century.
2. METHODOLOGY AND TECHNIQUES
The aim of this work was to map the current state of the formation, reconstruct the original size and shape and estimate according acquired information, the origin of the formation. At first, available historical maps were collected – maps from Austrian military surveys, maps of a stable cadastre and actual cadastre maps, which help us to document the changes of the formation during time.
The next step was mapping the current state of the formation – its surface and parts hidden under the surface. As a main source for the information about terrain surface, the airborne laser scanning dataset, provided by the Czech Office for Surveying, Mapping and Cadastre, was used. Also, ortophotomaps were considered a valuable source, since most parts of the formation are situated in deforested areas, where aerial photogrammetry shows its strength. Objects hidden under the soil surface of fields can be visible on aerial maps due to vegetation indices. Ortophotomaps can help to map the position of a hidden objects but not its altitude.
The last step was to complement the data sources by our own visual prospection and measurements on site. We used ground-penetrating radar to get the idea about the altitudes of objects hidden under the soil surface and measured profiles on selected positions based on ortophotomaps. RPAS (Remotely Piloted Aircraft System) was used to achieve a high-resolution ortophotomap and DSM (Digital Surface Model).
2.1 Airborne Laser Scanning
In our project, we used data acquired by the Czech Office for Surveying, Mapping and Cadastre (COSMC). Between the years 2010 and 2013 the entire area of the Czech Republic was mapped by ALS (full-waveform scanner RIEGL LMS 680 was used). Investors of this project were the Czech Office for Surveying, Mapping and Cadastre, the Ministry of Defence and the Ministry of Agriculture of the Czech Republic. This dataset is being used to obtain a highly accurate digital terrain model for the purposes of administration, for example in the detection of flooded areas, orthorectification of areal images etc.
Parameters for scanning were set to gain a point cloud with a density of about 1 point/m2 and with a side overlap of adjacent strips of about 50%. Different parameters were used depending on the season - during spring an average flying height of approximately 1400m above ground level and a flight lines distance of about 830m while during the vegetation season an average flying height of approximately 1200m above ground level and a flight lines distance of about 715m. Typical product of this mapping is a DTM in the form of a regular grid or an irregular point cloud. Further details about using this dataset in archaeology can be found in (Dušánek, 2011).
The dataset in the form of an irregular point cloud was used in the study. Standard deviation of the point altitude is 0.18m in uncovered terrain and 0.30m in forested areas.
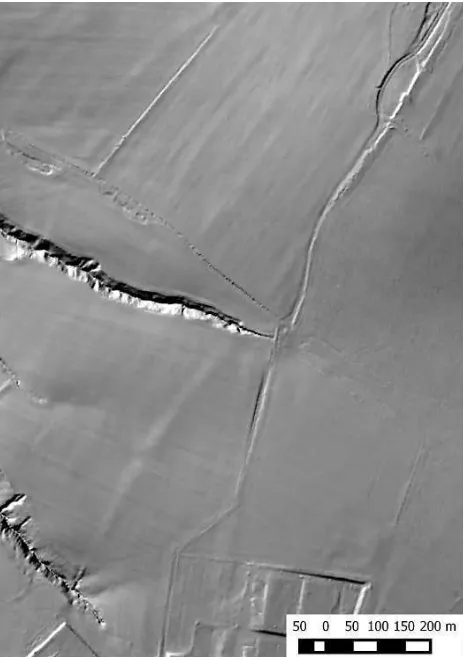
Figure 1. Shaded relief
2.2 Ortophotomaps
The visibility of vegetation indices on ortophotomaps and aerial images depends on many aspects – season, daytime, type of vegetation, rainfalls etc. (Kuna et al., 2004). Therefore, the visibility factor of the same object varies between ortophotomaps from different periods. While mapping one object, it is suitable to prospect more datasets from different periods. Available ortophotomaps were visually prospected. The COSMC provides regular aerial imaging of whole country. Since year 2012 every year ½ of the Czech Republic is being mapped. The dataset of ortophotomaps is available through web map services. Besides that, other orthophotomaps are provided by private subjects free online and historical ortophotomaps from the 1950s are accessible through public services.
2.3 Remotely Piloted Aircraft System
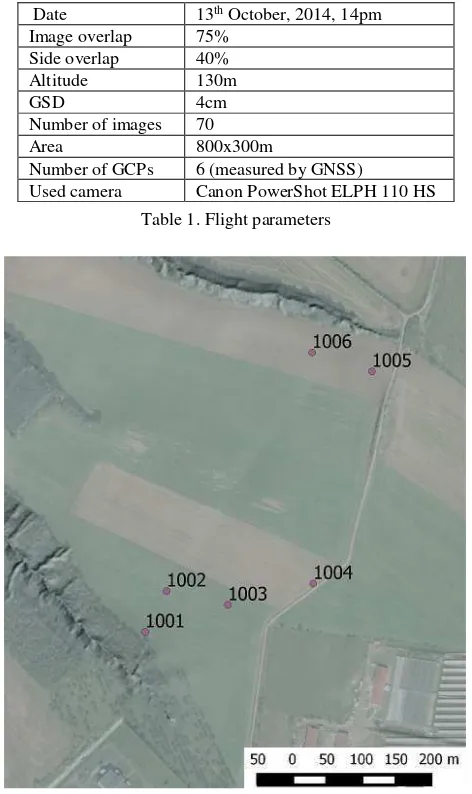
The complementary prospection on site was done by the Remotely Piloted Aircraft System (RPAS) eBee. It is an autonomous system for capturing images in the visible or NIR (Near-infrared) spectrum. The parameters of imaging are summarized in Tab.1. The NIR camera was used during flight surveys because NIR images are successfully used in archaeology thanks to its sensitivity to vegetation conditions. (Verhoeven, 2012). The position and altitude of six Ground Control Points (GCPs) were surveyed by GNSS receiver (Fig.2).
Image processing was accomplished according to the following workflow in Agisoft PhotoScan:
- Image import
- Image alignment (automatic) - GCPs import and marking
- Tie point filtration and bundle adjustment - Creation of a dense point cloud
- Mesh creation - Ortophoto export
- DSM export
The outputs of RPAS imaging was detailed ortophotomap (spatial resolution 10cm, NIR spectrum) and Digital Surface Model (DSM).
Date 13th October, 2014, 14pm Image overlap 75%
Side overlap 40%
Altitude 130m
GSD 4cm
Number of images 70
Area 800x300m
Number of GCPs 6 (measured by GNSS)
Used camera Canon PowerShot ELPH 110 HS Table 1. Flight parameters
Figure 2. Ground control points
2.4 Ground Penetrating Radar
Ground-penetrating radar allows us to detect changes in soil quality (e.g. compaction, material, heterogeneous objects).
On site measurement with ground penetrating radar GPR SIR – 3000 was accomplished in profiles perpendicular to part of the linear formation known from ortophotomaps. Positions of profiles are displayed on Fig. 3 (on each position three profiles were measured to avoid the possible influence of local objects). Radar data was processed using software Radan (Fig. 4).
Figure 3. Position of measured cross sections
Figure 4. Cross section B – 2 (Radan software)
3. ANALYSIS
3.1 Available datasets
The first impulse for the study was the localization of a linear formation on a field south of the village Lipany confirmed by Štuka (2012). This linear part, recently recognized on ortophotomaps, differs from the rest of the Devil’s Furrow by its orientation to the northeast instead of north. It continues through the village Lipany in a northeast direction to Chotouň
as a more or less visible double line. From this point of view, the most valuable ortophotomap is from 2003 (Fig. 5). There are two clear lines visible in a distance of 8-9m which start in a forested clough (left bottom corner of Fig. 5) and lead to Lipany The International Archives of the Photogrammetry, Remote Sensing and Spatial Information Sciences, Volume XL-5/W7, 2015
Figure 5. Ortophotomap (@Geodis, 2003)
Mountain and further to a mound near Chotouň. In the closeby
neighbourhood village of Lipany, the lines are replaced by a road of the same direction (right top corner, Fig 5.).
More details about the formation was hidden in historical maps, the most important being the Imperial Imprint of the Stable Cadastre. Mapping from the first half of a 19th century depict the field border formation as a high and wide rampart which in the northern part merges into the natural clough used by the pathway.
The formation was still visible in a historical ortophomap (1950s) and a map of the Cadastre of Lands (Fig. 6). After that, the rampart was systematically destroyed by ploughing due to land consolidation in the 1950s.
Its position and current form was confirmed by the Digital Terrain Model (DTM) based on ALS data. The formation was highlighted by shaded relief (Fig. 1). Shaded relief (also called hill-shading) is a well-known method which simulates the cast shadow thrown upon the represented surface; it produces an appearance of three-dimensional space and can visualize terrain discontinuities typical for man-made objects. The formation has (in the DTM) the form of a soft rampart approximately up to 40m wide and 0.5m high. The part of the rampart hidden in the forest (profile A, Fig. 3) stays in a form close to the original. Next, a difference DTM was used to highlight more details. This method is inspired by methods applied by Doneus and Briese (2006) and Bofinger and Hesse (Cowley, 2011). Doneus and Briese used a simple difference map between the DTM and its low pass or median filtered derivative, contrary to Bofinger and Hesse, who created the smoothed DTM in two steps to get more reliable elevations of small features over terrain. Smoothed DTM was created and subtracted from the original DTM. This DTM was then visualized in the form of a height image. The height differences were transformed linearly into gray-scale. Afterwards, the image histogram was stretched (the values 0/255 were set to higher/lower values than the extreme
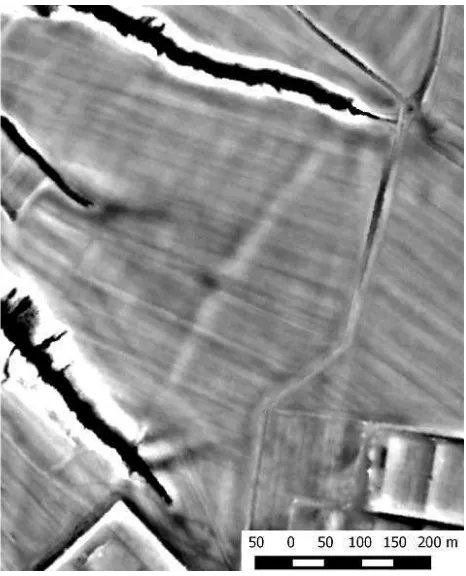
values were). This procedure highlighted the gap in the rampart (in the middle of the field, Fig. 7).
Figure 6. Historical ortophotomap and cadastal map
Figure 7. Difference DTM
3.2 On site prospection
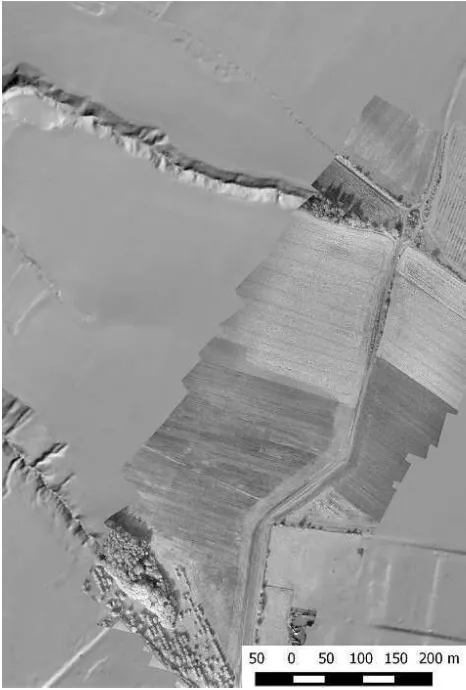
On site prospection was done in 13th October. The aim of RPAS imaging was an acquisition of a detailed ortophotomap and DTM production. The prospected area consists of a field (majority) and a forest (minority). A field without vegetation cover was expected, but unfortunately the field was partly sown with grown vegetation and partly before ploughing. Conditions
Figure 8. Ortophotomap based on RPAS (NIR spectrum), background map – shaded relief
Figure 9. Difference between DSM based on RPAS and DTM based on ALS (NIR)
on the site were not suitable for observation of soil or vegetation indices (Fig.8). Regarding dense vegetation cover, only the Digital Surface Model (DSM) was created. Fig. 9 shows the difference between DSM based on RPAS and DTM based on ALS (NIR) which illustrates the height of vegetation cover.
More successful was the prospection with ground-penetrating radar. Profile A (Fig. 3) in the well-preserved part of formation in the forest did not discover any inhomogeneity in the structure of the formation. The formation was probably made of on-site materials without any specific internal structure. Profiles B, C and D were very similar to each other (Fig. 9,10). Profiles depict a rampart and a ditch which run along both sides of the rampart. The depth of the ditch varies between 1.0-1.3m and the distance between lowest parts of ditches laying on opposite sides of the rampart was 9m, which corresponds to the distance between the lines visible on the ortophotomap. The possible original appearance of the profile was reconstructed while maintaining amount of soil on-site (Fig. 10). Based on the reconstructed profile, the position of the rampart from ortophotomaps and current DTM, the whole situation was reconstructed to its possible original appearance (Fig. 11).
Figure 09. Cross section based on ground-penetrating radar
Figure 10. Rampart reconstruction
Figure 11. Reconstructed model
3.3 Results
The artificial ditch crossing the Lipany Mountain, created by modifying a natural clough and now used by the road, was connected to the Devil’s Furrow from previous research (Miškovský, 1903; Bernat and Štědra, 2003). This ditch was
appended by a bank created probably from excavated material. The formation which continuous from the end of a ditch southwest across the field was never connected to the rest of the Devil’s Furrow due to its different appearance.
The linearity of the formation pointed at the anthropological origin and the ending of the formation in cloughs did not correspond to the hypothesis about pathway (Štuka and Nový, 2014a).
The data acquired during the project help to describe the formation as a rampart with ditch which run along both sides of it. The position and the shape of the formation matches the hypothesis, that it could serve as an administrative boundary. The details confirmed by historical literature are described separately (Štuka and Nový, 2014b).
4. CONCLUSION
The aim of the project was to explain the origin and the purpose of the part of the terrain formation called Devil’s Furrow. Map and literature searches with a combination of modern technologies for non-invasive prospection enabled the reconstruction of the object and map its destruction step-by-step.
The combination of the methods is useful thanks to its complementarity. Ortophotomaps help to localize objects in fields, DTM based on ALS is essential for prospection in forested areas, historical maps help with the mapping the development of an investigated site and ground-penetrating radar can confirm findings from previous research and complement it by the information about internal object structure without traditional excavation.
ACKNOWLEDGEMENTS
This research has been supported by the Ministry of Culture under project NAKI – DF13P01OVV002.
The authors thank the Czech Office for Surveying, Mapping and Cadastre for lending the ALS dataset.
REFERENCES
Bernat, J.; Štědra, M., 2003. Čertova brázda, stará severojižní
stezka mezi Labem a Sázavou. In Lutovský, M., Archeologie ve středních Čechách 7/1. Praha: Ústav archeologické památkové péče středních Čech, pp. 349–362.
Cowley, D., 2011. Remote Sensing for Archaeological Heritage Management. EAC, 312 p., ISBN 978-963-9911-20-8.
Doneus, M.; Briese, CH., 2006. Full-waveform airborne laser scanning as a tool for archaeological reconnaissance. From Space to Place: 2nd International Conference on Remote Sensing in Archaeology, Archaeopress, Oxford, pp. 99–105.
English Heritage, 2011. 3D Laser Scanning for Heritage:
Dušánek P., 2011. Exploitation of countrywide airborne LIDAR dataset for documentation of historical human activities interdisciplinárním kontextu. Brno: Centrum dopravního výzkumu, pp. 80-84, ISBN 978-80-86502-53-3.
Štuka, Č.; Nový, P., 2014a. Využití veřejně dostupných dat při Implementations. Journal of Archaeological Method and Theory. Volume 19, Issue 1, pp 132-160.