REFINEMENT METHOD FOR RESIDENTIAL AREA REVISION USING REMOTE
SENSING IMAGE AND GIS DATA IN EARTHQUAKE RISK ASSESSMENT
A. X. Dou*, X. X. Yuan, X. Q. Wang, Z. M. Li
Institute of Earthquake Science, China Earthquake Administration, Beijing, China – (axdothy, yuanxx1983, wangxiaoq517) @163.com, [email protected]
Commission VIII, WG VIII/1
KEY WORDS: Earthquake Disaster, Risk Assessment, Residential Area, Revision, Remote Sensing
ABSTRACT:
This paper proposes an automatic approach for residential areas revision by means of analysing the correlation between the residential area and the topographic and geographical factors. The approach consists of four major steps: the extracting of missing residential area from the remote sensing images with high resolution; the statistic analysing on the size changes of missing residential area in each grade of the elevation, slope, distance from the road and other impact factors; modelling of residential area modification in the urban and rural region; testing the methods using100 counties data which are located in the middle part of China North-South Seismic Belt and comparing the result to the Land Use in map scale 1:100000. The experimental results present the accuracy of urban residents by 70% increased to 89.4%, rural residents by 47% up to 81.9%, rural residents from 8% increased to 78.5%. Therefore, there is available risk exposure information in a sparsely populated area because the spatial grid distributions of population and buildings are based on the residential areas. The proposed approach in this paper will improve the accuracy of the seismic risk assessment if it is applied to the national or the whole world.
* Corresponding author: Aixia Dou, [email protected] 1. INTRODUCTION
As the important unit of social economy, residential areas are the carriers of population, buildings and other exposures in earthquake risk assessment. The exact and rapid determination of spatial distribution of residential area is of significance in reducing uncertainty of seismic risk assessment. The residential areas are usually extracted and updated using remote sensing images, however, two major problems have to be concerned. Firstly, the residential area extraction and updating is a critical step for the processing of massive the remote sensing images with high resolution. Secondly, the identification ability of remote sensing image have limited the accuracy of residential areas because of the spectral reflectance feature of the mixed land cover type, such as houses, bare land, and vegetation, etc. Zhao P., 2003 caused by not only own spectral characteristics of internal composition (Yang C.J., 2001) but also the significant influence of terrain factors, especially in the mountains with the complex terrain and sparse buildings (Hu W.Y., 2005). In order to improve the interpretation accuracy of the residents, the methods using the elevation and slope has been well studied by researchers (Wilkinson, G.G.,1990; Cao W.F.,1998; Chen Y.H, 2006; Zhang Y.,2006).
Owing to the loss of residential area in the suburban, small town and the rural area, the building distribution is different to the actual one in the Chinese Land Use mapping in scale 1:100000 on basis of images with 15 meters resolution. If this Land Use data are applied to distribute the population and buildings, there would be no population and building information in the complex geological and terrain environment regions, but these regions often are the high earthquake hazard. Therefore the seismic risk assessment should use the high residential area information. This paper presents an automatic approach for residential areas revision by means of analysing
the correlation between the residential area and the topographic and geographical factors.
2. METHODOLOGY
2.1 Estimated Method of Residential Area
In this paper, the maximum probability method is used to construct the model of urban and rural residents' area correction, to revise and supplement the loss of urban and rural residential area, in order to obtain most precise data.
The size of residential areas is related to the topography and geographic factors. For the missing or correcting residences, the maximum probability method is used to estimate the residential area under each influencing factor. Then to sum all factors’ results can get the predicting area. The estimated formula is:
(1)
Where SRC is the correction area of urban and rural residents
under the influence of multiple factors. is the normalized correlation coefficient of No. i factors and residential area, using as the area of weight correction No. i factors. The
coefficient of is correction area given by
(2)
SR prefers to original residential areas from remote sensing
images. prefers to a residential area correction
coefficient of the NO. j grade of No. i factor, which is the ,
1
*
i j n
RC i RC
i
S
r
S
=
=
∑
i
r
, i j
RC
S
,
*
,i j
RC R i j
S
=
S
C
,
i j
c
The International Archives of the Photogrammetry, Remote Sensing and Spatial Information Sciences, Volume XLI-B8, 2016 XXIII ISPRS Congress, 12–19 July 2016, Prague, Czech Republic
This contribution has been peer-reviewed.
residential area ratio between the real and abstracted from remote sensing images. The parameter i is the number of the influencing factors. The parameter j is the number of sub-factor that each influencing factor is divided into different grades. In order to analysing the influencing grade of every factor, the weight coefficient C is divided to six grades: <0.75, 0.75-1.25, 1.25~1.75, 1.75~2.25, 2.25~2.75, >2.75. The greater the correction coefficient is, the greater the extent of the loss of residents is.
2.2 Spatial Updating Method of Urban and Rural area
Using the above method, the estimated areas can be gotten. However, the spatial updating method of theoretical results is different between the residential existence and no existence in original data.
When there are city, town or village areas in the land using data, the spatial correction workflow is illustrated in Figure 1. Firstly the real residential areas are identified from remote sensing image with high resolution. Then the weight coefficients C are generated based on the statistical analysis about the influencing degree of different factors and their sub-factors. Thirdly the correction areas are calculated. Finally
the buffer zones are created using the correction radius given by
(3)
Where SRC is the correction area of urban and rural residents
under the influence of multiple factors, given by the formula (1). SR is the original area in the land using data. LR prefers to the
original perimeter of residential polygon.
Figure 1. Updating procedure in the region with original residential area
When the residential area is missing in the land using data, the spatial updating workflow is shown in Figure 2. The first step is to find out the missing town or village area by comparing the land-using data and GIS information. The next procedures are same to the above first, second and third steps. Finally, the buffer zones are created based on the point information of missing town and village in GIS information using the
correction radius given by
!!= !!"
! (4)
Where SRC is the correction area of urban and rural residents
under the influence of multiple factors, given by the formula (1).
Figure 2. Updating procedure in the region without original residential area
3. STUDY AREA AND DATA USED
3.1 Study Area
The study area locates in North-south Seismic Belt of China, which throughout the China mainland with a dense seismic from Ningxia, through Eastern Gansu, Western Sichuan to Yunnan. One hundred of four hundred counties are selected to be as the study area shown in the figure 3. 19 counties are in Yunnan province, 53 counties in Sichuan province, 23 counties in Gansu, 5 counties in Ningxia province.
Figure 3. Location of study area
3.2 Data Source
For this research, the residential data from Chinese Land Use mapping in scale 1:100000 in 2010 are used as revised data. The remote sensing images with high resolution are applied to visual interpret the residential area, including the ZY3, ZY02C, Quickbird, Worldview and UAV image. The topographic data are AsterDEM with 30 meters resolution, which are used to abstract the slope, elevation and aspect. GIS information is the key data for searching the missing residential point and analysing the influence degree of road.
C R
(
) /
C RC R R
R
=
S
−
S
L
C R
The International Archives of the Photogrammetry, Remote Sensing and Spatial Information Sciences, Volume XLI-B8, 2016 XXIII ISPRS Congress, 12–19 July 2016, Prague, Czech Republic
This contribution has been peer-reviewed.
3.3 Data Preparation
After all kind of remote sensing images and DEM were registered to land use data, the influencing factors and sub-factor were generated. The detail data preparation is following as:
(1) Abstraction of urban built-up area, some town and village samples in 100 counties from remote sensing images. (2) According to the elevation distribution of settlement, the
4.1.1 Parameter of correction residential area: On the basis of statistical analysis about the relationship between the elevation, slope and the residential area interpreted from remote sensing images, the empirical modification parameters with maximum possibility were obtained for urban and rural area,
Table 1. Parameters of correction residential area
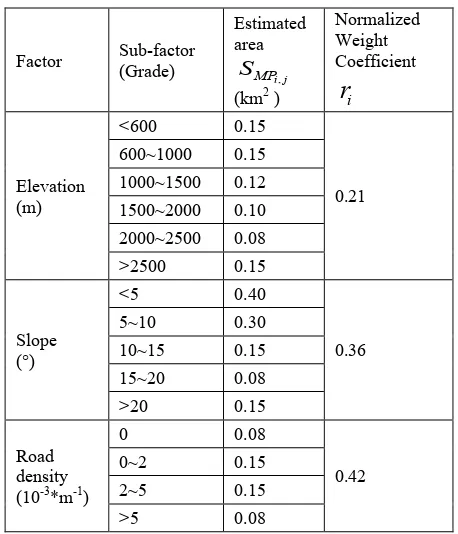
4.1.2 Weight Coefficient of the missing urban area: In order to recover some urban area unidentified from the remote sensing image in the land-use data, about 90 missing urban area samples were selected in the study area. Then the statistical relationship between the missing area with different size and the elevation, slope, road density was built. The normalized weighted coefficient of each factor and estimated area with maximum probability of each sub-factor were obtained and presented in the table 2.
Factor Sub-factor
Table 2. Parameters of missing urban area
4.1.3 Estimated area of the missing administrative village in land using data: Some counties were chosen among 100 counties to create the empirical parameter of whole study area because it is difficult to identify all missing villages in whole study area. In this paper let take Dongchuan, Yunnan Province as an example. The rural areas were abstracted from sub-meter images, such as Quickbird or UAV. The figure 4 presents the frequency and cumulative probability density of rural area size. We can see there are nearly 90% administrative villages with less than 0.5 km2. Taking the average area of all administrative villages within 85% cumulative probability density as the estimated rural area.
Figure 4. Probability density distribution of village area
4.2 Results and Accuracy Evaluation
According to the urban and rural area by correction model and space realization method, at the same time, based on elevation, slope, road information data for North South seismic belt, more perfect and fine residential data were gained. Taking Dongchuan and its surrounding six counties of Yunnan Province as example, the Fig 5 shows one residential refinement results. In order to verify the validity of urban and rural residential area correction method, sub-meter image were ,
The International Archives of the Photogrammetry, Remote Sensing and Spatial Information Sciences, Volume XLI-B8, 2016 XXIII ISPRS Congress, 12–19 July 2016, Prague, Czech Republic
This contribution has been peer-reviewed.
Figure 5 Comparison before and after Correction result near to Dongchuan Yunnan province
(Left: original land using data, Right: correction result)
worked as reference data, and the residential area accuracy was calculated before and after date updating (Table 4). It can be seen that the recognition accuracy is highly promoted because both urban and rural residents were fine processed. Compared to the data of 1:10 land-use data, the recognition accuracy has been significantly improved as higher as 34% and 70% for urban and rural resident area, respectively. It is safe to conclude that the method introduced by this paper was powerful and effective.
Residential Area types
Recognition rate (%)
Land using data
OLI image
Refinement results
Urban area 70 83 90
Town area 47 79 82
Rural area 8 43 79
Table 3. Recognition rate of different data
5. CONCLUSION
Aiming the problems of sporadic residents lost and less area of identified area, the modification model for urban and rural resident area was built using the elevation, slope and roads that affected the residential area spatial distribution. The model can modify or implement the inaccurate or missing residential area. Compared to 1:10 land usage data, the result obtained by this method can improve the identification accuracy of 34% and 70% for urban and rural resident, respectively, which suggests that this method can effectively improve the resident identification accuracy.
ACKNOWLEDGEMENTS
The study is supported by the Public Science and Technology Research Funds Projects of Earthquake201508010.
REFERENCES
Cao W.F., Qin Q.M.,1998.A knowledge-based research for road extraction from digital satellite images. Acta Scientiarum NaturaliumUniversitatis Pekinensis, 34(1), pp. 122-131. Chen Y.H., Zhang W.C., 2006. GIS supported decision tree classification of remote sensing images in mountainous areas
.
Remote Sensing for Land & Resources. 2006(1), pp.69-74. Hu W.Y., Jiao Y.M.,2005. A study on technique of extracting information of land-use/land-cover based on landsat ETM+ by remote sensing. Yunnan Geographic environment research, 17(6), pp.36-39.Wilkinson G G, Mégier J. 1990.Evidential reasoning in a pixel classification hierarchy—a potential method for integrating image classifiers and expert system rules based on geographic context. International Journal of Remote Sensing,11(10), pp.1963-1968.
Yang C.J., Zhou C.H., 2001. Extracting residential area from TM image on the basis of knowledge discovered. Remote Sensing Technology and Application, 16 (1), pp. 1-6. Zhao P., Feng X.Z., Lin G. F., 2003. The decision tree algorithm of automatically extracting residential information from SPOT images. Journal of Remote Sensing, 7(4), pp. 39-315.
Zhang Y., Wang Y.L., Peng J.,2006. Research on extraction of residential area in mountainous areas using spatial probability surface. Geography and Geo-Information Science, 22(4), pp.6-10. The International Archives of the Photogrammetry, Remote Sensing and Spatial Information Sciences, Volume XLI-B8, 2016
XXIII ISPRS Congress, 12–19 July 2016, Prague, Czech Republic
This contribution has been peer-reviewed.