APPLICATION FOR 3D SCENE UNDERSTANDING IN DETECTING DISCHARGE OF
DOMESTIC WASTE ALONG COMPLEX URBAN RIVERS
Y. Ninsalama, c∗, R. Qinb, J. Rekittkea
a
National University of Singapore, Department of Architecture, 4 Architecture Drive Singapore 117566 - (yazid.ninsalam, rekittke)@nus.edu.sg b
The Ohio State University, Department of Civil, Environmental Engineering and Geodetic Engineering, 470 Hitchcock Hall 2070 Neil Avenue, Columbus, OH 43210, USA - [email protected]
cSingapore-ETH Centre, Future Cities Laboratory, CREATE Tower Singapore 138602 - [email protected]
Commission III, WG III/4
KEY WORDS:Scene Understanding, Image Classification, Co-Registration, Urban Rivers, Complex Terrain
ABSTRACT:
In our study we use 3D scene understanding to detect the discharge of domestic solid waste along an urban river. Solid waste found along the Ciliwung River in the neighbourhoods of Bukit Duri and Kampung Melayu may be attributed to households. This is in part due to inadequate municipal waste infrastructure and services which has caused those living along the river to rely upon it for waste disposal. However, there has been little research to understand the prevalence of household waste along the river. Our aim is to develop a methodology that deploys a low cost sensor to identify point source discharge of solid waste using image classification methods. To demonstrate this we describe the following five-step method: 1) a strip of GoPro images are captured photogrammetrically and processed for dense point cloud generation; 2) depth for each image is generated through a backward projection of the point clouds; 3) a supervised image classification method based on Random Forest classifier is applied on the view dependent red, green, blue and depth (RGB-D) data; 4) point discharge locations of solid waste can then be mapped by projecting the classified images to the 3D point clouds; 5) then the landscape elements are classified into five types, such as vegetation, human settlement, soil, water and solid waste. While this work is still ongoing, the initial results have demonstrated that it is possible to perform quantitative studies that may help reveal and estimate the amount of waste present along the river bank.
1. INTRODUCTION
Due to inadequate infrastructure and service support, residents along river banks in developing cities rely upon rivers for multi-ple environmental services (Steinberg, 2007; Vollmer and Gret-Regamey, 2013). These services include harvesting of plants, di-rect sanitary use, sewage disposal, recreation, solid waste dis-posal and groundwater use. This paper focuses on the detection of visible solid waste along the lower reaches of the Ciliwung River in Jakarta, Indonesia. This waste contributes to environ-mental degradation, including poor water quality, and may be linked to ill health (Marschiavelli, 2008). Furthermore, field cam-paigns and model simulations have demonstrated how measures proposed to solve the flood problem might further deplete water quality if the pollution load is not reduced (Costa et al., 2016). Therefore, the ability to identify and monitor point sources of solid waste disposal may aid in the development of strategies to reduce the pollution load.
The lack of spatially explicit information on urban conditions for example the prevalence of waste disposal along the river banks hinders feasible impact assessments (Padawangi et al., 2016). To date, limited targeted empirical analysis has been undertaken on the interactions between urban informal settlements and the en-vironmental services they demand (Vollmer and Gret-Regamey, 2013). We acknowledge the complex reality of the urban river system that is characterised by heterogeneous distribution of both environmental attitudes and built spaces. Studies have shown that both sociocultural and spatial information can be useful in im-proving analysis and involving participatory collaboration (Prescott and Ninsalam, 2016; Padawangi et al., 2016; Curtis et al., 2013).
∗Corresponding author.
Often such research has relied on spatial extrapolation from sur-veys and interviews to locate problem areas (Vollmer et al., 2015). Furthermore, the research may be limited to the researchers’ ca-pability to gather information on the ground, and is resultantly constrained to the neighbourhood scale (such as Padawangi et al., 2016). Based on these challenges, researchers are turning to other methods of capturing spatial data. For example, video was used to capture street and building scale spatial information (trash ac-cumulation, standing water etc.) and map the health risks of the urban environments in Haiti (Curtis et al., 2013). We are moti-vated to contribute to this approach by analysing images acquired along a river (river based images) to study the prevalence of waste along the river banks.
so doing, this method can improve analysis approaches for policy and design action.
2. RELATED WORK
The use of remote sensed data to conduct hydromorphological assessment and monitoring of rivers is increasingly prevalent es-pecially at the national scale (Bizzi et al. 2016). However, the application of photogrammetry and structure from motion has made the acquisition of fluvial topographic data more accessible and smaller data sets are now being established for site specific investigation. The spatial variability of the rivers under study -including depth, presence of vegetation cover, and length - has resulted in the deployment of a number of acquisition methods: from ground based hand-held helikite (Fonstad et al., 2013), or unipod-mounted (Bird et al., 2010), ground and airborne survey (Bangen et al. 2014), to boat based (Alho et al. 2009), and un-manned aerial vehicle acquisition (Woodget et al., 2015; Bagheri et al., 2015). These approaches are best suited to smaller areas based on time, effort, and relative cost required. Choosing to stay within the the low cost framework established by our work (Rekittke et al., 2014), we deployed a low cost acquisition solu-tion to acquire data on the neighbourhood under study.
The wide availability of acquisition approaches has resulted in greater prevalence of spatial data, which has in turn has brought about a demand for scene interpretation (Weinmann, 2016). Al-though the methods for scene understanding have a wide range of uses, most applications of scene understanding focus on the se-mantic labelling of cities at street-level (Weinmann et al. 2014). Limited work has been done in the application of scene analysis along rivers. Among these, Brodu and Lague (2012) have pro-vided an example of the application of classification techniques in which a multi-scale dimensionality criterion was used to sep-arate riparian vegetation from ground. Furthermore, a notable application, similar to the aim of this research, involved the de-tection of debris in the city of Kamaishi, Japan (Sakurada et al., 2016). Both aerial and street view images were used to eval-uate city-scale damage post-tsunami. This work contributes by demonstrating a novel application to reveal and potentially esti-mate the amount of waste present along the river bank.
3. METHODOLOGY
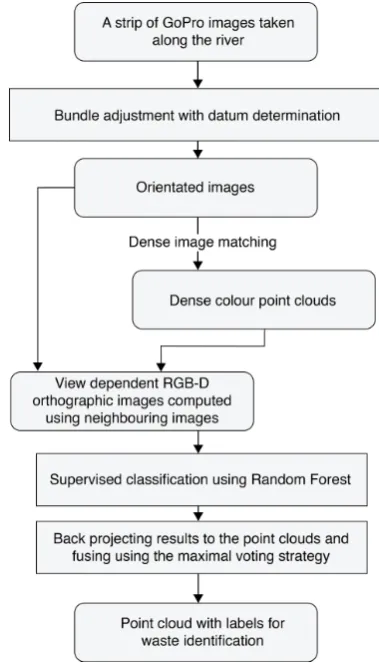
Our framework utilises the acquired river based images for 3D scene understanding. In this section, we explain the details of the proposed method within the context of domestic solid waste detection. Although the explanation focuses on solid waste as an example, the method can be applied to other visible elements. The proposed method (Figure 1) consists of the following five steps:
1. Structure from Motion (SfM) is applied to get the orienta-tion of the images
2. Colour point clouds are generated using dense matching
3. Colour point clouds and each image (and neighbouring im-ages) are used to generate RGB-D images
4. Image-based supervised classification on the RGB-D data is performed to identify different landscape elements (Section 3.3)
5. Classification results are projected to the point clouds in 3D (Section 3.4)
Figure 1: Flowchart of the sequential processing steps
3.1 Geometric Processing
For our experiment, we adopt VisualSfM (Wu, 2014) for struc-ture from motion and a hierarchical semi-global matching method (Hirschmller, 2008; Rothermel et al., 2012) to generate dense point clouds. Due to our data acquisition mode (the images are acquired facing the investigated planes), objects in the view de-pendent orthographic images are less distorted and occluded, pro-viding advances in feature description. Images are used for clas-sification instead of the point clouds. Their ease of implemen-tation and continuous nature mean that they are more efficiently computed.
3.2 Segmentation
To efficiently address the classification problem, we perform an object-based analysis. We first apply a segmentation approach to cluster pixels with similar colours and depth. The synergic mean-shift segmentation method is adapted to utilise both the colour and depth information together (Christoudias et al., 2002; Co-maniciu and Meer, 2002). This has been proven to have better performance (Qin et al., 2015). We use the canny edge of the depth images to constrain the mean shift direction and prevent it from extending beyond the depth discontinuities.
3.3 Feature extraction
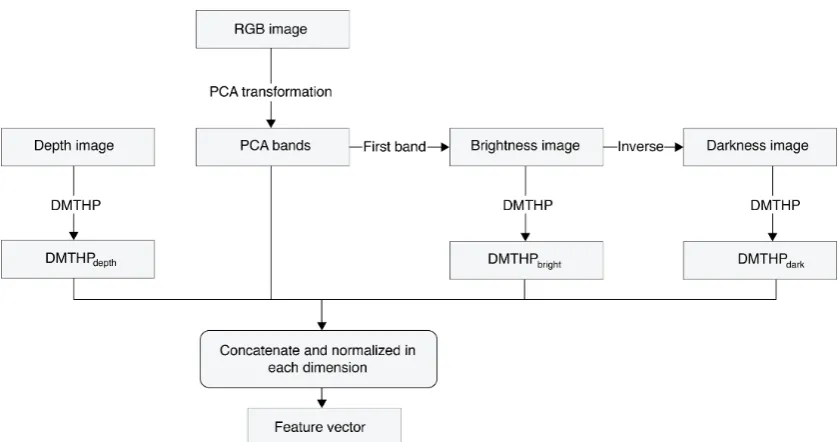
Figure 2: The feature extraction diagram using PCA and DMTHP.
as proposed by Zhang et al. (2015), is used to extract spatial in-formation of the RGB-D data. In their approach, dual top-hat refers to both top-hat by erosion and top-hat by reconstruction for grey level images. Readers may refer to Vincent (1993) for associated details. A sequence of top-hat reconstruction of the grey level images and digital surface model (DSM) are computed using different sized disk-shaped structuring elements.
In total three image layers are being processed: the brightness image, darkness image and the DSM (in our case this is a depth image). The brightness and darkness images are essentially the first band of the PCA and its inverse image, as it contains the highest inter-band variance. Figure 2 shows the feature extraction process. The sequences of spatial features are concatenated to the spectral features (PCA) and normalised in each dimension for classification. In our method, we use a fixed structuring element, as the image contents are smooth and only small rocks and solid wastes create blob shapes. We input a value of 20 pixels as the diameter of the disk-shape structuring element, as determined by empirical selection.
3.4 Image Classification
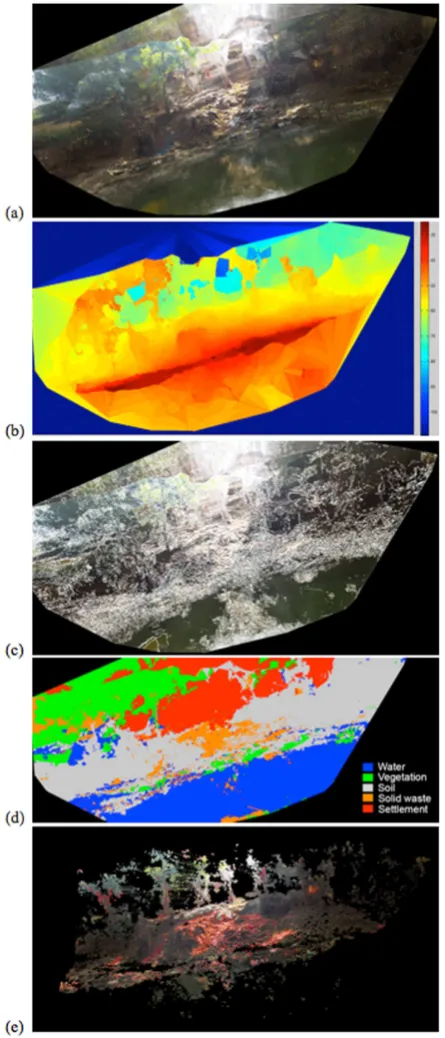
We employ the Random Forest (RF) classifier (Breiman, 2001) to perform the classification. As a hierarchical classifier, RF per-forms well in separating features that are derived from different sources. In our case the spatial features are derived from both depth and radiance. We use 500 trees associated with the RF classifier for training. The reference data is manually sketched for comparison and 5% of the reference data are used for train-ing. Figure 4 shows the test data and results for this experiment.
4. EXPERIMENTAL RESULTS
We evaluated the application of our proposed method using the case study of Kampung Melayu and Bukit Duri in East Jakarta, two districts situated on either side of the Ciliwung Rivers lower reaches. This meandering river runs 119 km through the cities of Bogor, Depok, and Jakarta. Approximately 5 million people reside within the 384 km2catchment area.
Image information was captured using a river based camera set-up on board a lightweight Challenger 4 Inflatable boat. For the
image capture, we assembled three GoPro HD Hero2 Outdoor Edition cameras fitted in waterproof housings. We positioned the cameras in a three-way pivot and mounted them onto a telescopic mast (Figure 3). We programmed the cameras to capture high definition resolution (1920 x 1080 pixels) videos at a rate of 30 frames per second. We used a 2.8 mm fix objective with a 127-degree (medium) field of view. A handheld Garmin GPSMAP 60CSx receiver was used for tracking purposes. In this study, we processed 7 out of the 543 images extracted from the video sequence that documented a 2.86 km segment of the river starting from the following coordinates -6.224583N, 106.863715E.
Figure 3: Three GoPro HD Hero2 cameras, mounted on a tele-scopic mast. Balancing the camera set-up in the middle of the boat. (Photos: Rekittke et al., 2014)
* Identified as Waste Waste identified as*
Settlement 1.20 0
Solid Waste 90.22 90.22
Soil 6.41 7.72
Vegetation 6.64 1.53
Water 0.58 0.53
Table 1: Statistics of solid waste detection in percentage.
Figure 4: (a) View dependent orthophoto, (b) depth image, (c) segmentation boundaries, (d) classification results and (e) colour point cloud where solid waste is labelled red.
5. DISCUSSION
The advantages of the proposed method for the environmental monitoring of urban rivers are exemplified by the functional
ac-quisition of river based images and application of 3D scene un-derstanding. The application of known 3D scene understanding techniques allows us to: 1) objectively identify, 2) statistically detect, 3) illustrate the qualitative condition, and 4) visualise the relationship of the landscape elements in the scene (Figure 4). Our method has been demonstrated to improve our ability to dis-tinguish the characteristics of complex sites.
Beyond the detection of solid waste, the class-specific classifica-tion results allow for the monitoring of other essential landscape elements such as vegetation and human settlement. This appli-cation may be extended to use in post-flood inventory of build-ings and vegetation, as mentioned earlier. We adopted a view de-pendent 2D approach as our initial investigation. Based on this, further studies that exploit the possibility for wide-area classifi-cation are expected. The current 2D feature extraction on view-dependent RGB-D data is advantageous for implementation, and works reasonably well for strips of side-look images. In our next steps, we will implement a voting strategy to determine the over-lapped region of different views in the 3D scene.
6. CONCLUSION
In this paper, the application of 3D scene analysis has been demon-strated using river based images acquired by a low-cost solution to identify solid waste disposal discharge points. This work firstly contributes to producing spatially explicit information along a river reach in order to support context-appropriate, and targeted planning and design interventions. Secondly, this paper provides insights into the methods that may be deployed to support longer-term river rehabilitation programs in such communities. We spec-ulate that the low-cost imaging solution may be deployed for river bank monitoring purposes. While our research is still in progress, this paper shows the preliminary results of scene understanding using side-look images. Our intention in this paper is to introduce the concept of using 3D scene understanding to solve environ-mental monitoring problems in complex scenarios. We hope in the next step to process more data and refine the feature extrac-tion framework, as well as the voting handling across multiple view dependent orthophotos.
7. ACKNOWLEDGEMENTS
We would like to acknowledge Professor Christophe Girot, in his capacity as the principal investigator of the Landscape Ecology research module of the Future Cities Laboratory and Associate Professor Wong Yunn Chii, Head of Department of Architecture at the National University of Singapore, for their support. We would like to thank the Singapore National Research Foundation and Singapore-ETH Centre Future Cities Laboratory for provid-ing the financial support to carry out the research and associated fieldwork.
REFERENCES
Alho, P., Kukko, A., Hyyppa, H., Kaartinen, H., Hyyppa, J. and Jaakkola, A., 2009. Application of boat-based laser scanning for river survey.Earth Surface Processes and Landforms 34(13), pp. 18311838.
Bangen, S.G., Wheaton, J.M., Bouwes, N., Bouwes, B. and Jor-dan, C., 2014. A methodological intercomparison of topographic survey techniques for characterizing wadeable streams and rivers.
Geomorphology, 206,pp. 343-361.
Bird, S., Hogan, D. and Schwab, J., 2010. Photogrammetric mon-itoring of small streams under a riparian forest canopy. Earth Surface Processes and Landforms 35(8), pp. 952970.
Bizzi, S., Demarchi, L., Grabowski, R. C., Weissteiner, C. J. and Van de Bund, W., 2016. The use of remote sensing to characterise hydromorphological properties of European rivers. Aquatic Sci-ences, Volume 78, Issue 1, pp. 57-70.
Breiman, L., 2001. Random Forests. Machine learning 45 (1), 5-32.
Brodu, N. and Lague, D., 2012. 3D terrestrial lidar data classifi-cation of complex natural scenes using a multi-scale dimension-ality criterion: Applications in geomorphology. ISPRS Journal of Photogrammetry and Remote Sensing Vol 68, pp. 121-134.
Christoudias, C. M., Georgescu, B. and Meer, P., 2002. Syn-ergism in low level vision. In: 16th International Conference on Proceedings of Pattern Recognition, Quebec, Canada, August 11-15, pp. 150-155.
Comaniciu, D. and Meer, P. 2002. Mean shift: A robust ap-proach toward feature space analysis.IEEE Transactions on Pat-tern Analysis and Machine Intelligence 24 (5), 603-619.
Costa, D., Burlando, P. and Priadi, C., 2016. The importance of integrated solutions to flooding and water quality problems in the tropical megacity of Jakarta. Sustainable Cities and Society, 20, pp.199-209.
Curtis, A., Blackburn, J.K., Widmer, J.M. and Morris, J.G., 2013. A ubiquitous method for street scale data collection and analysis in challenging urban environments: mapping health risks using spatial video in Haiti.International Journal of Health Geograph-ics, pp. 12 21.
Fonstad, M.A., Dietrich, J.T., Courville, B.C., Jensen, J.L. and Carbonneau, P.E., 2013. Topographic structure from motion: a new development in photogrammetric measurement. Earth Sur-face Processes and Landforms, 38(4), pp. 421-430.
Hirschmller, H., 2008. Stereo processing by semiglobal matching and mutual information. IEEE Transactions on Pattern Analysis and Machine Intelligence 30 (2), pp. 328-341.
Marschiavelli, M.I.C., 2008. Vulnerability assessment and cop-ing mechanism related to floods in urban areas: a community-based case study in Kampung Melayu, Indonesia. Doctoral dis-sertation, Gadjah Mada University.
Padawangi, R., Turpin, E., Prescott, M.F., Lee, I. and Shepherd, A., 2016. Mapping an alternative community river:The case of the Ciliwung. Sustainable Cities and Society, 20, pp.147-157.
Prescott, M.F. and Ninsalam, Y., 2016. The synthesis of environ-mental and socio-cultural information in the ecological design of urban riverine landscapes. Sustainable Cities and Society, 20, pp.222-236.
Qin, R., Huang, X., Gruen, A. and Schmitt, G., 2015. Object-Based 3-D Building Change Detection on Multitemporal Stereo Images.IEEE Journal of Selected Topics in Applied Earth Obser-vations and Remote Sensing 5 (8), 2125-2137.10.1109/JSTARS. 2015.2424275
Rekittke, J., Ninsalam, Y. and Paar. P., 2014. No Fear of Ridicule-deploying plaything technology for credible representations of urban landscape.International Journal of Architectural Comput-ing 12 (1), pp. 27-46.
Rothermel, M., Wenzel, K., Fritsch, D. and Haala, N., 2012. SURE: Photogrammetric Surface Reconstruction from Imagery.
In: Proceedings LC3D Workshop, Berlin.
Sakurada, K., Okatani, T. and Kitani, K.M., 2016. Hybrid macro-micro visual analysis for city-scale state estimation. Computer Vision and Image Understanding 146, pp.86-98.
Steinberg, F., 2007. Jakarta: Environmental problems and sus-tainability.Habitat International, 31,pp. 354365.
Vincent, L., 1993. Morphological grayscale reconstruction in im-age analysis: applications and efficient algorithms. IEEE Trans-actions on Image Processing 2 (2), pp. 176-201.
Vollmer, D. and Gret-Regamey, A., 2013. Rivers as munici-pal infrastructure: Demand for environmental services in infor-mal settlements along an Indonesian river.Global environmental change, 23(6), pp.1542-1555.
Vollmer, D., Prescott M.F., Padawangi, R., Girot, C. and Gret-Regamey, A., 2015. Understanding the value of urban riparian corridors: Considerations in planning for cultural services along an Indonesian river. Landscape and Urban Planning 138, pp. 144-154.
Weinmann, M., Jutzi, B. and Mallet, C., 2014. Semantic 3D scene interpretation: A framework combining optimal neighbour-hood size selection with relevant features. ISPRS Annals of the Photogrammetry, Remote Sensing and Spatial Information Sci-ences, Volume II-3, pp. 181-188.
Weinmann, M., 2016. 3D Scene Analysis. In Reconstruction and Analysis of 3D Scenes. Springer International Publishing, pp. 141-224.
Woodget, A. S., Carbonneau, P. E., Visser, F. and Maddock, I. P., 2015. Quantifying submerged fluvial topography using hyper-spatial resolution UAS imagery and structure from motion pho-togrammetry.Earth Surf. Process. Landforms 40, pp.47-64.
Wu, C., 2014. VisualSFM : A Visual Structure from Motion Sys-tem, http://ccwu.me/vsfm/. last date accessed: 26 Feb 2014