TEMPORAL STATISTIC OF TRAFFIC ACCIDENTS IN TURKEY
S. Erdogan a , M. Yalcin a, *, M. Yilmaz a, A. Korkmaz Takim b
a Department of Geomatics, Faculty of Engineering, Afyon Kocatepe University, TR-03200, Afyonkarahisar, Turkey - (serdogan,
mustafayalcin, mustafayilmaz)@aku.edu.tr
b14. Regional Directorate of Highways, TR-16330, Bursa, Turkey – [email protected]
KEY WORDS: Traffic accident, temporal analysis, Islamic daylight time interval, GIS.
ABSTRACT:
Traffic accidents form clusters in terms of geographic space and over time which themselves exhibit distinct spatial and temporal patterns. There is an imperative need to understand how, where and when traffic accidents occur in order to develop appropriate accident reduction strategies. An improved understanding of the location, time and reasons for traffic accidents makes a significant contribution to preventing them. Traffic accident occurrences have been extensively studied from different spatial and temporal points of view using a variety of methodological approaches. In literature, less research has been dedicated to the temporal patterns of traffic accidents. In this paper, the numbers of traffic accidents are normalized according to the traffic volume and the distribution and fluctuation of these accidents is examined in terms of Islamic time intervals. The daily activities and worship of Muslims are arranged according to these time intervals that are spaced fairly throughout the day according to the position of the sun. The Islamic time intervals are never been used before to identify the critical hour for traffic accidents in the world. The results show that the sunrise is the critical time that acts as a threshold in the rate of traffic accidents throughout Turkey in Islamic time intervals.
1. INTRODUCTION
Traffic accidents are a major contributor in terms of personal injury and lost productivity, both in developed and developing countries. According to a report from the World Health Organization (2010) about road traffic injury prevention, the number of people killed in road traffic accidents each year is estimated to be almost 1.3 million, while the number of people injured could be as high as 45 million worldwide. The number of traffic accidents remains an important issue in Turkey, despite ongoing infrastructure improvements and precautionary measure implementation. Therefore, analyzing the causes and effects of traffic accidents in order to reduce the resulting injuries or fatalities is the main task in the field of traffic safety and efficiency in Turkey.
Traffic accidents form clusters in terms of geographic space and over time, in that their occurrence is tied to traffic volumes, which themselves exhibit distinct spatial and temporal patterns, as well as because of their link to natural environmental factors such as rain snow, fog and darkness, the configuration of highway networks such as locations of access and egress points, and deficient design and maintenance of highways (Yamada and Thill, 2004; Xie and Yan, 2008). While studying traffic accident frequency, significant attention is dedicated to the understanding of their simultaneous spatial and temporal components. Two accidents that happen reasonably close to one another in space, but which occur weeks, months, or even years apart, are not likely to represent a significant cluster of activities for remediation efforts. Similarly, two accidents that occur simultaneously in time, but that are spatially separated, are not likely to be suggestive of an underlying process that can be investigated in terms of traffic accident mitigation. The knowledge of the temporal and spatial trends of accidents serves to focus the efforts of law enforcement and safety agencies, and the combination of these trends can inform mitigation strategies (Eckley and Curtin, 2013).
2. METHODOLOGY
Traffic accident occurrences have been extensively studied from different spatial and temporal points of view using a variety of methodological approaches in recent years (e.g., Mayhew et al., 2003; O’Connor and Brown, 2006; Li et al., 2007; Erdogan et al., 2008; Anastasopoulos and Mannering, 2009; Jung et al., 2010; Durduran, 2010; Wang et al., 2011; Plug et al., 2011; Eckley and Curtin, 2013).
In the literature, considerably less research has been dedicated to the temporal patterns of traffic accidents (Li et al., 2007). The main cause of this situation is that temporal analysis is a dynamic process that requires the tracking and positioning of the occurrences of traffic accidents in a dynamic dimension. Temporal studies have tended to focus on fluctuation in terms of the quantity and rate of accidents on different temporal scales, such as hourly, daily, monthly, and yearly (Levine et al., 1995; El-Sadig et al., 2002; Karacasu et al., 2011; Bačkalić, 2013). The changes in traffic accidents during 1990 are examined for predicting accidents by Levine et al. (1995). The morbidity and mortality from traffic accidents is described quantitatively in United Arab Emirates by El-Sadig et al. (2002) to identify their trends during the period 1977-1998. The variations in traffic accidents on seasonal, monthly, daily and hourly basis in Eskisehir-Turkey are researched by Karacasu et al. (2011) for determining road standards. Bačkalić (2013) examined the fluctuation of traffic accidents at different temporal scales to emphasize that time should be a first step in traffic safety analysis. The main aim of these studies is to establish general time pattern of traffic accidents.
increases with darkness (Plainis et al., 2006; Johansson et al., 2009).
In this regard, the main objective of this paper is to examine the distribution and fluctuation of traffic accidents to determine the different temporal structures by considering the position of the sun in terms of daylight and darkness in Turkey. As the first step, the numbers of accidents according to the hour and Islamic time intervals (according to the position of the sun) are examined in the period 2005-2011.
Islam pays considerable attention to the importance of time. Therefore, 17 time interval are defined and fixed for a 24-hour day in Islam. The daily activities, prayers and other worship of Islam pays considerable attention to the importance of time. Therefore, 17 time interval are defined and fixed for a 24-hour day in Islam. Muslims are arranged according to these standard time intervals. The new Islamic date begins with the setting, not the rising of the sun. The Islamic cycle of a day begins with the sunset (as 1200 Islamic time) and the night precedes the day in Islamic calendar. The Islamic time intervals which are the subject of this paper are explained below and these time intervals are given according to the actual civil time (respectively, from the 00th hour to the 24th hour) for a better understanding. The detailed information about Islamic time intervals (that includes times for the five daily prayers) can be found on the website (http://www.turktakvim.com).
Tahajjud: The last 1/3 of shar’i (canonical) night (Shar’i night: time between evening time and fajr time).
Sahar: The last 1/6 of shar’i night.
Fajr: The end of shar’i night (the start of shar’i day), which in turn is when whiteness is seen at a point on the line of the apparent horizon in the east.
Morning: The time for Morning Prayer (15-20 minutes later than fajr time).
Sunrise: The ending time for Morning Prayer (the end of the solar night), which is when the preceding [upper] limb of the sun is observed to rise above the line of the apparent horizon. Ishraq: The end of the first period of karâhat time during which it is forbidden to pray (40 minutes later than sunrise which is when the sun ascends to a height that it is too bright to look at with the naked eye).
Dhahwa-i kubrâ: The middle of the duration of the shar’i day, (1 hour before the time of zuhr (early afternoon) prayer). Karâhat: The second period of karâhat time when the sun is at its culmination (zawâl) that it is within the celestial circle that circumscribes the region termed the shar'i zawâl.
Zuhr: The apparent time of early afternoon prayer that begins as the sun’s following (trailing) limb departs from the apparent region of zawâl.
Asr awwal: The time for late afternoon prayer that begins when the shadow of a vertical rod on a level place becomes longer than its shadow at the time of true zawâl by as much as its height.
Asr thani: The time that begins when the shadow of a vertical rod on a level place increases by twice its height (36 minutes (in winter) and 72 minutes (in summer) later than asr awwal). Isfirâr-i shams: The third period of karâhat time when the preceding [lower] limb of the sun approaches the line of the apparent horizon by the length of a spear, i.e., the time when the centre of the sun is at an altitude of 5° from true horizon. Evening: The time for evening prayer when the sun apparently sets; that is, when its upper (following) limb is seen to disappear below the line of the apparent horizon from the observer’s
location. The shar’i (canonical) and the solar night also begin at this time.
Ishtibâk-i nujum: The time that begins when the number of visible stars increases (after the following limb of the sun has sunk down to an altitude of 10° below the line of the apparent horizon).
Ishâ-i awwal: The time for night prayer that begins when the upper (following) limb of the Sun descends to an altitude of 17° below the surface horizon (disappearance of redness on the line of the apparent horizon in the west).
Ishâ-i thani: The time that begins when the upper (following) limb of the Sun descends to an altitude of 19° below the surface horizon (disappearance of whiteness on the line of apparent horizon in the west).
As the second step, the number of accidents per minute are calculated for the both local time intervals and Islamic time intervals due to change in the time intervals. In the final step, because of seasonal and daily differentiation in traffic volume, the numbers of accidents are normalized in terms of Hourly Annual Average Daily Traffic data. Then, the ratio of traffic accidents per minute are normalized with the hourly number of vehicles. This paper exhibits the exploratory results of these steps.
3. MATERIALS AND ANALYSIS 3.1 Materials
Traffic accidents in Turkey are recorded by the Traffic Department of the General Directorate of National Police and the General Directorate of Highways. The traffic accident data belonging to the period 2005-2011 is obtained from the General Directorate of Highways. This data set consists of a total of 216,499 rows and 33 columns for 7 years. Columns consist of 33 different items in terms of the accident location and the accident in the form of Date Of Accident, Accident ID, Accident Year, Month Of Accident, Accident Day, Day Of The Week, Time, Place Of Accident, Non-Residential-Residential Condition, Road Division, Road ID, Occurrence Type Km, Meters, The Number Of Vehicles, Weather, Day Forecast Lighting, Road Works, Road Direction, Stimulating Traffic Sign, Road Surface, Dead Total, Injured Total, Result Death, Horizontal Road Geometry, Vertical Road Geometry, Other Road Geometry, X coordinate, Y coordinate. Updated Turkish digital road network for 2011 and Hourly Annual Average
Daily Traffic data by year were also obtained from the General Directorate of Highways. To examine the traffic accidents according to intraday occurrence, we used Islamic daylight time intervals. All of the accidents’ occurrence time (local time) is converted to the Islamic time intervals by using the date, X coordinate (latitude) and Y coordinate (longitude) fields. For detailed knowledge of the conversion formulas used, (http://www.turktakvim.com) can be checked.
3.2 Exploratory analysis
Figure 1. Traffic statistics in terms of years
When we examine the traffic accidents according to the month and day, traffic accidents tend to increase in July and August and on Fridays, Saturdays and Sundays (Fig. 2). These results verify the study of Erdogan et al. (2008). In general, the increase in the number of accidents is related to traffic volume which, in the summer months, is related to expatriates coming from abroad, while the increase in the number of accidents on weekends is related to weekend trips.
Figure 2. Traffic statistics according to month, day and hour
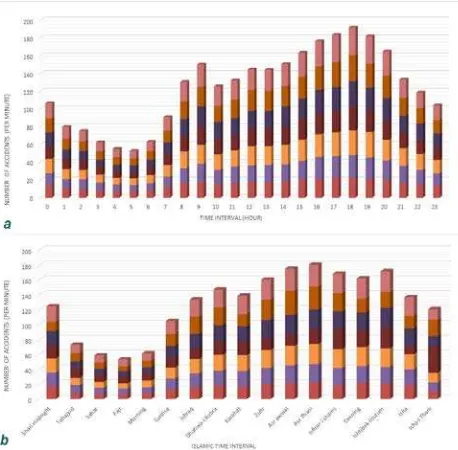
To examine the distribution of the accidents intraday, we explored the number of accidents according to the both local time and Islamic time (Fig. 3) and found that the 18th-19th hour interval has the most number of accident in terms of local time. The figure exhibits a smooth third degree parabola, but the 8th-9th and 8th-9th-10th time intervals act as outliers to this parabola. Ishraq, Zuhr and Isha-i thani time intervals have the most number of traffic accidents.
The reason for this situation is that Islamic time intervals do not have equal time length. To overcome this situation, we normalized the time intervals according to the number of accident per minute. When we equalize the number of accidents on the minute base in both times, both graphics resemble each other. In this case, both graphic exhibits a smooth third degree parabola.
Figure 3. The number of accidents, local time (a) and Islamic time (b)
According to Fig. 4, the number of traffic accident begins to rise in the 06 th -07 th hours in local time, and in the morning in the Islamic time division. Turkey is an extensive country in an east-west direction. Hence, for example, the eastern part of the country can be in darkness at 6 o’clock while the western part can still be in daylight. Meanwhile, Islamic time intervals are arranged according to the sun. Therefore, in the morning time, all of the country is in daylight.
Figure 4. The number of accidents per minute, (a) local time; (b) Islamic time
compared with the local time is apparent. This clearly shows the difference in terms of day time and night time with regard to the occurrence of traffic accidents. Fig. 5 shows the distribution of accidents according to the differences in local time and in Islamic time.
Figure 5. The percentage of accidents, (a) local time; (b) Islamic time
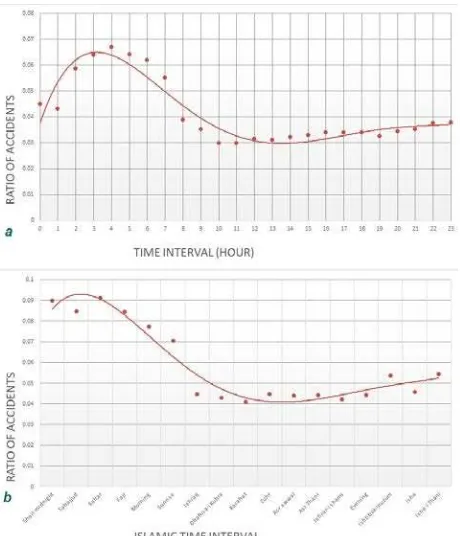
However in this graph the number of accidents is still strongly affected by the volume of traffic. Therefore we normalized the number of accidents by the Hourly Annual Average Daily Traffic data, and the ratio of traffic accidents per minute normalized with the hourly volume of vehicles is obtained (Fig. 6).
Figure 6. The percentage of accidents normalized with the traffic volume, (a) local time; (b) Islamic time
4. RESULTS AND CONCLUSIONS
ACKNOWLEDGEMENTS
This research has been supported by TUBITAK. Project Number: 113Y417
REFERENCES
Anastaspoulos, P.C., Mannering, F.L., 2009. A note on modeling vehicle accident frequencies with random-parameters count models. Accident Analysis and Prevention, 41, 153-159. Bačkalić, S., 2013. Temporal analysis of the traffic accidents occurence in Province of Vojvodina. Transport Problems, 8, 87-93
Durduran, S.S., 2010. A decision making system to automatic recognize of traffic accidents on the basis of a GIS platform. Expert Systems with Applications, 37, 7729-7736.
Eckley, D.C., Curtin, K.M., 2013. Evaluating the spatiotemporal clustering of traffic incidents. Computers, Environment and Urban Systems, 37, 70-81.
El-Sadig, M., Norman, J.N., Lloyd, O.L., Romilly, P., Bener, A., 2002. Road traffic accidents in the United Arab Emirates: trends of morbidity and mortality during 1977-1998. Accident Analysis and Prevention, 34, 465–476.
Erdogan, S., Yilmaz, I., Baybura, T., Gullu, M., 2008. Geographical information systems aided traffic accident analysis system case study: City of Afyonkarahisar. Accident Analysis and Prevention, 40, 174-181
Grimson, R., 1993. Disease clusters, Exact Distributions of Maxima and P-values. Statistics in Medicine, 12, 1773-1794 Haight, F.A., Olsen, R.A., 1981. Pedestrian safety in the United States: some recent trends. Accident Analysis and Prevention, 13, 43-55.
Johansson, O., Wanvik, P.O., Elvik, R., 2009. A new method for assessing the risk of accident associated with darkness. Accident Analysis and Prevention, 41, 809-815
Jung, S., Qin, X., Noyce, D.A., 2010. Rainfall effect on single-vehicle crash severities using polychotomous response models. Accident Analysis and Prevention, 42, 213-224.
Karacasu, M., Er, A., Bilgic, S., Barut H.B., 2011. Variations in Traffic Accidents on Seasonal, Monthly, Daily and Hourly Basis: Eskisehir Case. Procedia Social and Behavioral Sciences, 20, 767-775
Levine, N., Kim, K.E., Nitz, L.H., 1995. Spatial analysis of Honolulu motor vehicle crashes: I. Spatial patterns. Accident Analysis and Prevention, 27, 663-674.
Li, L., Zhu, L., Sui D.Z., 2007. A GIS-based Bayesian approach for analyzing spatial-temporal patterns of intra-city motor vehicle crashes. Journal of Transport Geography, 15, 274-285. Mantel, N., Kryscio, R.J., Myers, M.H., 1976. Tables and formulas for extended use of the Ederer-Myers-Mantel disease-clustering procedure. American Journal of Epidemiology, 104 (5), 576-584
Mayhew, D.R., Ferguson, S.A., Desmond, K.J., Simpson H.M., 2003. Trends in fatal crashes involving female drivers, 1975– 1998. Accident Analysis and Prevention, 35, 407-415.
Ng, K., Hung, W., Wong, W., 2002. An algorithm for assessing the risk of traffic accident. Journal of Safety Research, 33, 387-410.
O’connor, P.J., Brown, D., 2006. Relative risk of spinal cord injury in road crashes involving seriously injured occupants of light passenger vehicles. Accident Analysis and Prevention, 38, 1081-1086.
Plainis, S., Murray, I.J., Pallikaris, I.G., 2006. Road traffic casualties: understanding the night-time death toll. Injury Prevention, 2, 125-128.
Plug, C., Xia, J., Caulfield C., 2011. Spatial and temporal visualisation techniques for crash analysis. Accident Analysis and Prevention, 43, 1937-1946.
Wang, C., Quddus, M.A., Ison, S.G., 2011. Predicting accident frequency at their severity levels and its application in site ranking using a two-stage mixed multivariate model. Accident Analysis and Prevention, 43, 1979-1990.
Xie, Z., Yan, J., 2008. Kernel density estimation of traffic accidents in a network space.
Computers, Environment and Urban Systems, 32, 396-406. Wallenstein, S., Neff, N., 1987. An approximation for the distribution of the scan statistic. Statistics in Medicine, 6, 197-207.