PERFORMANCE TEST ON UAV-BASED PHOTOGRAMMETRIC DATA COLLECTION
Norbert Haala a, *, Michael Cramer a, Florian Weimerb, Martin Trittlerb a Institute for Photogrammetry, University of Stuttgart
[firstname.lastname]@ifp.uni-stuttgart.de
b Institute of Flight Mechanics and Control, University of Stuttgart [firstname.lastname]@ifr.uni-stuttgart.de
Commission I, WG I/V
KEY WORDS: UAVs, Photogrammetry, Regulations, Sensor Orientation, Flight planning
ABSTRACT:
UAVs are becoming standard platforms for applications aiming at photogrammetric data capture. Since these systems can be completely built-up at very reasonable prices, their use can be very cost effective. This is especially true while aiming at large scale aerial mapping of areas at limited extent. Within the paper the capability of UAV-based data collection will be evaluated. These investigations will be based on flights performed at a photogrammetric test site which was already flown during extensive tests of digital photogrammetric camera systems. Thus, a comparison to conventional aerial survey with state-of-the-art digital airborne camera systems is feasible. Due to this reason the efficiency and quality of generating standard mapping products like DSM and ortho images from UAV flights in photogrammetric block configuration will be discussed.
* Corresponding author.
1. INTRODUCTION
The great flexibility of UAVs can enable new approaches during collection of remote sensing data, which for example integrate real-time mapping and autonomous navigation. Additionally, UAVs are establishing as serious alternative for traditional photogrammetric data capture, especially while aiming at mapping applications with high spatial and temporal resolutions. UAV-based photogrammetric data collection just requires a small, light UAV platform with a control system and standard consumer grade digital camera. Thus, the complete UAV system can be build up at a very reasonable price which is a order of magnitude lower compared to digital photogrammetric systems. Due to these reasons the application of UAV platforms for photogrammetric data capture can be very reasonable, especially at areas of limited extent.
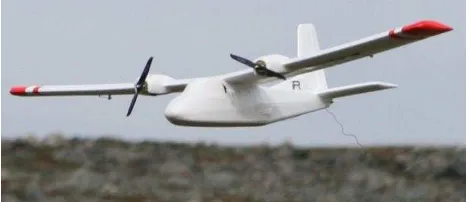
Within our investigations a low-cost fixed-wing UAV developed by the Institute of Flight Mechanics and Control, University of Stuttgart, was used. Since the system is low weight, compact size and robust structure, the handling is very convenient and the requirements on the landing site are relaxed. The airframe consists of Commercial of the Shelf (COTS) components, whereas the flight computer hard- and software is a self-development. The UAV is able to do autonomous waypoint navigation, take-off and landing. Ground station software is used to manage waypoint lists and to monitor the airplane during flight, although the autonomous operation is not affected by signal loss. Sensors onboard the airplane are 3-axis gyros, accelerometers, 3-axis magnetometer, barometer and a single channel GPS receiver. The information of the sensor readings is used to estimate flight path angles, velocity and position of the airplane.
In order to evaluate the capability and efficiency of UAV-based photogrammetric data collection, test flights were performed at the photogrammetric test site Vaihingen/Enz. The test area provides a number of signalized points, which are marked permanently with painted squares. This allows for the precise
target measurement in high resolution imagery. Recently, this site was also flown during a comprehensive test on the
evaluation of digital photogrammetric camera systems, which was organized by the German Society of Photogrammetry, Remote Sensing and Geoinformation (DGPF). Within this test, data from the latest generation of digital camera systems were captured and analysed (Cramer & Haala, 2010). The comparison to these results allows a benchmark of UAV-based photogrammetric data collection. As described in more detail in Section 3, UAV-based imagery were collected at a 1.3 x 1.5km² subarea of the test field with a consumer grade digital camera. The aspired ground sampling distance (GSD) of 8cm corresponds to image data as already available from the previous tests of digital photogrammetric camera systems. Within our investigations discussed in Section 4, the geometric performance of the UAV imagery in terms of accuracy results from bundle block adjustment are evaluated. Additionally, the quality of photogrammetric generation of Digital Surface Models (DSM) from image matching were investigated by comparison to high quality DSM from airborne LiDAR and from conventional aerial survey with state-of-the-art digital airborne camera systems. Furthermore, ortho images as one of the most important standard products for UAV in geomatics applications were generated and compared to the results as provided from digital photogrammetric camera systems.
2. UAV PLATFORM
up to 20 minutes on low wind conditions. Therefore it can cover a flight distance of roughly 20 km after subtracting some reserves for climbing and landing.
Figure 1: Used fixed-wing UAV platform in flight
Figure 2 shows a scheme of the on-board computer system and the applied sensors. A Microblaze Softcore microcontroller running at 70MHz is processing the autopilot software which consists mainly of navigation, flight control and waypoint navigation functionalities. A custom IP core on the FPGA is serving as a flexible I/O link to collect and pre-filter sensor data, drive servo actuators and motor controllers, link to the communications controller and trigger the camera.
Figure 2: Scheme of on-board computer system and applied sensors, actuators and communication interfaces
The sensor suite of the UAV platform consists of a low cost inertial measurement unit (IMU), magnetometer, barometric and differential pressure sensors and a GPS receiver. For evaluating the current position, velocity and flight path angles, the respective sensor data is fused in a loosely coupled Extended Kalman Filter (EKF). The horizontal 2D position error of the navigation solution lies within 3m RMS which corresponds to the accuracy of the used Locosys LS20031 GPS receiver. The vertical coordinate is provided at a similar accuracy mainly from the barometric height measurements.
The UAV can be monitored and commanded by a PC based ground station which is connected via RF link. A 2.4GHz or an 868MHz RF link can be used covering a range of 1.5 km or 4 km respectively. The advantage in range of the 868MHz modem has to be weight up against the significantly higher data rate of the 2.4GHz link depending on the actual mission. Additionally a SD memory card allows the logging of data for post processing purposes. The autopilot can be overruled by a
common RC link which allows a backup pilot taking over in emergency situations or e.g. for difficult landings.
The UAV system is capable of doing fully automatic flights along commanded waypoints including automatic take-off and landing. For waypoints, UTM coordinates or relative coordinates to the starting point can be loaded before or during operation. The controller guides the UAV on the connection line between two adjacent waypoints. Since the minimal turning radius is not considered it needs some care in choosing the waypoints. For the typical strip wise pattern in aerial photogrammetry it is important to set the waypoints already before entering the desired area to guarantee the UAV has reached the desired path after a turn.
Figure 3: Used consumer camera and mounting position on UAV belly
As shown in Figure 3, the camera for the aerial image collection is mounted to the belly of the UAV. The used Canon IXUS 100 IS is a consumer camera at a nominal focal length of 5.90mm. It features a 1/2.3” CCD which corresponds to a CCD sensor size of 4.62x6.16mm with 1.54x1.54m² pixel size each, which provides images of 3000x4000 pixel. The camera is triggered from the on-board computer via the camera USB interface in combination with a CHDK firmware. Before the photogrammetric flight the camera was calibrated, however, due the camera instability this a priori lab calibration only may serve as a first approximation of the real camera geometry during the evaluation of the flight.
3. TEST DATA
3.1 Reference data Vaihingen/Enz
later could be measured in the images, which partially was due to the sometime limited image quality.
Figure 4: Test-site Vaihingen/Enz, with signalized points overlaid to shaded DSM from airborne LiDAR
3.2 Flight Configurations
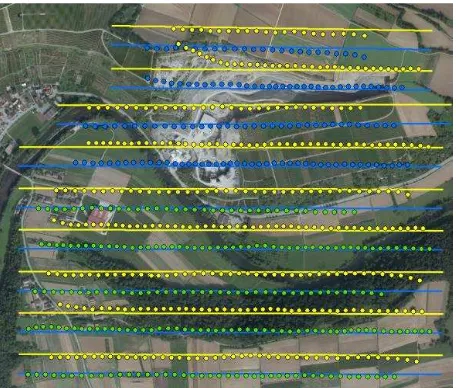
In order to capture images at a GSD of 8cm, the flights were performed at a height of approximately 300m above ground. This resulted in image footprints of approximately 235x315m2. According to flight planning, the area was covered with two flights at 9 flight-lines each. These flights are visualized in blue and yellow within Figure 5. To provide a stable image block configuration for the following investigations images were collected at a rather high overlap. An image rate of one shot each 1.5 seconds was selected. With the assumed cruising speed of 20m/s this resulted in a base-length of 30m and provided an overlap of 90% in flight direction. Across flight direction the nominal overlap was 70% as realized. This resulted in a distance of approximately 70m between neighbouring flight lines.
In addition to the flight plan, Figure 5 also shows the actual flights by overlaying the respective camera stations as available from GPS measurement. The first flight represented by the yellow points was collected as planned. During the second flight strong wind increased the power consumption of the UAV. In order to guarantee a correct realization of the respective mission, the planned second flight depicted by the blue lines in Figure 5 was separated in two subparts. These are represented by the green and blue camera stations in Figure 5. The wind also resulted on slightly different aircraft speed above ground. This speed was 22m/sec for the East-West strips and 18m/sec for the strips flown in West-East direction. Accordingly base lengths varied between 25m–35m with a mean of 30m. Flight one, represented by the yellow stations was collected in 12 minutes, flight two (blue stations) in 4 minutes and flight 3 (green stations) in 7 minutes. All these values do not include the required time for take-off and landing and navigation to first and from last camera station. Overall, the complete block built from all three flights comprised of 620 images. As it is also visible in Figure 5 the measured camera stations show a systematic deviation dependent on the flight direction in the order of 10m. This is due to a deviation in either aileron or rudder trim settings which could not be compensated by the yaw controller. However, suitable overlap was still
available for the image orientation and later DSM generation, which are discussed in the next section.
Figure 5: Test-site Vaihingen/Enz, with planned flight lines and camera stations from GPS measurment.
4. PHOTOGRAMMETRIC EVALUATION
Automatic aerial triangulation (AAT) to determine the orientation of the captured images usually is the first step of photogrammetric evaluation. Commercially software systems to solve this task are available for more than a decade (Tang et.al., 1997). As a central component, these systems contain image matching tools for the generation of tie points. The required automatic measurement is usually realized at sufficient accuracy and reliability by a combination of standard feature and intensity based matching approaches. Primitives suitable for image matching are extracted in a first step, while in a second step their correspondences are determined by some similarity and consistency measures (Förstner, 1993).
In order to efficiently transfer the extracted feature points to the respective neighbor images, usually a priori information is additionally integrated in order to speed up the required search effort. For this purpose the respective image overlap is provided from the so-called block configuration. By these means, suitable search areas can be defined, which considerably speeds up the matching step. For standard aerial image flights this block configuration is usually derived from the respective camera stations as provided from GPS measurements. In principle, camera orientation can additionally be used, if for example measured by an integrated GPS/inertial system. However, for block configuration of photogrammetric flights with large format cameras, the assumption of nadir views is usually sufficient. This initial guess hold especially true if the camera is mounted in a stabilized platform.
4.1 Block configuration using image graphs
In contrast, Snavely et. al. (2007) already demonstrated the successful modeling of the required image connectivity for large, unordered, highly redundant, and irregularly sampled photo collections. During the Photo Tourism Project of the University of Washington, this approach was implemented in
the software system “Bundler”, which is distributed under the
GNU General Public License (Snavely et. al. 2007). Originally, this project aimed on the ‘location-based’ combination of images from either personal photo collections or internet photo sharing sites by an automatic bundle block adjustment. Similar to standard block configuration, the mutual image overlap is reconstructed as a first step. This is represented by an image graph consisting of a node for every image and a link between any pair of images with common features. Feature matching is realized using the SIFT operator (Lowe, 2004). Starting from SIFT keypoints extracted in a base image, a pairwise matching searches the feature with the closest descriptor in the potential match image. For efficient performance despite of the high dimensionality of SIFT features, an approximate nearest neighbors search is applied within this step. The bundle is then initialized by an image pair with sufficient point correspondences which allow for a computation of the relative orientation by the 5-point algorithm (Nister, 2004). This step additionally provides 3D coordinates of the matched feature points. As initial stereo model a pair with many matches and a large baseline is selected. The image block is then successively grown by adding other images and reiteration of bundle block adjustment. For this purpose images containing a sufficient number of 3D points already computed in the previous steps are selected.
4.2 Interface to standard processing chain
In principle, the result of bundle block adjustment from the
“Bundler” software can already be used for rectification of the
collected imagery (Kichgäßner et al., 2010). In contrast, for the tests presented in this paper, the processing results are used to initialize the evaluation with the standard AAT software package MATCH-AT (Sigle & Heuchel, 2001). For this purpose, the orientation parameters as available in a model
coordinate system after “Bundler” processing were transformed
into the reference coordinate system. This was realized by a 7-parameter transformation estimated from the camera stations, which were additionally available in the reference system by GPS measurements. Thus, the respective camera orientations were available in the reference system at suitable accuracy to allow for block configuration within the standard AAT software. Within this software manual measurement of signalized points was then performed as additional information in order to perform and evaluate the results of the AAT as discussed in the following section.
5. ACCURACY INVESTIGATIONS
5.1 Automated aerial triangulation (AAT)
As already explained in the Section 3.2 the image block was captured with high overlap conditions. The 90% forward and 70% sidelap finally leads to up to 50 folded points maximum. The strong overlap conditions are advantageous both for the following bundle adjustment and DSM generation. For our tests about 30 signalized points were available, which were measured manually. Due to the very strong overlaps, this was a quite
tedious work, which also was affected by the partially quite low image quality.
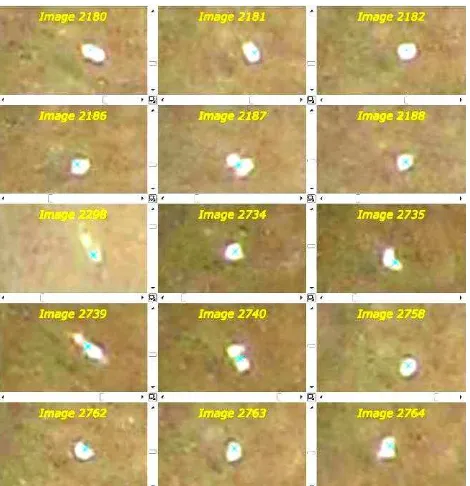
Figure 6: Ground control point #119 as imaged in some of the tied images.
Figure 6 exemplarily depicts a control point, which appears very different in the corresponding images. The cross indicates the manual measurement. Since the used camera does not compensate for the sensor movements during image acquisition
– a method which is standard for large frame photogrammetric cameras – images can be blurred. Thus the identification of the centre of the signal is difficult which limits the accuracy of point measurements and the whole AT.
After measurement of the signalized points the automatic tie point transfer was realized using the MATCH-AT software. For matching standard tie point density with tie point centres arranged in a 4x4 pattern was used. The matching itself is based on a combination of feature based matching and least squares matching through different pyramid levels. By these means altogether 119364 image coordinate measurements were obtained automatically for 9446 terrain points.
errors in the GPS positioning. This effect was not modelled by additional strip-dependent drift corrections later, because this would have negative influence on block stability. Instead the a priori accuracy of GPS perspective centre coordinates was chosen quite conservatively, namely 4m (STD) for each axis.
0 100 200 300 400 500 600 700
Figure 7: Differences at camera stations between outcome from MATCH-AT and GPS measurement.
The final AT was based on the image observations, the observed GPS perspective centre coordinates and the terrain coordinates of 26 control points. Two of the altogether 31 points were almost not visible in the images and thus have not been considered in the AT, three others had errors in their control point coordinates. Appropriate weightings were assigned to each group of observations. In order to compensate additional systematic effects in imagery a 44-parameter correction polynomial as proposed by Grün was used for self-calibration (Grün, 1978). The shift in the GPS vertical axis was modelled with an additional Z-offset parameter. This allowed for GPS drift correction, but without linear correction term here.
Residuals (RMS)
Table 1: Results from final AT of image block The basic results i.e. residuals of observations and precision of adjusted parameters are listed in the Table 1. As visible there are clear differences in the automatic and manual image point measurements. This clearly reflects the problems with manual point identification. These problems can be seen in the RMS values of 3D control points. The precision of 3D tie points, as defined by the automatic tie point measurements, is well within one pixel for the horizontal component. This also corresponds to the sigma naught value, which is 2.1m or 1.4pixel. The vertical precision is worse, reflecting the smaller opening angle of the optical system which negatively influences the base-to-height ratio.
However, these numbers do not fully reflect the absolute accuracy of the bundle block adjustment due to the limited number and quality of ground control. Since all of them were used with the adjustment no additional check point information was available. The residuals in control points, which can be
used as measure of the absolute accuracy are significantly larger than expected for flight with conventional photogrammetric systems. This can also be seen from the GPS perspective centre coordinates. This may indicate that there are some systematic effects in the block which will be of negative influence on the external accuracy.
In order to estimate the accuracy in object space, the 3D coordinates of adjusted tie points were firstly interpolated to the reference DSM from LiDAR. The RMS of height differences is 4.5m, with maximum/minimum differences in the range of ±50m, which are partially from differences at vegetation. Additionally, there are quite large terrain changes in some parts of the quarry. Nevertheless it also has to be mentioned that the vertical difference shows a systematic behaviour influenced. There is a clear upward bowing in the middle of the block, i.e. the object points are below the reference surface at the borders but above the reference surface in the block center. The reason for this systematic upward bowing is not fully clear. The available block geometry is rather strong due to the high image overlap, however, the systematic differences may either come from problems in GPS measurement or camera calibration. An unstable camera geometry might occur for low cost consumer cameras as used in our system. Within our investigations the estimation of physical relevant camera correction parameters was not considered within the AT runs, because of the limited accuracy of GPS observation and the strong correlation with the exterior orientation of the sensor.
5.2 DSM generation
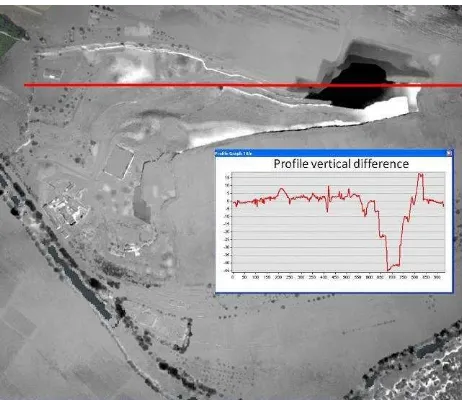
In order to illustrate the systematic upward bowing and the changes in terrain more clearly, a DSM was generated based on the results from the AT using the MATCH-T software. This surface derived from the UAV images then is compared to the reference LiDAR DSM again.
Figure 8: Difference of LiDAR DTM and DSM from UAV image flight
based DSM measurement. Additionally, the real changes in terrain of the quarry can clearly be seen. The white parts of the difference image indicate gravel or earth deposit, the dark region is a digging area with about 45m depth. These changes of the terrain surface can also visually be inspected when comparing the two corresponding ortho images. It is less than three years which are between the LiDAR flight and the UAV test presented here. The LiDAR data was flown in August 2008 (as part of the DGPF evaluation test), parallel to classical large format photogrammetric digital camera systems.
5.3 Ortho image generation
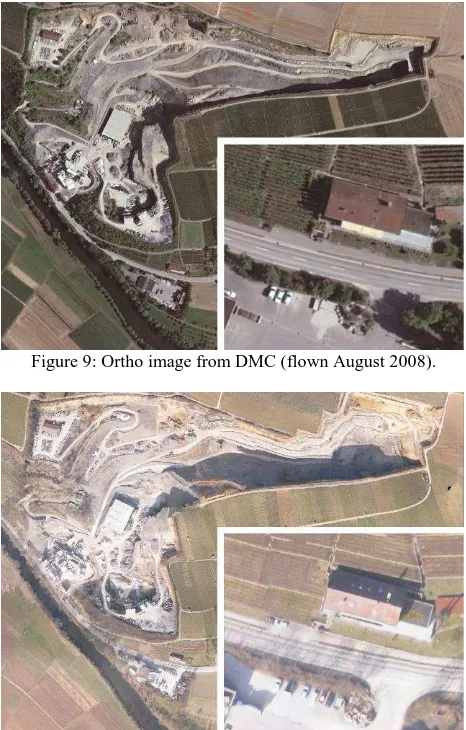
Figure 9 shows the ortho image of the test area obtained from DMC images flown in 2008. Figure 10 provides the corresponding ortho image from the more recent UAV imagery. In addition to differences from time dependent changes of terrain and vegetation, differences resulting from the varying quality of the two sensors are clearly visible. As expected, the DMC images provide a much higher radiometric quality. In some parts the UAV ortho image is also affected by the strong image blur because of the sensor movements. This might be limited with shorter exposure times and additional stabilization to separate the camera from the movement of the carrier, at least to a certain extent. However, the two insights for a building in Figure 9 and Figure 10 illustrate that the final ortho images from both sensors are quite comparable. Especially notice the straight lines of the building roof, which indirectly shows the quality of the underlying DSM in case of the UAV ortho image.
Figure 9: Ortho image from DMC (flown August 2008).
Figure 10: UAV ortho image (flown in March 2011).
Figure 11: Perspective view of UAV ortho image draped over computed DSM
The good relative accuracy, which is available from the UAV imagery is also illustrated by the 3D visualisation in Figure 11. This also demonstrates that despite some remaining problems in absolute accuracy, standard mapping products like DSM and ortho images can be generated very well from UAV imagery.
6. REFERENCES
Cramer, M. & Haala, N. (2010): DGPF Project: Evaluation of digital photogrammetric aerial-based Imaging Systems – Overview and Results from the Pilot Center, Photogrammetric Engineering & Remote Sensing Vol. 76, No. 9, September 2010, pp. 1019-1029
Förstner, W. (1993). Image Matching. In: Haralick R.M. & Shapiro L.G. (eds.), Computer and Robot Vision AddisonWesley Publishing Company.
Grün, A. (1978): Accuracy, reliability and statistics in close-range photogrammetry, Inter-congress symposium, International Society for Photogrammetry, Com. V, Stockholm, Sweden. Kirchgässner, U., Putze, U., von Schönermark, M. & Haala, N. (2010) Anforderungen an die Auswertung UAV-gestützter Fernerkundungsdaten DGPF Tagungsband 19/2010 – Dreiländertagung OVG, DGPF und SGPF pp. 597 – 605 Lowe, D. 2004: Distinctive Image Features from Scale-Invariant Keypoints In: International Journal of Computer Vision. Vol. 60, No. 2, pp. 91-110.
Nistér, D., 2004. An efficient solution to the five-point relative pose problem. IEEE Transactions on Pattern Analysis and Machine Intelligence (PAMI), 26(6), pp. 756-770.
Sigle, M., Heuchel, T. 2001: MATCH-AT: Recent Developments and performance, Photogrammetric Week 01, pp. 189-194.
Snavely, N., Seitz, S., Richard Szeliski. (2007) Modeling the World from Internet Photo Collections. International Journal of Computer Vision, 2007.
Tang, L., Braun, J., Debitsch, R. (1997). Automatic Aerotriangulation - concept, realization and results. ISPRS Journal of Photogrammetry & Remote Sensing 52(1997), 122-131.