A. Pérez1
, R. Cachero1
, S. Navarro2
, F. Jordá1
, D. López1
, J.L. Lerma2
, A. Martos3
1
Metria Digital, S.L. Parque Tecnológico de Asturias, Edificio CEEI. 33428 Llanera, Asturias, Spain (aperez, rcachero, fjorda, dlopez)@metria.es
2
Dpto. Ing. Cartográfica, Geodesia y Fotogrametría. Universidad Politécnica de Valencia. Cº de Vera, s/n. Edificio 7i. 46022 Valencia, Spain
sannata@topo.upv.es, jllerma@cgf.upv.es
3 Laboratorio de Visión por Computador. Departamento de Informática. Universidad de Oviedo. Aulario Sur, 1.S.24. Campus de Viesques. 33204 Gijón, Spain
martos.antonio@gmail.com
Reconstruction, Orthoware, photogrammetry, orthophotograph, digital three?dimensional model, dense surface model, true?orthoimage, rectification, documentation, heritage
This paper describes the surveying process performed on the Church of San Ildefonso in Zamora (Spain) using Orthoware©, an innovative photogrammetric software tool specially designed for the digital reconstruction of cultural heritage. This software is the result of intense R&D at Metria Digital after several years producing heritage true orthoimages, plans and full color 3D models in a commercial environment. Orthoware allows true measurements and produces high quality true orthoimages and full color 3D models starting out from conventional digital photographs. This is a progressive tool designed for non?specialist users, providing intuitive and quick methods to visually diagnose the quality of the results.
The Church of San Ildefonso in Zamora was built over a previously existing temple whose Romanesque construction dates back to the 11th century, although it is nowadays hidden among extensions and remodelings carried out up until 18th century. With a length of more than 30 meters, the original floor plan of the Church consists on three naves and three apses, although only one nave is visible now, covered by groin vault, and one semicircular apse partially hidden by the current building. The south front maintains the greater part of its Romanesque origins, in spite of being hidden and higher than the present ground level. At the feet of the temple a tower rises, whose first stage is Romanesque but which has been altered by numerous Baroque elements.
The objective of the photogrammetric reconstruction was the integral survey of the monument, including its four façades, interior faces and roofs for the production of some true?orthoimages, cross?sections, longitudinal?sections and ground plans at scale 1/50 with an accuracy of 10 mm for the drawings and a pixel size below 10 mm for the synthetic imagery.
The usual photogrammetric workflow for producing true?orthoimages and digital 3D models in cultural heritage depends to a great extent on finding and matching homologous features amongst various images. This is a time?consuming, repetitive and blind recognition process requiring some spatial intuition and experience from the user. Orthoware makes use of automatic image analysis and computer vision techniques to improve this processing. Its innovative graphic user interface allows full interactivity and corrections or refinements to be performed at any time providing intuitive diagnostics from partial results. This flow involves very intensive calculations achieved through a software development specific for GPU (Graphic Processing Unit), using OpenGL (Open Graphics Library) and DirectX. Therefore, a combination of manual and automatic techniques makes up the ideal tool for a production environment. The workflow presented herein allow users to reduce orthoimage production time from months to just a few weeks.
!"#$%
There are many different examples showing the convenience of close?range photogrammetry techniques for the documentation of cultural heritage elements and sites producing maps, plans, orthoimages, panoramas or textured digital 3D models [Boccardo et al 2002, Elwazani et al 2007, Almagro et al 2007, AvKar et al 2008, Fangi 2007, Yoshitake et al 2008, Moser et al 2007, Patias et al 2007, Moullou et al 2007]. The elaboration of these technical documents is indeed in accordance with the Charter of Venice 1969 and Cracow 2000, in which “the 'restoration project' should be based on a range of appropriate technical options and prepared in a cognitive process of
gathering knowledge and understanding of the building or site. This may include traditional and subsequent new materials, structural investigations, graphical and dimensional analysis and the identification of historical, artistic and socio cultural significance”.
3D models, in as much as they can make this transition more natural, and they contain advantages of both. True orthoimages have colour, detail and are accurate and completely objective. Furthermore, they are easy to show, understand and manage as digital or printed files, and can conveniently overlap with maps and plans. Frequently, it is easier and faster to first generate a high resolution true?orthoimage then draw the plan over it.
& '( $ )%(*"$+" '#! '
The San Ildefonso Church is considered, after the Cathedral, as the most precious monument in the City of Zamora, jewel of the Romanesque in Spain for the abundance of monuments of this style to be found there today, there being more than 25. The origin of this Church may go back to the Visigoth Era, and there are buried, according to tradition, the remains of San Ildefonso and of San Atilano.
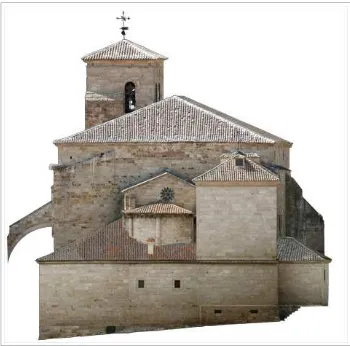
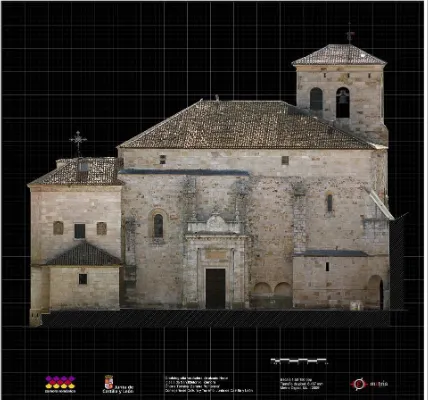
The Church (Figure 1) was rebuilt towards the end of the eleventh century, and was restructured and enlarged at the end of the twelfth century and throughout the thirteenth. In the fifteenth century it was renovated and the structure and features of the temple changed, substituting the three naves for one roof with four crossed elongated vaults and so being necessary to put the flying buttresses. At the beginning of the seventeenth century the sacristy was rebuilt and the main chapel renovated. At the beginning of the eighteenth interior repairs were carried out and the west façade was built. Towards the end of the same century the neoclassical north façade was built.
Figure 1. Exterior of the San Ildefonso Church
At present, with dimensions of approximately 40 meters in length by 30 meters in width and 30 meters in height, it has one sole nave divided into four sections by side arches which are supported by adjoined polygon based semicolumns, except one which rests on the walls of the Church and the tower. The vault is starred with many bosses (Figure 2).
The carrying?out of the graphic documentation of the temple was complete in character and was commissioned by the Fundación Zamora Románica, an institution dependent on the Consejería de Cultura de la Junta de Castilla y León.
, -()% ."! $% "**- ( /!" (++-$
The digital reconstruction of the San Ildefonso Church, and generally any heritage building or site, requires well planned field work and the subsequent office processing. In our experience, the field work procedures are already highly optimized as they can be performed by a small team comprising one or two people in just one day using only light equipment.
Figure 2. Interior of the San Ildefonso Church
However, the office processing of collected data remains even today somewhat of a bottleneck in productivity as the close? range photogrammetry applications commonly employed either inherit in many cases the work philosophy of aerial photogrammetry, with slight improvements, or must be used by specialized users, apart from being slow and offering little interactivity
Orthoware software greatly solves this situation since it is a tool easy to use by non?photogrammetrists, automating to a great extent all the routine tasks to the point that the users need only to evaluate the results and make decisions. It provides a fast and easy startup, evolving progressively towards the results with the accuracy and detail required
The detection and marking of hundreds of homologous characteristic features in the working images are performed through the use of algorithms based on diverse computer vision techniques, these being correlated and filtered in order to avoid false correspondences. In this way, the relative orientation and position of the cameras is calculated without the user needing to intervene.
If this automatic method fails, it is easily detectable (Figure 3) the user being able to correct it manually or through the use of semiautomatic tools. Starting out from these “seed” points, the relative orientation and the position of the cameras are recalculated precisely, then a process of auto?calibration of the cameras can be carried out in order to recalculate precisely the internal parameters for each of the images used starting out from the initial laboratory parameters or the EXIF data in its absence.
The final densification of the model is performed through the calculation of a detailed disparity map employing correlation. This map provides the slight corrections necessary and produces millions of new homologies with noise which is subsequently filtered. Having seen the disparity map, the user can decide which areas are considered to have been modeled in compliance with defined requirements for precision and detail, and, with those that do not, input a new point to refine the initial reference surface and repeat the process. In this way, the user need only outline the areas of interest and correct the areas where the correlation failed, which can easily be detected visually.
A key concept in the design of the software for carrying out these tasks is the creation of an innovative graphic user interface which allows great interactivity and the carrying?out of corrections through partial result diagnostics. This requires highly intense calculations achieved through the GPU (Graphic Processing Unit) employing the OpenGL (Open Graphics Library) and DirectX graphic libraries (Martos et al 2008).
&
& -()% ."! /) $$-$
Table 1 shows the work objectives initially proposed by the client and the objectives finally agreed. It is necessary to carry out an evaluation of the initial objectives to verify whether they coincide with the current needs of the client, together with their technical and economic viability.
Initial Objectives Agreed Objectives
4 exterior elevation plans 4 exterior elevation plans
2 longitudinal?sections 4 longitudinal section? elevations
2 cross?sections 4 cross section?elevations
Floor plans and roof plans Floor plans at various heights of the Church and tower
Plan of location and exterior surroundings
Plan of location and exterior surroundings
Table 1. Initial objectives and agreed objectives
The scale of representation agreed with the client was 1/50, except for the plan of location and exterior surroundings, where a scale of 1/200 was used.
The real needs of the client were completely satisfied by the agreed objectives. It is worth pointing out that the sections schematized in Figure 4 show sections which allow the most important constructed elements to be visualized, such as the altar, the cupola and the skylight of the north lateral chapel, the vault of the Romanesque apse, the unique entrance to the sacristy, or the access to the apse. Furthermore, the cross? sections were not perpendicular to the longitudinals as the client was interested in the main cross?section sectioning the North and South façades through the centre.
Once the objectives to be completed have been established, it is essential to set out a good project plan both for the field work and office processing of collected data in order to guarantee an efficient execution. Therein adequate techniques for each process and materials to be used, together with an adequate sequence for data collection was established.
Figure 4. Sections outline
When carrying out field work, it is essential to complete two objectives. The first involves collecting all the data necessary to represent each of the elements required (heights, sections, floor plans) individually.
The second involves interconnecting each one of these elements with each other. To achieve this, a high precision topographic network was carefully planned using forced centering and adjusted by least squares. The reference system used was based at the monument, initially identifying the main longitudinal and cross?sections, materializing what we call “unique point of the project” defined by the intersection of both sections. The initial orientation corresponded to the main longitudinal section, which defined the East?West line.
With these axes, the data from the sections were extrapolated to the various rooms quickly and simply, identifying in each a minimum of two points at the same level on each face.
The material used consisted of a reflectorless total station (Leica TCR 703), laser topographic level (Leica Rugby), electronic distancemeter, calibrated metric tape, Canon EOS 5D digital SLR camera with fixed Canon 85mm, 50mm and 24mm lenses, all of which were calibrated, together with accessories for topographic equipment, lighting equipment and a servo? elevation system for the camera.
& & -()% ."! (0( #1-"$
The fieldwork was carried out following the established project plan, employing various techniques and methodologies simultaneously as the conjugation of all these leads to a more efficient data collection process and guarantees the completion of objectives. The following types of task were carried out: sketching, manual measuring, topographic data collection, and photographic data collection.
& & & $# ) 2( +#!(2($1+ In those rooms where other measurement techniques were unviable, manual measurements were carried out together with detailed sketches, use of distancemeter, goniometer and metric tape.
For specific more complex elements, manual measurement annotations were performed on specific detail sketches, thus achieving greater quality in the planimetric representation which is finally handed over to the client.
Finally, the manual measurements were used to check the photogrammetric measurements.
& & , "))( 1-"$ "* 1"/" ! /'- % 1 The starting point was the fundamental network described in the project plan, collecting the data necessary for the drawing up of the floor plans, necessary sections and elevations, together with the coordinates needed to perform the external orientation in the photogrammetric process. Reflectorless measurements as well as miniprism measurements at low height to reduce signal error and shot error were used.
Also, all rooms and the exterior of the Church was leveled to check the measurements redundantly, to perform the photogrammetric projects and to facilitate the relationship between the different rooms.
& & 3 "))( 1-"$ "* /'"1" ! /'- % 1 A Canon EOS 5D SLR camera was used with calibrated lenses (converting a conventional camera into a semimetric camera). The shots were taken in RAW format with a resolution of 4368 x 2912 pixels. For the calibration of the lens?body set, we start out from an initial laboratory calibration to subsequently employ the Orthoware autocalibration method, which allowed us to obtain the accurate internal orientation parameters for each camera position. Convergent shots were taken as field data collection is more efficient and much more flexible to any situation instead of stereo pairs often used in close?range photogrammetry.
,
, ) $$-$ "* "**- ( /!" (++-$
Due to the great complexity of the monument, it was necessary to carry out a total of seven photogrammetry subprojects, to be subsequently interrelated through the manual measurements and topographic data collected in the field.
Table 2 lists the projects, the number of images included in each, and the reference system used (topographical or non related).
, & 0( #1-"$ "* "**- ( /!" (++-$
The following describes the photogrammetric process employed in carrying out the projects.
, & !(4-"#+ ) ++-*- 1-"$ "* 1'( -2 (+ This is essential in order to complete a project quickly and efficiently. Various factors were taken into consideration such as image coverage, overlapping, angle between shots and image distribution.
, & & !"5( 1 +1 !1#/ #+-$ !1'". !( The images included in the project were taken using lenses with focal length of 24mm, 50mm and 85mm. Orthoware allows the corresponding camera model to be assigned to each image, and also organize them according to any criteria of choice such as shooting
location, level of detail, image quality, etc.
Name of project Number of images Reference system
Exterior 80 Topographical
Central Nave 45 Topographical
Crypt 11 non?related
Bell Tower 11 non?related
Lower Bell Tower 14 non?related
Museum 13 non?related
Dovecote 8 non?related
Table 2. Photogrammetric projects performed
, & , +6 -$-1- ) /'"1" "!-($1 1-"$ To identify and pair some homologies manual and semiautomatic tools were used, marking unique elements identified in various images. These could be previously placed targets or characteristic elements such as corners, peculiarities in the stones, holes, screws, etc.
Orthoware assists the user by means of automatic image matching, speeding up initial orientation of the photographs.
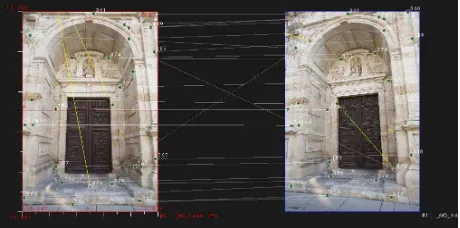
For the location of these features the descriptor search process called Speeded Up Robust Features (SURF) is used [Bay et al 2006]. SURF is a variation on the SIFT algorithm, which bases its detector on a Hessian matrix. The pairing process of the SURF descriptors follows nearest neighbor search (NNS) algorithm, in which the pair is selected by calculating the euclidean distance. The descriptor is considered paired if the distance between the first and second pair is greater than the established tolerance, generally 0.6 times the distance from the second pair (Figure 5).
Figure 5. Automatic photo orientation using SURF feature matching on the South front
The matching algorithm provides:
• Distinctive interest point descriptors.
• Speed?up descriptors matching.
• Fast interest point detection.
The SURF limitations due to lighting levels and changes in points of view should be considered when taking the photographs in order to decrease the orientation assistance.
The matching of NNS features is re?enforced through the elimination of false positives by means of Random Sample Consensus (RANSAC) on the fundamental matrix [Hartley et al 2003]. This is also useful for generating a 3D point cloud in the space which will serve as support for the correlation and calculation of disparity maps.
It should be pointed out that the accuracy achieved by this method depends directly on the number of images and its geometric configuration. The correct identification, matching and distribution of marks is indispensable in assuring the robustness of the mathematical model calculated.
, & 3 () 1-4( !-($1 1-"$ In this stage the instant of the shot is reconstructed and the quality of the project is checked as adequate to meet the objectives.
The evaluation of project requires the analysis of the various values obtained in the orientation processes. For the homologous points, their residual values, intersection angles and number of images are studied. With regards to each image, its RMS value, overlap, number of marks and distribution of points. This data can be observed in the information tables provided by Orthoware.
, & 7 )-8! 1-"$ Due to the use of semi?metric cameras ? in which the focal distance varies when focusing, and given that it was assumed that the distance from the object to the camera was similar in all shots (thus the focus was nearly constant) ?, a field calibration was considered to determine the best camera model at the instant of the shot.
The result can be refined through a bundle block adjustment. In this way the internal camera parameters are obtained at the time of the shots, achieving results better than a third of a pixel in image space, achieving greater accuracy.
, & 9 8+")#1( "!-($1 1-"$ The three?dimensional transformations of the photogrammetric model for the various projects were carried out in two distinct ways: a) using control points of known coordinates which were identified in the various images, b) using leveled targets and specific measurements (at those rooms in which it was not possible to carry out control points).
, & : "%()-$ In order to generate the three?dimensional models, different types of surfaces which accurately represent the object in study were carried out. Employing the Orthoware marking and surface generation tools the modeling of the monument was achieved in an unusually simple way. For complex elements where manual modeling proved to be very costly, the correlation automatic tools were used.
The analysis of the position taken up by one pixel in an image in relation to another is performed through correlation techniques, generating with this a disparity map which holds a direct relation with the detailed geometry of the object.
Orthoware allows the creation and editing of disparity maps through the synthetic images generated, in this way allowing the user to improve the final result.
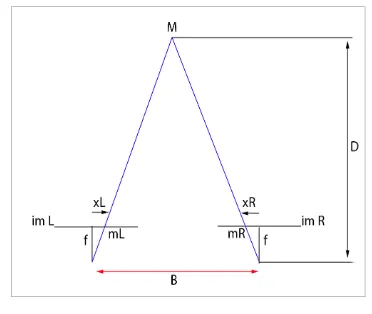
The relation that the disparity holds with the depth can be seen in Figure 6.
Figure 6. Graphic relation between disparity and depth
(1)
Where: D = depth
f = focal length of the camera B = base
d = disparity (xL ? xR)
λ = unit conversion factor (mm/pix)
The procedure for the calculation of the disparity maps (1) follows the pyramidal adaptive surface technique, which the correlation (2) adapts to the surface at each pyramidal level of the image.
(2)
Where: σra, σr, σa= covariance and deviations in levels of gray
in reference and adjust gr and ga areas respectively.
With the aim of improving the estimation of the position, Orthoware offers the possibility of entering the mathematical Least Squares Matching (LSM) [Gruen et al 1986] and Multi Photo Geometrical Constrained (MPGC) matching [Remondino et al 2008].
The idea of the LSM method is to minimize the difference in the levels of gray between the reference and search windows. The method adjusts the windows through an affine transformation, with geometric and radiometric parameters to find the position of the reference window which best fits the search window. The positional accuracy obtained with this method ranges between 0.1 and 0.3 pixels.
One disadvantage of this method is that position parameters require 1?2 pixels discrepancy, a maximum discrepancy of 23º in rotation and variations in the factor of scale and affinity up to 30 % [Lerma 2002]
The general expression of LSM (3):
(3)
Where: d1 = contrast.
F=d1⋅g 'a1xb1yc1,a2xb2yc2d2=gx , yrx , y CoefCorr= ra
r⋅a
= gr−r⋅ga−a
gr−r2
⋅ga−a
2
−1≤CoefCorr≤1 D=λ⋅B⋅f
d2 = brightness
a1 , b1 , c1 , a2 , b2 , c2 = affine transformation
parameters.
The MPGC method uses knowledge of the geometry of camera orientation in order to constrain the correlation search and allows the use of more than 2 images in the calculation of disparities [Gruen 1985, 1988], reducing in this way the search area.
Once the disparity maps are generated, and conveniently edited, 3D models of the surface of the element can be obtained creating a model through the disparity map, obtaining a view divided model, which can be joint to obtain the complete 3D model of the object.
, & ; 0/"!1 1-"$ The exportation of all the information generated (raster and vectorial) was performed efficiently for its subsequent editing in other specific CAD and image processing applications. Orthoware performs this process quickly and departing just from original photographs with no intermediate rasterizations.
3 <
3 -$ ) "!1'"-2 ( "2/"+-1-"$
The exportations carried out previously provide all the information necessary to generate the final orthoimage (Figure 7). This is a synthetic image made up of multiple layers of raster information. Its editing includes, amongst others, a geometric adjustment performed through a vectorial model and a radiometric equalization.
3 & ( '$- ) %! .-$ +
Concurrent with the photogrammetric project drawings of floors, elevations?section and topographic survey of the surroundings were made.
3 & ( 1-"$=()(4 1-"$+ For the technical drawing of sections, all singular points measured with the total station were imported into CAD, with which a first draft of the section was quickly drawn up. Subsequently it was completed with the detailed sketches, the orthoimage layers and the opportune measurements carried out on the photogrammetric project.
Figure 7. Final orthoimage composition of East façade
Orthoware allows to export the required points to CAD maintaining the reference system in which the section is taken with the total station. The orthophotograph (Figure 8) was positioned in accordance with the control points.
3 & & )""! /) $+ Practically the same steps were followed as in the previous case, that is, starting out from the total station measurement data, a first floor plan draft was drawn up and subsequently completed with the manual measurements shown in the detailed sketches. Convenient measurements were also taken in Orthoware on the photogrammetric project.
Figure 8. Longitudinal section?elevation through the central nave
3 , , 2"%() ($(! 1-"$
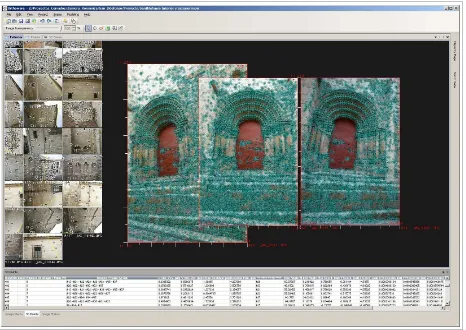
For this project both point cloud models and texturized models were produced. The objective was to allow their visualization in multiple media environments. Figure 9 shows the 3D point cloud model obtained from the exterior photogrammetric project using semi?automatic and manual methods.
By means of the automatic Orthoware Correlation tool a dense point cloud of the Romanesque apse on the East façade was generated, allowing swift and accurate modeling of this complex part of the monument. Various decorative elements were present on capitals and corbels over its cylindrical geometry. From this point cloud a texturized meshed 3D model was generated which is shown in Figure 10.
Figure 10. Detail of the texturized 3D model of the Romanesque apse on the East façade
3 3 -$ ) /!(+($1 1-"$
The orthoimages adequate for printing (Figure 11) are digital images which require a resolution of 150 to 300 pixels per inch and 32 bits color depth. To facilitate its reading ? given its metric character – a subdivided regular grid which corresponds to the graphic scale of the representation is usually included. In this way, extracting measurements and carrying out a pathological analysis straight from the printed document is simple and intuitive, at the same time as the drawings necessary for the completion and comprehension of the orthoimage is included in the print.
The same printing format is found in digital format, typically in tif, jpg, pdf and dwg formats. The vectorial drawing is combined with the final composition of the orthoimage in tif format, providing objectivity, completeness, accuracy and detail all integrated in one document. As a product, the true orthoimage does not only complement but improves the existing information content of planimetries or vectorial elevations due, above all, to the fact that the orthoimage is a non interpreted cartographic product, which can also be used to generate additional products such as planimetries, 3D models or multimedia products [Pérez et al 2006].
Figure 11. Orthoimage of the North façade in printing format
7
The San Ildefonso Church in Zamora presented a series of distinctive characteristics which made its digital reconstruction difficult and laborious. Amongst these are its dimensions, the number of elements, the various extensions and conversions throughout history, and its location in the historic quarter of Zamora.
The limited width of the streets on the East and South façades, barely 4 meters adjoining such a large edifice, imposed the taking of many photographs. The Romanesque apse was located in one of these streets at 8 meters above ground level, therefore a combination of long and short focal length lenses was necessary to take photographs at short and long distances.
Given the dimensions of the monument, both in the central nave and exterior elevations, it was necessary to use elevation equipment to take the photographs at distinct heights and so increasing the number of shots of each wall. The elevation equipment used, that is, telescopic pole, ladders, and pneumatic mast were equipped with a platform with servomotor and radio control, on which the camera was housed in order to take adequate shots. The exterior also offered an additional problem produced by the narrowness of the streets as there was not sufficient light in the lower areas to take the photographs with the necessary quality, for which reason long exposure times were used.
Amongst the objectives was that the façades should appear in a way that maximized the real magnitude of each elevation. Given that the monument presented exterior walls which were considerably out of square, it became necessary to establish different projections parallel to the elevation represented in each case.
In order to relate the exterior and interior data, the topographic precision net was used, so allowing the location of hidden cavities and establish the thickness of the apse walls. In those locations in which it was not viable to position topographic bases, the link of the various elevations, sections, and floor plans was made by merging the exterior photogrammetric data with the interior data, measuring the window, door, and floor cavities, also using the leveling targets.
The little light that the doors and windows of the temple allowed in was insufficient for the shots, it being necessary to use auxiliary information. The vault ribs were measured with great care due to the difficulty of representation on section? elevations. A scrupulous manual measurement of the details that could not be obtained any other way was also performed.
One of the greatest inconveniences the field work in the interior of the Church presented was undoubtedly having to respect worship timetables, for which reason a great part of the decorations and furniture could not be moved. At the same time, there were areas where access was not possible such as the room above the altar, where the remains of San Ildefonso lie; or where access was difficult or limited such as the cellar and the boiler room (which had a section of 1.5 x 1 m). For this reason, work had to be carried out rapidly and an extra effort made to represent these elements.
monitors to be used at the office adjusted to guarantee the radiometric quality of the final photogrammetric product.
9 projects which initially do not enjoy a large budget. The use of the Orthoware software tool for the office processing, to a great extent, automates the production of true orthoimages and digital 3D models, the user only being required to evaluate results and take decisions, thus significantly reducing total execution times.
As a product, true orthoimages not only complement but improve the information content existing in plans or vectorial elevations due, above all, to the fact that it is a non interpreted cartographic product, containing color, texture, accuracy, and detail. These are a good compromise between the plans and 3D models as, having the advantages of both, they can make this transition in a natural way.
The combination of these photogrammetric tools with others like topography or manual measurement tools offers the user the potential and flexibility necessary in performing an exhaustive documentation of any monumental real estate no matter what its size or location, thus establishing a new benchmark in the state of the art.
:
Almagro A., Almagro Vidal A., 2007. Traditional Drawings Versus New Representation Techniques. In: The ISPRS International Archives of the Photogrammetry, Remote Sensing and Spatial Information Sciences, Athens, Greece, Vol. XXXVI? 5/C53, pp. 52?57.
AvKar, E. Ö., Duran Z., Akyol O., Toz, G., 2008. Modeling of the Temple of Apollo Smintheus Using Photogrammetry and Virtual Realty. In: The ISPRS International Archives of the Photogrammetry, Remote Sensing and Spatial Information Sciences, Beijing, China, Vol. XXXVII, Part B5, Commission V, pp. 357?360.
Bay, H., Tuytelaars, T., Van Gool, L., 2006. “SURF: Speeded Up Robust Features”. ECCV2006. Lecture Notes in Computer Science, A. Leonardis, H. Bischof, and A. Pinz, Eds., vol. 3951. Springer, 2006, pp. 404?417.
Boccardo, P., Dequal, S., Lingua, A., Rinaudo, F., 2002. True digital orthophoto for architectural and archaeological applications. GISdevelopment.net.
http://www.gisdevelopment.net/Application/archaeology/genera l/archg0002.htm (accessed 28.Sep. 2007).
Elwazani S.A., Lerma J.L., 2007. Recording for Urban Planning: A Case from Manama, Bahrain. In: The ISPRS International Archives of the Photogrammetry, Remote Sensing and Spatial Information Sciences, Athens, Greece, Vol. XXXVI? 5/C53, pp. 293?296.
Fangi, G., 2007. The Multi?Image Spherical Panoramas as a Tool for Architectural Survey. In: The ISPRS International Archives of the Photogrammetry, Remote Sensing and Spatial Information Sciences, Athens, Greece, Vol. XXXVI?5/C53, pp. 311?316.
Gruen A. 1985. Adaptive Least Squares Correlation: A Powerful Image Matching Technique. South African Journal of Photogrammetry, Remote Sensing and Cartography. Vol.14, pp 175?187.
Gruen, A., Baltsavias, E., 1986. Adaptive least squares correlations with geometrical constraints. Proc. of SPIE, Vol. 595, pp. 72?82.
Gruen, A.W. and Baltsavias, E.P., 1988. Geometrically constrained multiphoto matching. Photogramm. Eng. Remote Sensing 54 5, pp. 633–641.
Lerma, J.L., 2002. Fotogrametría Moderna: Analítica y Digital. Universidad Politécnica de Valencia, p. 449.
Martos, A., Navarro, S., Lerma, J.L., Rodríguez, S., Rodríguez, J., 2008. ORTHOWARE: Software tool for image based architectural photogrammetry. In: 14th International
Conference on Virtual Systems and Multimedia (VSMM'08), 20? 25 October, Limassol, Cyprus, pp. 32?39.
Moser M., Hanke K., 2007. Digital 3D Reconstruction of Antonio Gaudi’s Lost Design for a Church Near Barcelona, Spain. In: The ISPRS International Archives of the Photogrammetry, Remote Sensing and Spatial Information Sciences, Athens, Greece, Vol. XXXVI?5/C53, pp. 509?514.
Moullou D., Mavromati D., 2007. Topographic and
Photogrammetric Recording of the Acropolis of Athens. In: The ISPRS International Archives of the Photogrammetry, Remote Sensing and Spatial Information Sciences, Athens, Greece, Vol. XXXVI?5/C53, pp. 515?520.
Patias P., Saatsoglou?Paliadeli Ch., Georgoula O., Pateraki M., Stamnas A., Kyriakou N., 2007. Photogrammetric
Documentation and Digital Representation of the Macedonian Palace in Vergina. In: The ISPRS International Archives of the Photogrammetry, Remote Sensing and Spatial Information Sciences, Athens, Greece, Vol. XXXVI?5/C53, pp. 562?566.
Pérez, A., Lerma, J.L., Martos, A., Jordá, F., Ramos, M., Navarro, S., 2007. Generación automática de ortofotografías verdaderas en Arquitectura. In: Séptima Semana Geomática de Barcelona, España.
Remondino, F., Menn, F., 2008. Image?Based Surface
Measurement for Close?Range Heritage Documentation. In: The ISPRS International Archives of the Photogrammetry, Remote Sensing and Spatial Information Sciences, Beijing, China, Vol. XXXVII, Part B5, Commission V, pp. 199?206.