DETECTION OF WATER SURFACES
IN FULL-WAVEFORM LASER SCANNING DATA
A. Schmidt, F. Rottensteiner, U. Sörgel Institute of Photogrammetry and GeoInformation
University of Hanover
{alena.schmidt, rottensteiner, soergel}@ipi.uni-hannover.de
KEY WORDS: Airborne laser scanning, full waveform, classification, water
ABSTRACT:
Airborne laser scanning has become a standard method for recording topographic data. A new generation of laser scanners digitises the complete waveform of the backscattered signal and thus offers the possibility of analysing the signal shape. As a product of the laser scanning, a digital surface model (DSM) or a digital terrain model (DTM) can be derived. In water regions, data acquisition by laser scanning is limited to the water surface because the near-infrared laser pulses hardly penetrate water. Therefore, a height model generated from laser scanner point clouds over water regions does not represent the actual terrain. The generation of a DTM thus requires the detection of water surfaces. In this study, a method for the detection and classification of water surfaces in airborne laser scanning data is proposed. The method works with both geometrical features (e.g. height or height variation) and characteristics of the pulses derived from the full waveform of the returned signal (e.g. intensity or pulse width). In our strategy, based on fuzzy logic, all classification parameters are derived automatically from training areas. According to their statistical distributions, the features are considered with individual weights. The aim of this paper is to analyse crucial features for classification and to investigate the potential of full waveform laser scanning data for this application. We present results from different areas with lakes and rivers, analysing the contribution of the individual groups of features for the detection of water surfaces.
1. INTRODUCTION
The extraction of water surfaces is of great interest for several applications in the field of waterway and coast protection. In order to monitor flooding areas, the courses of rivers have to be observed (Brügelmann, et al., 2004). For the understanding of hydrological systems and their changes the continuous monitoring of water is particularly important (Thoma, et al., 2005). These and other applications require highly accurate elevation data as well as information about the existence and location of water surfaces. Airborne laser scanning (ALS) has become a standard technique for the acquisition of large-scale elevation information (Baltsavias, 1999). Based on the three-dimensional point cloud, a digital surface model (DSM) and, consequently, a digital terrain model (DTM) can be derived, and objects situated on the terrain can be automatically detected. In addition to the so-called signal intensity (usually the maximal echo amplitude), full waveform laser scanner systems deliver further signal features (Wagner, et al., 2004). Due to recording and digitising of measured signal, multiple reflections and signal width of a received pulse can be derived, which may provide insight about the characteristics of the illuminated area (Jutzi, 2007).
This paper is focused on the classification of full waveform laser scanning data for water surface detection. In Section 2 an overview on related work is presented. We show a method to classify laser data into water and non-water surfaces in Section 3. The approach is demonstrated by experiments, which are described in Section 4. The paper concludes with a discussion about the potential of the different features for water detection and directions of future work.
2. RELATED WORK
There are only a few studies investigate the direct classification of water surfaces from airborne laser scanning data. For instance, Brzank (2008) presents a fuzzy logic based classification as a first step towards DTM generation in the Wadden Sea. Due to the fact that the laser pulse in near-infrared hardly penetrates the water, the laser data deviate from the actual terrain in tidal trenches where water surfaces remain even during low tide. According to the features height, intensity, and point density, a membership value to the class water is determined for each laser point. The classification into water and land is performed using a threshold for membership. All parameters of the method are derived automatically from training areas. The method reflects the influence of height for the separation of water and land points, especially in the areas of transition. Classification errors are mainly caused by low height variation and low intensity values due to high incidence angles.
A supervised object-based workflow to classify ALS data into different vegetation and ground classes as well as water is used by Antonarakis et al. (2008). Based on a triangulated network different models, for example an average intensity model, are derived. Low values for height variation and intensity are used as criteria for water detection. Areas where no ALS points are recorded due to specular reflection of the laser pulse at the water surface are classified based on satellite images. In this case, water is modelled to be characterized by low colour values. Missing ALS points due to specular reflection also affect the determination of the triangulated network in a negative way.
A segment-based method for water surface detection using ALS data was proposed by Höfle et al. (2009). In a preprocessing step, intensity values are corrected for the incidence angles, and the positions of missing laser reflections due to specular reflection or decreasing target reflectance are modelled by using the pulse repetition frequency. The variations of height and intensity provide criteria for a region growing segmentation and the ensuing classification. Water-land-boundaries are defined by the segment borders. Because of similar intensity values, water and asphalt surfaces cannot be separated by this approach. Classification errors also occur with multiple reflections, because in general they show lower intensity values for the last pulse compared to the first echo, so that low signal intensity is not always caused by water surfaces.
Briese et al. (2001) use a DSM and a digital model of the water surface (DWM) for the determination of water-land-boundaries. In their method, the DWM is derived by averaging representative river heights from the laser data in regard to the known coordinates of the river axis. The water-land-boundary corresponds to the line of zero height after subtracting the DWM of the DSM.
3. METHODS
In order to extract water surfaces in ALS, data a fuzzy logic concept is developed which is based on an approach for water detection in the Wadden Sea (Brzank, 2008). The methodology, the classification features, and the way these features are derived are described in the following sections.
3.1 Feature extraction
Full waveform laser data are used for the separation of water and land, where the echo signal is digitized online during data acquisition. The waveform analysis is accomplished in post processing (RIEGL, 2010), by fitting echoes with an appropriate modeling function. Unfortunately, the method used by the company for that purpose is not clearly documented.
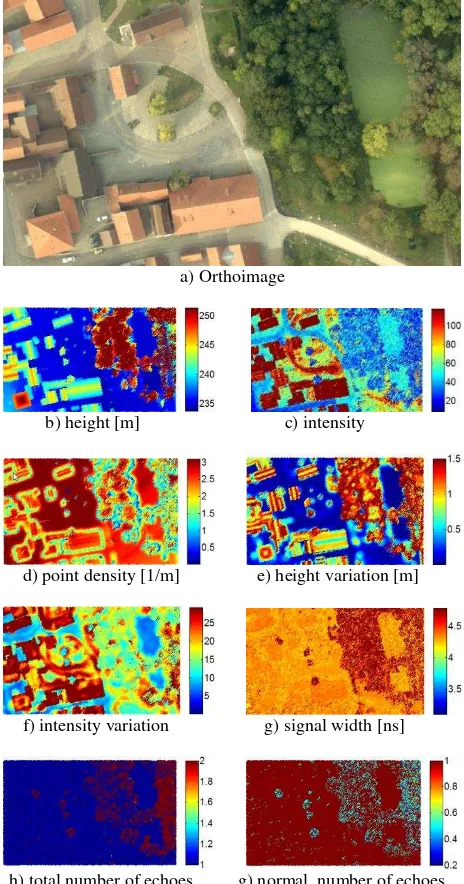
Eight different features are derived from the data, which are exemplarily presented for a section of the second test site in Figure 1. The features are grouped as follows:
(1) Features proposed by Brzank (2008): height
intensity point density
(2) Area-based features:
height variation intensity variation
(calculated as the standard deviations of height and intensity, respectively, inside a circular area with radius R = 5 m around each point)
(3) Full waveform features: signal width
total number of echoes
(i.e., the number of backscattered signals per emitted pulse)
normalised number of echoes
(the ratio of echo number to total number per emitted pulse)
a) Orthoimage
b) height [m] c) intensity
d) point density [1/m] e) height variation [m]
f) intensity variation g) signal width [ns]
h) total number of echoes g) normal. number of echoes
Figure 1: Orthoimage and feature distribution illustrated for a segment of the test site Bonnland
The first three features have been found to be well-suited for separating water from dry mud areas in the Wadden Sea (Brzank, 2008). That algorithm relies on the assumption that water surfaces possess a lower height compared to land surfaces and a lower intensity due to a lower reflectance. Because of specular reflection (dependent on the incidence angle) the number of laser pulses without any received return is significantly higher in water surfaces, which leads to a decreasing point density. The assumptions on the height are only suitable for coastal areas: in non-coastal areas, standing waterbodies may easily correspond to different height levels if they are not connected.
The model by Brzank (2008) thus has to be expanded by additional features. Instead of a decreasing height, a low local height variation is assumed for water surfaces. Depending on the characteristics of water, the intensity variation is expected to decrease in smooth water surfaces and to increase in coastal International Archives of the Photogrammetry, Remote Sensing and Spatial Information Sciences, Volume XXXVIII-4/W19, 2011
areas. The determination of these area-based features requires a fast access to the nearest neighbours of each ALS points. This is obtained by indexing the ALS point cloud by a k-d-tree (Bentley, 1990) with a dimension of two.
Due to full waveform data acquisition, additional classification features can be derived from the laser scanning point cloud. Surface characteristics such as slope, reflectance, and roughness influence the received waveform (Jutzi, 2007). The investigation of pulse spreading leads to the assumption of low signal width on water surface because the reflected pulse hardly broadens on horizontal surfaces. Multiple reflections have been commonly attributed to vegetation and can be investigated by the total number and normalised number of echoes.
3.2 Fuzzy classification
The classification method is based on fuzzy logic. In fuzzy logic, the membership of an element to a set is no longer a binary variable, but the concept allows partial membership by defining a membership function that models the degree of membership of that element to a set by a number between 0 and 1 (Traeger, 1994). In our classification method, such a membership function to the set water is defined for each of the features described in Section 3.1. By a combination of the membership values according to the individual features, a total membership of an ALS point to the set water can be determined, which forms the basis for the final classification. First, membership functions have to be defined for the eight features. For this purpose, mean feature values for each class are derived from training areas. Due to the variations of the features based on land cover, the class land is divided into building, vegetation, artificial ground and natural ground. The membership value to the class water according to the feature i is denoted by µi. The maximum membership value water is
provided by the mean of the feature in the water training area (µ = 1), whereas the minimum membership value water (µ = 0) is given by the mean of the land class with most similar features values. Figure 2 shows the membership functions of the features height variation and intensity as an example in the test area. If the mean feature value for water surfaces is larger or smaller than for all other classes, the membership function is a ramp function (Figure 2a), otherwise it is a triangular membership function (Figure 2b).
Figure 2: Membership functions of feature height variation (a) and intensity (b)
The separate membership values µi are combined in a weighted
sum approach. Concerning an individual weight factor di(xi) the
entire membership of class water µw is defined as:
(1)
The weight factor di(xi) reveals the suitability of feature i taking
the value xi for water detection, based on a model that assumes a
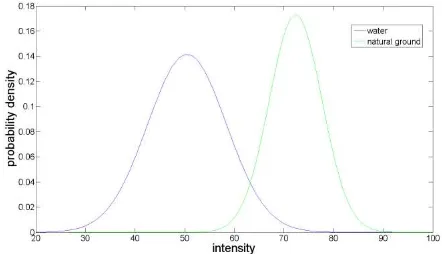
Gaussian distribution of the respective feature for water and the different land classes (Figure 3). In case the distributions for the land classes and water do not overlap much, the feature i is well-suited for classification, which should lead to a high weight factor di(xi). The definition of the weight functions thus
is based on a statistical test of the mean values of the distributions of the feature for the water and the nearest land class, respectively, using the null hypothesis H0: ≠ . The test variable t which follows a student distribution is
(1)
In Eq. 2, and are the mean values of the feature i for the class water and the land class being closest to water. sw and sl
are the respective standard deviations, and nw and nl are the
numbers of water and land points. Because the point numbers are high, the student-distribution can be approximated by a normal distribution. Depending on the significance level α (2)
where T denotes the random variable of t, the weight factordi(x)
is calculated by linear interpolation. In case of full significance level (α = 0) the weight factor amounts to 1. For α ≥ 0.5 the weight is 0.
Figure 3: Probability density functions of feature intensity
To classify the laser data into water and land, a threshold for the entire membership of class water µw is finally determined. The
threshold is determined as the point of intersection of the Gaussian probability densities of the entire membership of water and land in the training areas.
4. EXAMPLES
For the evaluation, our classification method was applied to two test data sets (cf. Section 4.1), and the classification results were compared to a reference that was generated by manually delineating water areas in orthoimages. The classification accuracy is assessed by the completeness and the correctness of the results. Completeness is the ratio of the correctly extracted International Archives of the Photogrammetry, Remote Sensing and Spatial Information Sciences, Volume XXXVIII-4/W19, 2011
water points to the number of water points in the reference data, whereas correctness is defined as the ratio of correctly classified points to the total number of points classified as water (Heipke, et al., 1997): points matching the ground truth data), FN the number of false negatives (missing water points) and FP the number of false positives (land points classified as water).
4.1 Data
In order to test our method, two test sites were selected which differ in the size and characteristics of the including water surfaces. The first test site covers the eastern part of the Kiel Channel in Germany and its estuary in the Kiel Fjord. The data were acquired using a RIEGL LMS-Q560 ALS system. The total area of this test site is about 1,3 km x 3,5 km, of which about 50% are covered by water. Information about 3D coordinates and intensity are available for the backscattered signal of each laser pulse as well as its signal width, echo number and the total number of echoes. The second test site is located in the village of Bonnland (Germany), covering an area of about 0,8 km x 1,8 km. It contains three small lakes. Again, full waveform data were carried out with a RIEGL LMS-Q560 sensor, and the same features as for Kiel were derived from these data. In both cases, the decomposition of the full waveform and the derivation of the full waveform features were carried out by the company acquiring the data.
4.2 Results of Kiel
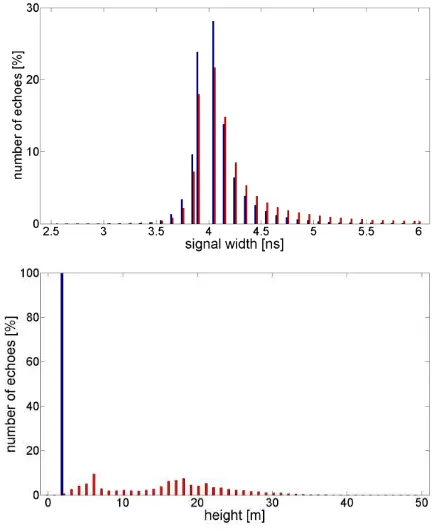
In Table 1 feature values for water and land surfaces are compared by showing the minimum, maximum, mean, and standard deviation of these variables. The height of waters in the data set possesses a clear lower mean and standard deviation than for land surfaces. This becomes also evident for the height variation which tends to be zero for water areas. The behaviour of signal intensity strongly varies for the data of the Fjord. This leads to a high average intensity variation. Due to pulse spreading on vegetation, the maximum signal width of land data is distinctly higher than on water areas. However, the mean values are close together can hardly be used for the distinction between both classes (Figure 4a). This is also apparent for the normalised and the total number of echoes, because there is only a low rate (10%) of multiple reflections for land surfaces. The classification performance was tested by using each of the three feature groups described in Section 3.1 separately. In Figure 5 - 7 the orthoimage and the results of the classified land and water points are presented. For classification with the features proposed by Brzank (height, intensity, point density) the completeness was determined to be 99.9 % and the correctness 95.5 %. Considering the clear distinction of the height distributions for land and water (Figure 4b), height receives a particularly high weight in the algorithm. A few classification errors occur in the region of the lock in the middle of the test site. For the area-based features (height variation, intensity variation), the correctness is about 75 %, whereas completeness is 99 %. The relatively low correctness is caused
by surfaces devoid of any elevated objects, for example sport fields to the northwest. A classification based only on the full waveform features cannot be realised. Our model for the full waveform features is hurt by land cover classes such as bare soil and buildings, which do not necessarily cause a higher signal width or a larger number of echoes. As a consequence, the probability densities of these features for water and land show a high overlap, so that our algorithm quantifies the features being not suited for water detection: the respective feature weights are all set to zero. Table 1: Classification features and statistical quantities (minimum, maximum, mean, standard deviation) for water and land surfaces
Figure 4: Distribution of features signal width (a) and height (b) for water (blue) and land (red)
Figure 5: Orthoimage of the test site Kiel
Figure 6: Water (blue) an land (yellow) points after classification by height, intensity, point density
Figure 7: Water (blue) an land (yellow) points after classification by height variation, intensity variation
4.3 Results of Bonnland
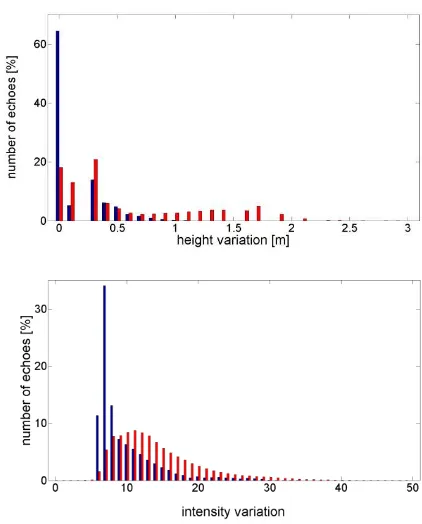
In comparison to the Kiel data, the second test site contains more than a single contiguous water body. Thus, the behaviour of height is ambiguous, because obviously, each of the lakes in the scene has a different height level. As a consequence, the model that the lowest heights must correspond to the water is hurt. Furthermore, if only one lake is used for training, none of the other lakes can be detected; if training points are identified on each lake, height will not be relevant for classification. This is also shown by a rather low accuracy for the classification with the features proposed by Brzank (height, intensity, point density). The results of classification by area-based features is presented in Figure 8 where the detected water points are highlighted in blue. For water surfaces the average height variation tends to be zero (9a). Due to the smooth water surfaces, the intensity variation decreases in comparison to the first test site. In Figure 9b, the distributions of the intensity variance for land and water points are compared. The water areas are characterised by a lower average intensity variation. For classification with these features the correctness was determined to be 93.6 % and the completeness 61.4 %. The low rate of completeness is caused by errors at the lake boundaries where surrounding vegetation causes high variations of both height and intensity, an effect that is aggravated by the fact that the computation of these features has to take into account not only a point to be classified itself, but also its neighbours. The completeness measured on the object-level is 100%, because all water surfaces could be extracted. Full waveform features are again found not to be suited for water detection. The distinction between water and vegetation points becomes feasible, but land-water separation cannot be realised in general.
Figure 8: Orthoimage and classified water surfaces (blue) considering height variation and intensity variation
Figure 9: Distribution of features height variation (a) and intensity variation (b) for water (blue) and land (red) International Archives of the Photogrammetry, Remote Sensing and Spatial Information Sciences, Volume XXXVIII-4/W19, 2011
5. CONCLUSION AND OUTLOOK
In this paper a method for water detection in full waveform laser scanning data and the influence of features for classification accuracy have been presented. Each collected laser echo is classified into water and land, taking into account geometrical and physical features. It was shown that by using height information the classification works well for a contiguous water surfaces. In case of several water bodies height variation and intensity variation deliver a good result. However, full waveform features were found not to improve water detection in the proposed approach.
Further investigations are planned concerning the general methodology for water detection. By using a fuzzy logic concept in the way described in this paper, information about feature correlation cannot be utilized. Thus, the transition to a probabilistic method that is also able to take into account local dependencies between the data e.g. conditional random fields (Kumar, et al., 2006), is promising and should be investigated in future.
6. REFERENCES
Antonarakis, A., Richards, K., & Brasington, J., 2008.
Object-based land cover classification using airborne LiDAR. Remote
Sensing of Environment, 112 (6), pp. 2988-2998
Baltsavias, E., 1999. Airborne laser scanning: basic relations
and formulas. ISPRS Journal of Photogrammetry and Remote
Sensing, 54 (2), pp. 199-214
Bentley, J., 1990. K-d trees for semidynamic point sets.
Proceedings of the sixth Annual Symposium on Computational
Geometry, pp.187-197
Briese, C., Kraus, K., Mandlburger, G., & Pfeifer, N., 2001. Einsatzmöglichkeiten der flugzeuggetragenen Laser-Scanner. In
I. f. Geodäsie (Ed.)., 19, pp. 17-26
Brügelmann, R., & Bollweg, A., 2004. Laser altimetry for river
management. International Archives of Photogrammetry,
Remote Sensing and Spatial Information Sciences, 35, pp.
234-239
Brzank, A., 2008. Bestimmung Digitaler Geländemodelle in
Wattgebieten aus Laserscannerdaten. Institut für
Photogrammetrie und GeoInformation, Universität Hannover. Deutsche Geodätische Kommision Reihe C
Heipke, C., Mayer, H., Wiedemann, C., & Jamet, O., 1997.
Evaluation of Automatic Road Extraction. International
Archives of Photogrammetry and Remote Sensing, International
Society for Photogrammetry and Remote Sensing, 32 (3-2W3),
pp. 47-56
Höfle, B., Vetter, M., Pfeifer, N., Mandlburger, G., & Stötter, J., 2009. Water surface mapping from airborne laser scanning
using signal intensity and elevation data. Earth Surface
Processes and Landforms, 34 (12), pp. 1635-1649
Jutzi, B., 2007. Analyse der zeitlichen Signalform von
rückgestreuten Laserpulsen. PhD Thesis, Institut für
Photogrammetrie und Kartographie, TU München
Kumar, S., & Hebert, M., 2006. Discriminative random fields.
International Journal of Computer Vision, 68 (2), pp. 179-201
RIEGL Laser Measurement Systems GmbH, 2010. Datasheet LMS-Q560. www.riegl.com/uploads/tx_pxpriegldownloads/
10_DataSheet_Q560_20-09-2010_01.pdf (accessed 12 April 2010)
Thoma, D., Gupta, S., Bauer, M., & Kirchoff, C., 2005. Airborne laser scanning for riverbank erosion assessment.
Remote Sensing of Environment, 95 (4), pp. 493-501
Traeger, D., 1994. Einführung in die Fuzzy-Logik. Teubner
Verlag, Stuttgart
Wagner, W., Ullrich, A., Melzer, T., Briese, C., & Kraus, K., 2004. From single-pulse to full-waveform airborne laser scanners: potential and practical challenges. In O. Altan (Ed.).,
XXXV, pp. 201-206