AUTOMATIC EXTRACTION OF WATER IN HIGH-RESOLUTION SAR IMAGES
BASED ON MULTI-SCALE LEVEL SET METHOD AND OTSU ALGORITHM
H. G. Sui a, C. Xu a, * a
State Key Laboratory for Information Engineering in Surveying, Mapping and Remote Sensing, Wuhan University, Wuhan, 430079, PR China, [email protected]
Commission VII, WG VII/7
KEY WORDS: Synthetic aperture radar (SAR), Multi-scale level set, Water extraction, OTSU algorithm, Segmentation
ABSTRACT:
Water extraction has an important significance in flood disaster management and environmental monitoring. Compared to optical sensor, Synthetic aperture radar (SAR), which has the properties of high resolution and all-weather acquisition, has been used for water extraction in this paper. Due to the presence of coherent speckles, which can be modeled as strong, multiplicative noise, water extraction in SAR image is very difficult. In order to extract water from SAR images automatically, accurately and quickly, a novel water extraction algorithm combine multi-scale level set method with OTSU algorithm is proposed in this paper. Firstly, we introduced multi-scale framework into level set method. Multi-scale framework is a method considering both global information and local information of the image. The overall structural information of the image can be maintained at coarse scales and detailed information can be kept at fine scales. Therefore, coarser scale extraction results can be used as a prior guide for the finer scale, so that not only are the statistical properties of the signal-resolution image considered, but also statistical variations of multiple resolutions are exploited. Moreover, computational complexity is reduced since much of the work can be accomplished at coarse resolutions, where there are significantly fewer pixels to process. Secondly, based on the multi-scale level set framework, the segmentation result of OTSU algorithm is used to represent the initial segmentation curve. Finally, in order to eliminate the influence of buildings shadow and road, post-processing is considered in this paper. The experiments with real SAR images demonstrate the effectiveness of the new method.
* Corresponding author. E-mail address: [email protected] 1. INTRODUCTION
Synthetic Aperture Radar (SAR) has the capability of large-area coverage, cloud penetration and all-weather acquisition, and it can usually obtain massive information within a short time. Thus, they are more suitable than optical sensors to reliably and timely map inundated areas in flood situations, which usually occur under overcast sky conditions. The high resolution and the increased observation frequency of the new class of SAR sensors offer enormous potential in the domain of flood mapping. However, the improved spatial resolution of the SAR data results in a large variety of very small-scaled image objects, which makes image processing and analysis even more challenging.
Segmentation is the main tool to extract water bodies from SAR images. However, there exist some difficulties: On the one hand, due to the presence of coherent speckles, which can be modeled as strong, multiplicative noise, segmentation of SAR images is generally acknowledged as a difficult problem; see Lee (1989) and Oliver and Quegan (1998). On the other hand, confused objects may influence the result of segmentation, such as buildings shadow and road.
The level set method was first introduced by Osher and Sethian (1988), and since then, much effort has been directed towards image segmentation (for example: Mumford and Shah 1989, Zhao et al. 1996, Horritt 1999, Germain and Refregier 2001, Li
et al. 2005, Law et al. 2008). Compared with some other SAR image segmentation methods (for example: Cook et al. 1994,
Fjortoft et al. 1998, Xu et al. 2003), the level set method has the advantages of being robust in locating the boundary of an object, and of being able to handle topological changes in the curves during their evolution.
The most general model in the level set method is the Chan-Vese (C-V) model (Chan and Chan-Vese 2001), which is based on curve evolution techniques employing the Mumford–Shah functional (Mumford and Shah 1989) for segmentation, and level sets. This model can detect objects whose boundaries are not necessarily defined by a gradient and can be adapted more easily to topological changes. Although traditional level set methods based on the C-V model have obtained encouraging results, prior information (speckle noise) of SAR images is commonly ignored. It is widely recognized that the gamma distribution is the most general model employed to represent a SAR image, thus, many authors employ the gamma statistical model instead of the C-V model to define the energy functional. For example, Martin et al. (2004) analyzed the level set implementation of region snakes based on the maximum likelihood method for different noise models, and obtained improved segmentation results. Ayed et al. (2005) investigated SAR image segmentation into a given but arbitrary number of gamma homogeneous regions via active contours and level sets. Silveira and Heleno (2009) adopted a mixture of lognormal densities for SAR image segmentation between water and land, and results demonstrated the good performance of their proposed method.
Based on above analysis, a novel multi-scale Level Set method is proposed for automatic extraction of water bodies. Compared with single-resolution approaches, employing multi-scale model for SAR image segmentation offers several advantages. Firstly, multi-scale segmentation is a method considering both global information and local information of the image, thus, segmentation accuracy is increased. The overall structural information of the image can be maintained at coarse scales and detailed information can be kept at fine scales. Therefore, coarser scale segmentation results can be used as a prior guide for the finer scale segmentation, so that not only are the statistical properties of the signal-resolution image considered, but also statistical variations of multiple resolutions are exploited. Secondly, computational complexity is reduced since much of the work can be accomplished at coarse resolutions, where there are significantly fewer pixels to process. Moreover, OTSU algorithm (1979) is introduced to initialize the level let functional; this simple technique brings significant improvements in speed and accuracy. Finally, post-processing is applied to segmentation result for removing some confused objects.
2. PROPOSED METHOD
In this section, the basic principle of the proposed method is outlined in Figure. 1. We acquire multi-scale images at several scales by decomposing the SAR image using the block averaging algorithm.
The principal steps of our algorithm are as follows:
1) Decompose the image into L scales by the block averaging algorithm. Let K=L.
2) Use the OTSU algorithm to initialize the level set function of scale L. Go to Step 3).
3) Obtain the scale-K segmentation result using the level set method with the Gamma model.
4) K=K-1.
5) If K>=0, return to Step 2).
Figure.1 Basic framework of proposed method 2.1 Level set method based on gamma model
Chan and Vese proposed a model that implements the Mumford–Shah functional via the level set function for the purpose of bimodal segmentation. The segmentation is performed by an active contour model without boundaries. Let
be a bounded open subset of R2 , with
being its minimizes the energy functional below:
For SAR images, the probability density function (PDF) of the pixel intensity is often given by a Gamma distribution. In this
For scale images decomposed by bilinear interpolation, the PDF of the pixel intensity is also given by a Gamma distribution. This follows from Theorem 1.
Theorem 1: For two given images
u
0(
x
)
andu
(
~
x
)
,u
(
~
x
)
is the decomposed image generated by bilinear interpolation. If)
(
0x
u
is modeled by a Gamma distribution, so isu
(
~
x
)
. Proof of Theorem 1 is given in Section 2.2.Therefore, the level set functional for SAR images can be improved according to Equation (6) as follows:
The evolution of
is governed by the following motion partial differential equation: International Archives of the Photogrammetry, Remote Sensing and Spatial Information Sciences, Volume XXXIX-B7, 2012Next, our aim is to estimate the set of Gamma
distributed, the log likelihood
is
setting them to zero, we obtain
2.2 Proof of Gamma distribution on scale image
For a uniform and regular grid, bilinear interpolation averages the values of four neighboring pixels. For a given image
The Moment Generating Function (MGF) of a random variable Y is defined as
Y(t)E(etY)
etYdF(Y) ,t
R
, identically distributed (i.i.d.), we obtain the MGF of Y~.Let
2.3 OTSU algorithm used to initialize the level set function
Otsu algorithm (1979) is a nonparametric and unsupervised method of automatic threshold selection for image segmentation, and it is a classical method for optical image segmentation. However, due to the strong speckle noise of SAR image, Otsu method could be invalidated. Thus, we applied it on the coarsest scale image, which has a poor speckle noise, to obtain the initialize segmentation result.
Assume that
t
is the threshold value calculated by Otsu algorithm (1979), and uis the image of coarsest scale, and then we simply initialize the level set function
as follows: u t
(6)It is easy to see that zero level set
0 is actually the set of image pixels that satisfiesu
t
. This threshold segmentation method can be interpreted as follows: image data (regarded as a 2-D function, with image gray level at each pixel representing the function value) subtracts a well-defined threshold; thus, the value of the level set function at each pixel denotes the difference between gray level and the zero level set. During evolution, image pixels with values far from the threshold are hard to move across the boundary, and vice versa, while in the classical approach, the level set function is initialized by a SDF, meaning that pixels far from the zero level set (decided by spatial distance) are hard to move across the boundary. This results in that objects far from the zero level set being hard to detect. With a proper threshold, we can get a better segmentation result after 10 or 20 iterations, saving time and also improving the accuracy.2.4 Post-processing
When we obtained the segmentation result of proposed method, one can find that there are still some confused objects. Thus, post-processing is needed. In order to remove small segments, “connected component labelling” algorithm is used to label the binary image, thus, we can obtain several objects. Area size of object is defined to decide whether this object can be removed. In this paper, if area size of object less than 400 pixels, then those objects are removed.
3. EXPERIMENT AND ANALYSIS
In this section we demonstrate our method on real SAR image. We compare our method with the below methods:
ALG1: Segmentation method using single-scale level set method with gamma model and we use several rectangular regions in the water region to initialize the contour.
ALG2: Segmentation method using single-scale level set method with gamma model and we use OTSU algorithm to initialize the contour.
ALG3: Water segmentation method proposed by Sliverira and Heleno (2009), the only difference is that we use OTSU algorithm to initialize the contour.
All of our images are tested without a filter, the scale level is 2 and the time step is 0.05. We estimate the computational time in seconds when our calculations are performed on a personal computer with an Intel Core(TM) i3 CPU, Quad-Core Processor International Archives of the Photogrammetry, Remote Sensing and Spatial Information Sciences, Volume XXXIX-B7, 2012
running at 3.07 GHz with 2.99GB of RAM and a Windows-based operating system.
In our proposed method, there are three main parameters we need to consider; these take values that depend on image type and scale. Parameter
is the coefficient of regularization term, which controls the boundary smoothness of the segmented image. After some experiments, we found that for large size images (over1000
1000
pixels), segmentation based on the level set method with SDF converged poorly, sometimes with no solution being reached even after several thousand iterations. Thus, the variable parameter method is introduced for large images. The specific strategy is to increase
by small amount every certain iteration.According to Theorem 1, it can be seen that the scale image is also modeled by a gamma distribution with four times larger image looks. So we suppose that the parameters in the coarser image are four times smaller than those in the finer image. The parameter v is set to zero always, that is, we don’t restrict the area of each region. Specific parameter values are given in Table 1. All values were chosen empirically.3.1 Experiment on SAR imagery
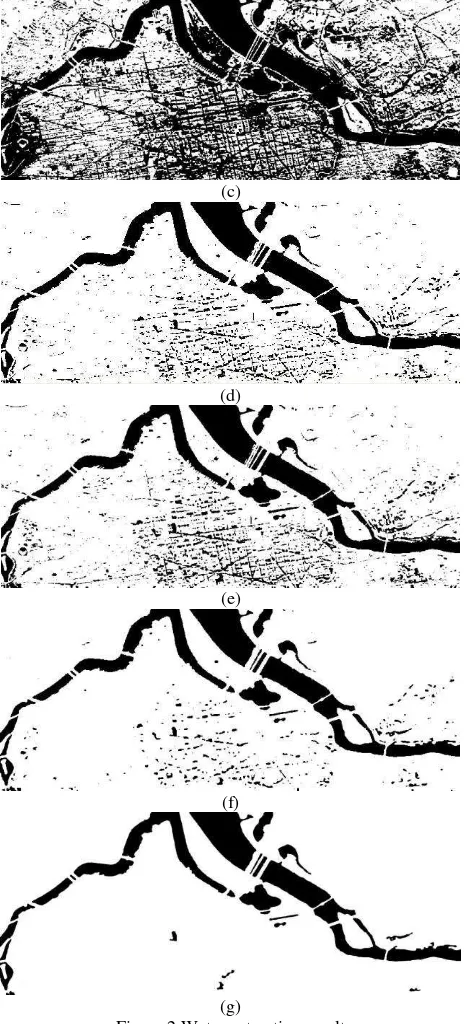
Figure 2 shows a real SAR image and its extraction results. Figure 2 (a) shows a famous image acquired from the website http://www.sandia.gov/radar/images/dc_big.jpg is a part of a Ku-band SAR image. The size of the image is
2000
810
pixels, with 1-m spatial resolution in the area of Washington, D.C., USA. There are three types of land cover: water, road, building and bare land. In general, the actual positions of boundaries within a SAR scene are unknown. So, the segmentation quality measures are modified to allow comparison of the automatic segmentation approaches with manual segmentation, as illustrated in Figure 2(b). Figure 2(c)-(e) shows the extraction result generated by ALG1, ALG2, ALG3, respectively. In Figure 2(f), we show the extraction result obtained by proposed method, and figure 1(g) shows the result after post-processing. It can be clearly seen that our method performance a better result. Detailed comparisons of accuracy and efficiency are given in Table I.(a)
(b)
(c)
(d)
(e)
(f)
(g)
Figure.2 Water extraction result 3.2 Quantitative evaluation
In order to calculate the accuracy, assuming that the size of an original SAR image is
M
N
, we denote the label image obtained by segmentation as X, whose size is alsoM
N
. Correspondingly,R
represents the label image from manual segmentation (it also indicates an ideal segmentation) for the same original SAR image. The error image is therefore defined as EXR. In order to compare the performance of the above methods, a measurement that evaluates the accuracy of segmentation, called the percent of error pixels (pep
), is defined by Gao et al. (2008) as:
100
%
N
M
l
pep
(7) International Archives of the Photogrammetry, Remote Sensing and Spatial Information Sciences, Volume XXXIX-B7, 2012Where
l
denotes the number of non-zero pixels inE
. Ideally, thepep
value of a perfect segmentation should equal zero, so the smallerpep
is, the better the segmentation. Thus, pepindicates the quality of the image segmentation. In this paper, we use the percentage of correct pixels (
pcp
) to represent the accuracy of segmentation:pep
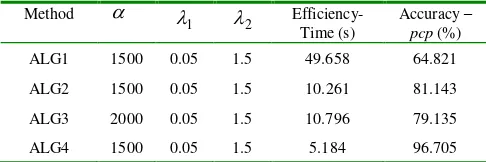
pcp1 (8) Table I compares the efficiency and accuracy of the above methods for the SAR image.
TABLE IACCURACY AND EFFICIENCY COMPARISON Method
1
2 Efficiency-Time (s)Accuracy –
pcp (%)
ALG1 1500 0.05 1.5 49.658 64.821
ALG2 1500 0.05 1.5 10.261 81.143
ALG3 2000 0.05 1.5 10.796 79.135
ALG4 1500 0.05 1.5 5.184 96.705
Notes: ALG4 is the proposed method.
From the above qualitative analysis (Experiment 1 and 2) and quantitative analysis (Table I), the following conclusions can be obtained:
1) By using OTSU algorithm to initialize the level set contour, segmentation accuracy is improved and iterations can be reduced significantly (please see the figure1 (c)(d) and ALG1,ALG2 in Table I).
2) Comparing with single-scale segmentation, the multi-scale technique can produce better accuracy and efficiency (please see the figure1 (d)(f), and ALG2, ALG4 in Table I). In any case, our method (ALG4) often leads to a superior result.
4. CONCLUSION
In this paper, a novel SAR water extraction method integration multi-scale level sets and OTSU algorithm is proposed. Although experiments have testified that our method performs better than previous level set methods, much work remains to be done. The multi-scale analysis framework is a new component in the level set method for segmentation and there is still much work to do in the multi-scale analysis. Further, the Gamma distribution is used to represent the energy functional, because of the characteristics of the SAR image; in future work we will consider a more suitable energy functional for SAR images produced by different sensors. Finally, a threshold segmentation method was used here to initialize the level set function, and was shown to be useful for a binary segmentation; however, for multiphase segmentation, this technique may require further development.
5. ACKNOWLEDGEMENTS
This work was supported by National Key Fundamental Research Plan of China (973) (No.2012CB719906) and National Natural Fund of China (NSFC) (No.41101414, No.40901211, and No.61001187).
6. REFERENCES
Ayed, I. B., Vazquez, C., Mitiche, A., and Bellhadj, Z., 2005, Multi-region level set partitioning of synthetic aperture radar images, IEEE Transactions on Pattern Analysis and Machine Intelligence, 27(5), pp. 793–800.
Chan, T. F. and Vese, L. A., 2001, Active contours without edges,
IEEE Transactions on Image Processing, 10(2), pp. 266–277.
Cook, R., Connell, I. M. and Oliver, C. J., 1994, MUM Segmentation for SAR Images, Proceedings of SPIE, 2316, pp. 92-103.
Fjortoft, R., Lopes, A. and Marthon, P., 1998, An Optimal Multiedge Detector for SAR Image Segmentation, IEEE Transactions on Geoscience and Remote Sensing, 36(3), pp. 793–802.
Gao, G., Zhao, L. J., Zhang, J., Zhou, D. F. and Huang, J. J., 2008, A segmentation algorithm for SAR images based on the anisotropic heat diffusion equation, Pattern Recognition, 41, pp. 3035–3043.
German, O. and Refregier, P., 2001, Edge location in SAR images: Performance of the likelihood ratio filter and accuracy improvement with an active contour approach, IEEE Transactions on Image Processing, 10(1), pp. 72–78.
Horritt, M. S., 1999, A statistical active contour model for SAR image segmentation, Image and Vision Computing, 17, pp. 213–224.
Law, Y. N., Lee, H. K. and Yip, A. M., 2008, A multiresolution stochastic level set method for mumford-shah image segmentation, IEEE Transactions on Image Processing, 17(12), pp.2289-2300.
Lee, J. S., 1989, Segmentation of SAR Image, IEEE Transaction on Geoscience and Remote Sensing, 27(6), pp. 981–990.
Li, C., Xu, C., Gui, C. and Fox, M. D., 2005, Level Set Evolution Without Re-initialization: A New Variational Formulation,
Proceedings of the 2005 IEEE Computer Society Conference on Computer Vision and Pattern Recognition, 1, pp.1-7.
Martin, P., Refregier, P., Gpidail, F. and Guerault, F., 2004, Influence of the noise on level set active contour segmentation,
IEEE Transactions on Pattern Analysis and Machine Intelligence, 26(6), pp. 799-803.
Oliver, C. J., Quegan, S., 1998, Understanding Synthetic Aperture Radar Images. New York: Artech House.
Osher, S. and Sethian, J., 1988, Fronts Propagating with Curvature Dependent Speed:Algorithms Based on the Hamilton-Jacobi Formulation, Journal of Computational Physics, 79(1), pp. 12–49.
Otsu, N., 1979, A threshold selection method from gray-level histogram, IEEE Trans. on Systems, Man and Cybernetics, 9(1), pp. 62-66.
Silverira, M. and Heleno, S., 2009, Separation Between Water and Land in SAR Images Using Region-Based Level Sets. IEEE Geoscience and Remote Sensing Letters, 6(3), pp. 471–475.
Xu, X., Li, D. and Sun, H., 2003, Multiscale SAR Image Segmentation Using A Double Markov Random Field Model,
Proceedings of Seventh International Symposium on Signal Processing and Its Applications, 1, pp. 349-352.
Zhao, H.-K., Chan, T., Merriman, B. and Osher, S., 1996, A variational level set approach to multiphase motion, Journal of Computer Physics, 127, pp.179–195.