CREATION OF 3D MODELS FROM LARGE UNSTRUCTURED IMAGE AND VIDEO
DATASETS
J. Hollick1
, S. Moncrieff2,5
, D. Belton2,5
, A. J. Woods3
, A. Hutchison4
, P. Helmholz2
1 iVEC@Curtin University - [email protected] 2
Department of Spatial Sciences, Curtin University - (d.belton, s.moncrieff, petra.helmholz)@curtin.edu.au 3Centre for Marine Science and Technology, Curtin University
4
School of Design and Art,Curtin University, GPO Box U 1987, Perth W.A. 6845, Australia - [email protected] 5CRC for Spatial Information
Working Group III/4
KEY WORDS: Algorithms, Automation, Cultural Heritage, Modelling, Photogrammetry, Underwater, Video
ABSTRACT:
Exploration of various places using low-cost camera solutions over decades without having a photogrammetric application in mind has resulted in large collections of images and videos that may have significant cultural value. The purpose of collecting this data is often to provide a log of events and therefore the data is often unstructured and of varying quality. Depending on the equipment used there may be approximate location data available for the images but the accuracy of this data may also be of varying quality. In this paper we present an approach that can deal with these conditions and process datasets of this type to produce 3D models. Results from processing the dataset collected during the discovery and subsequent exploration of the HMAS Sydney and HSK Kormoran wreck sites shows the potential of our approach. The results are promising and show that there is potential to retrieve significantly more information from many of these datasets than previously thought possible.
1. INTRODUCTION
There is a long history of documenting sites such as buildings or temples using commodity cameras, but these datasets have often been collected without any thought of photogrammetric analysis. Many datasets may have significant cultural or historic value such as the 1966 World Cup Final video footage, analysed by Reid and Zisserman (1996). Generally the collection of this data is performed to provide a log of events or object placement and therefore these datasets are often unstructured and of varying quality. In the last few decades approaches have become available that allow the use of this data for photogrammetric analysis. This research can also be applied to the capture of image sets using sensor platforms such as Unmanned Aerial Vehicles (UAV) and Remotely Operated underwater Vehicles (ROV). In these applications commodity camera solutions are often preferred due to their low weight and ease of replacement in the event of damage.
However the use of commodity camera systems is not without its drawbacks. Some of these camera systems may be capable of recording image locations using GPS, but this information may be inaccurate or missing. Also, depending on the original purpose for capturing the images and video, the nature of the data may be problematic for 3D reconstruction.
There are often several challenges present when processing datasets captured with commodity cameras which may include:
•
Image quality (lighting, focus issues, blur and image resolution)•
Camera calibration (unstable optics and lack of calibration)• Non-existent or inaccurate orientation data
• Large unordered dataset (heterogeneous data acquisition of the object of interest, e.g. sometimes
large temporal gaps between sequences of the same object)
•
Non-optimal acquisition of data (no wide field of view or still images without sufficient overlapping areas)Despite these limitations we believe that there is often more useful data than previously thought in many of these datasets. In this paper we present an approach which can deal with these conditions and be used to create 3D models from these datasets.
In Section 2 we give an overview of some of the related work in this area before outlining our proposed method in Section 3. Section 4 shows the results of our method when applied to a large dataset. Finally in Sections 5 and 6 we conclude and outline some further work that may further improve out method.
2. RELATED WORK
The process of structuring large datasets for 3D reconstruction purposes has been demonstrated previously. One such method is shown by Agarwal et al. (2009). In Agarwal's approach image features are compared to a pre-prepared vocabulary tree to determine likely matches. However their method does not make use of location data where it is available and does not appear to consider processing video data. Similar to this is the work done by Abdel-Wahab et al. (2012) who aim to reconstruct models from close-range photographs using standard PCs.
Wu (2011), Furukawa and Ponce (2010) and Jancosek and Pajdla (2011) have independently developed a series of tools useful for performing 3D reconstruction. VisualSFM (Wu, 2011) can be used to perform image matching and sparse point cloud generation along with automatic camera calibration. This process can be followed by Furukawa and Ponce's PMVS2 to generate a dense point cloud and finally by Jancosek and Pajdla's CMPMVS to create a textured 3D model. These tools are very powerful however in their current form they provide no method to make use of either videos sequences or location data.
The main dataset we are working on consists of images and video of the wrecks of the HMAS Sydney II and HSK Kormoran – Australian and German military vessels (respectively) which sank each other during World War II. Some previous work has been done on this dataset to discover which parts of the wrecks could be modelled using the still images and available tools (Beven, 2012). However this examination did not make use of either the video footage or the location data largely owing to the unstructured nature of the data and the lack of appropriate tools to analyse it.
In extension of many of the above approaches our aim is to use all the information present in a dataset to enable us to generate 3D models. These 3D models should contain as much of the scene as possible in as much detail as is available. Many of the above methods do not make use of all the data that is available in such datasets, while others make assumptions about the data that may not be valid in all cases.
3. METHODOLOGY
The task of finding matching points between all images in a dataset is an O(n2) problem (order of magnitude = the number of images squared). We have proposed several optimisations to reduce the time needed to match relevant image pairs. By making use of the image data in combination with available location data and time data we can greatly reduce the number of images we attempt to match.
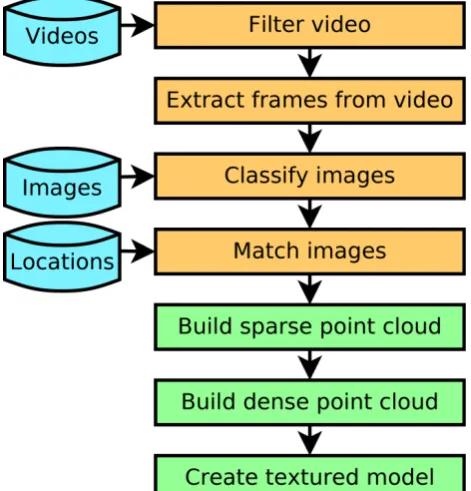
Our workflow is illustrated in Figure 1. We include the information from the dataset at different points along the workflow where it becomes relevant. First we filter the video to remove unusable frames. Subsequently we extract a minimal number of frames from the video while maintaining connectivity. At this point the still images and video frames are classified into groups to assist the image matching. We then
To filter the images the SIFT (Lowe, 2004) keypoint detector is used. A decision is made as to whether a frame has sufficient information by defining a threshold tSIFT. If the frame has less than tSIFT features then it is discarded. In our implementation tSIFT is pre-defined and based on empirical tests. Frames may be unusable for several reasons, the most obvious reasons include the camera pointing at a featureless scene such as a clear sky or being out of focus such that there is no information left in the image.
After filtering the video we extract a minimal number of frames that preserve connectivity. The frames to extract are selected based on one of two criteria. Firstly we attempt to preserve connectivity by subsampling the video and checking for sufficient matching SIFT features, defined by tcSIFT, that can be verified by generating a fundamental matrix for the image pair. If there are insufficient matching features then the sampling frequency is doubled and the process repeated until either the number of matching SIFT features is over the threshold tcSIFT or the sample rate reaches fMAX. tcSIFT and fMAX are predefined and determined empirically. When either of these conditions are true the frame is extracted. This procedure is repeated until the whole video sequence has been processed.
Finally we classify the set of extracted video frames and still images into groups based on common image features. This is done by either manually or automatically selecting images as representatives for the groups. The set of images is first compared to the manually selected representatives and images that share more than tgSIFT SIFT features are added to the appropriate group. Images are then selected automatically as representatives for new groups. If an image contains significant detail, defined by a threshold number of SIFT features, trSIFT, and is not a member of an existing group a new group is formed with this image as the representative. Images sharing more than tgSIFT features are then added to this group and the process is repeated until no more groups can be formed. Both trSIFT and
tgSIFT are dependant on the dataset and are determined empirically.
distance and inversely proportional to the accuracy of the location data.
Once the frames to be matched are selected the actual matching and sparse point cloud generation is performed using the approach in Wu (2011) after which a dense point clouds and finally a textured surfaces are generated using the approaches of Furukawa and Ponce (2010) and Jancosek and Pajdla (2011).
Every step outlined here is able to take advantage of parallel processing to reduce the processing time, however, for ease of development our current implementations of the video processing and image classification are single threaded. Given that there are relatively few dependencies present in these steps parallel processing should provide a significant performance improvement.
4. EVALUATION
We have applied our approach to the dataset collected by the Finding Sydney Foundation during the discovery and subsequent exploration of the HMAS Sydney II and HSK Kormoran ship wrecks. The wrecks are located approximately 207 km off the coast of Western Australia at a depth of 2468 m (HMAS Sydney Search, 2010). The location of the wrecks makes further exploration very costly and time consuming, thus there is considerable value in extracting as much information as possible from the existing dataset. The images and video were captured without the intention of them being used for photogrammetry purposes and hence were not taken in a structured manner.
The dataset consists of 1434 digital still (5 megapixel, colour) images, and approximately 40 hours of (colour, analogue, standard definition, 0.4 megapixel) video. In the dataset there are 457 digital still images and almost 16 hours of video of the HMAS Sydney wreck, and 145 still images and 5 hours of video of the HSK Kormoran. Unfortunately many of the still images have little or no overlap and thus providing little opportunity for large scale reconstruction from these alone. Since 3D reconstruction was not a priority at the time the footage was collected, the video does not cover the wreck at a level of detail usually desired for 3D reconstruction. In addition, through the lack of light the images have a high saturation in the blue channel and visibility is limited to only a few meters. There is
some location data available, however the accuracy varies quite considerably and the location is not available for all of the images and video footage.
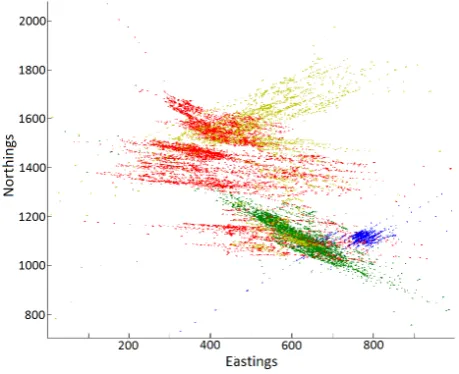
Figure 2 shows the location data for the ROV as it surveyed the HMAS Sydney wreck with each colour signifying a different dive. The tracking information was collected using an ultra-short-baseline (USBL) acoustic system and the accuracy of the data is limited by the significant depth of the wreck.
After applying our approach to images and video of the HMAS Sydney wreck 42,000 frames were extracted from the 16 hours of video and 457 still images were selected for processing. Following this approximately 40 million image pairs were selected for matching, which comprises approximately 4.4% of the possible matches using a naive strategy.
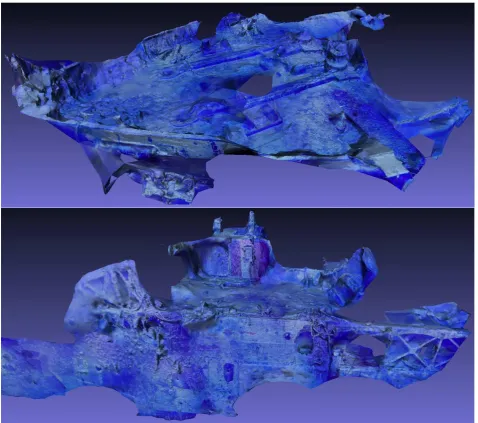
The computation for the models was performed using a 2.66 GHz Intel i7 processor with 18 GB of system RAM and an 896 MB NVIDIA GeForce GTX 275 graphics card. The time taken to extract frames from the videos was 8 hours followed by the time taken to classify the images of 48 hours. Finally matching the images took approximately 430 hours. Several point clouds were generated and some of these were further processed using PMVS2 (Furukawa and Ponce, 2010) and CMPMVS (Jancosek and Pajdla, 2011) to generate textured 3D models. The processing time for this part varied depending on the number of images in each model. For example the model of the side of the Sydney shown in Figure 3 consists of 1396 images and took 14 hours to render using CMPMVS. These models were then viewed in MeshLab for evaluation.
Part of the HSK Kormoran wreck was also modelled using this method. 8,590 video frames were extracted from one of the dives covering the Kormoran wreck, and these were combined with 145 still images. Using the location data these images were matched and a model generated also shown in Figure 3. For this smaller dataset the matching process took approximately 40 hours, and a textured model of the Kormoran foredeck consisting of 1,238 images was produced taking a further 20 hours to render using CMPMVS.
We note that the 3D models shown in Figure 3 that have been extracted using both the images and video frames do have some limitations – the colour information is dominated by the blue colour of the video frames mentioned earlier, and due to the limited resolution of the video frames, the 3D models have limited resolution – much less than if the models were extracted exclusively from multi-megapixel digital still cameras.
Using this approach many parts of the HMAS Sydney wreck can now be reconstructed in varying levels of detail. Figure 4 shows a schematic of HMAS Sydney with areas that can be partially reconstructed highlighted in green. It should be noted that the bow of the ship is detached from the rest of the ship as shown by the solid line. While some of the green areas may be connected the models created may not be connected. This occurs for several reasons, the most common is that the video has a small amount of overlap between the two parts but not enough to connect the models created.
The resulting models created from the dataset can only be evaluated through visual inspection as there is no reference data available apart from the original build plans. However the resulting models appear to be generally accurate and show that this method has potential for processing datasets of this type. Figure 2. Location data for the HMAS Sydney images and
5. CONCLUSIONS
In this paper we have presented a method for creating 3D models from large unstructured datasets. Our approach makes use of several types of data commonly available by extracting frames from video sequences then combining this with location data and still images. The images are classified and using location and temporal information to guide matching image pairs are matched. Finally 3D models of the scenes are generated.
In the case of the dataset from the HMAS Sydney and HSK Kormoran this is the first time to our knowledge that models
have been created using a combination of both the images and videos. This has resulted in unprecedented coverage of the shipwrecks and much more complete models than previously available.
We believe that using this method several other large datasets could be analysed and 3D models of other areas could be produced. This may allow visualisation of other lost places that can no-longer be visited.
6. OUTLOOK
As noted above, the accuracy of the 3D models we have
Figure 4. Schematic of HMAS Sydney (HMAS Sydney Search, 2010) with a green overlay showing area which can be partially reconstructed from the dataset
extracted from this dataset could only be evaluated through visual inspection. Our next step is to verify our approach using datasets with available reference data.
Our proposed workflow does cut down the computational complexity of the image matching compared to a naive approach, however the computation time for this step is still significant compared to the other steps. This process could potentially be further improved upon by creating tracks for each video individually by combining available position and visual odometry data using a Kalman filter to generate a more accurate position of the ROV. Once this has been generated for each video sequence tracks could be matched and only segments that are within a specified distance are selected for matching. Further to this, we currently do not consider orientation data from sources such as compass or accelerometers. If available, using such information would also help optimise the number of image pairs selected for matching, further reducing the computation time for image matching. This could be combined with an iterative matching approach where images are first matched with a small value for dMATCH then matched again with a larger value taking into account the calculated orientation.
As noted by Bartelsen et al. (2012) SIFT is not fully affine invariant and this affects the results of the image matching because there cannot be significant rotation or perspective change between image pairs. An approach that deals with larger viewpoint changes is that of Morel and Yu (2009) known as ASIFT. Due to the unstructured nature of these datasets and the large viewpoint changes that result ASIFT would likely provide a significant increase in useful image matches and a higher number of matching points between images.
Many of the images present in the dataset contained motion blur, some work has been done attempting to remove this type of blur Hanif and Seghouane (2012) have proposed a method of blur removal which may be able to increase the number of keypoints that are able to be detected in the dataset we have used and hence improve the number of matching points between affected images.
7. REFERENCES
Agarwal, S., Snavely, N., Simon, I., Seitz, S. and Szeliski, R., 2009. Building Rome in a Day. International Conference on Computer Vision, 2009, Kyoto, Japan.
Bartelsen, J., Mayer, H., Hirschmuller, H., Kuhn, A. and Michelini, M., 2012. Orientation and Dense Reconstruction from Unordered Wide Baseline Image Sets. Photogrammetrie -Fernerkundung - Geoinformation, Heft 4, pp. 421-432.
Beven, G., 2012. A Look at Photogrammetry Using Images from the 2008 HMAS Sydney II Survey.
Furukawa, Y., Ponce, J., 2010. Accurate, Dense, and Robust Multi-View Stereopsis. In: IEEE Transactions on Pattern Analysis and Machine Intelligence, Vol. 32, Issue 8, pp 1362-1376.
Hanif, M and Seghouane, A., 2012. Blurred Image Deconvolution Using Gaussian Scale Mixtures Model in Wavelet Domain. IEEE 2012 International Conference on Digital Image Computing Techniques and Applications
HMAS Sydney Search, 2010. The Finding Sydney Foundation
“HMAS Sydney II” http://www.findingsydney.com/sydney.asp (1 Feb. 2013)
Jancosek, M., Pajdla, T., 2011. Multi-View Reconstruction Preserving Weakly-Supported Surfaces, IEEE Conference on Computer Vision and Pattern Recognition 2011
Lowe D. 2004. Distinctive Image Features from Scale-Invariant Keypoints. International Journal of Computer Vision. 60 (2), pp 91-110
Morel, J., Yu, G., 2009: ASIFT: A New Framework for Fully Affine Invariant Image Comparison. - SIAM Journal on Images Sciences 2 (2) pp 438-469
Reid I., Zisserman A., 1996. Goal-directed video metrology. In: ECCV 1996, pp 647-658
Wu, C., 2011. "VisualSFM: A Visual Structure from Motion System", http://homes.cs.washington.edu/~ccwu/vsfm/ (31 Jan. 2013)
ACKNOWLEDGEMENTS