IMAGE ENHANCEMENT AND SPECKLE REDUCTION OF FULL POLARIMETRIC
SAR DATA BY GAUSSIAN MARKOV RANDOM FIELD
M. Mahdian a, *, M. Motagh b, V. Akbari c
a
Dept. of Geomatics Engineering, College of Engineering, University of Tehran, Tehran, Iran - [email protected] b
GeoForschungsZentrum (GFZ) Potsdam, Telegrafenberg, D-14473 Potsdam, Germany - [email protected] c
Dept. of Physics and Technology, University of Tromsø, Tromsø, Norway - [email protected]
KEY WORDS: Speckle reduction, Polarimetric SAR, Markov random field, Contextual analysis, Pixel-wise analysis.
ABSTRACT:
In recent years, the use of Polarimetric Synthetic Aperture Radar (PolSAR) data in different applications dramatically has been increased. In SAR imagery an interference phenomenon with random behavior exists which is called speckle noise. The interpretation of data encounters some troubles due to the presence of speckle which can be considered as a multiplicative noise affecting all coherent imaging systems. Indeed, speckle degrade radiometric resolution of PolSAR images, therefore it is needful to perform speckle filtering on the SAR data type. Markov Random Field (MRF) has proven to be a powerful method for drawing out eliciting contextual information from remotely sensed images. In the present paper, a probability density function (PDF), which is fitted well with the PolSAR data based on the goodness-of-fit test, is first obtained for the pixel-wise analysis. Then the contextual smoothing is achieved with the MRF method. This novel speckle reduction method combines an advanced statistical distribution with spatial contextual information for PolSAR data. These two parts of information are combined based on weighted summation of pixel-wise and contextual models. This approach not only preserves edge information in the images, but also improves signal-to-noise ratio of the results. The method maintains the mean value of original signal in the homogenous areas and preserves the edges of features in the heterogeneous regions. Experiments on real medium resolution ALOS data from Tehran, and also high resolution full polarimetric SAR data over the Oberpfaffenhofen test-site in Germany, demonstrate the effectiveness of the algorithm compared with well-known despeckling methods.
* Corresponding author.
1. INTRODUCTION
Polarimetric analysis enhances the discrimination capability of SAR sensors and this makes the PolSAR data very useful for various land use applications. However, polarimetric SAR data suffer from some limitations related to unavoidable presence of speckle noise caused by coherent interface of waves reflected from many elementary scatterers (J.-S. Lee 1981). The presence of speckle in PolSAR data complicates the image processing and interpretation and also reduces the accuracy of image segmentation and classification. Consequently, reduction of such noises is a principal step in preprocessing procedure and should be realized before other analysis applied to data. Speckle degrades radiometric resolution of SAR images (Espinoza Molina, Gleich, and Datcu 2012) and understanding PolSAR speckle statistics can be beneficial for different applications such as change detection (Moser and Serpico 2006), ice monitoring (Dierking and Busche 2006), and land cover classification (Tison et al. 2004).
Various techniques are presented in literature for speckle reduction. These techniques include the very simple idea of moving average and multi-look processing to more sophisticated statistical modelling (J. S. Lee and Pottier 2009). Generally, speckle reduction methods are divided into parametric and nonparametric approaches. Nonparametric methods are used according to local statistics of the image while parametric methods use a proper statistical model for data and estimate its parameters using either pixel-wise or contextual analysis (Tello Alonso et al. 2011).
Markov Random Field (MRF) has proven to be a powerful parametric model for drawing out eliciting contextual information from remote sensing imagery (Moser and Serpico 2006). One of the most important benefits of MRF method is its extraordinary ability to model the spatial correlation between neighbouring pixels. MRF models have been used in different kinds of image analysis applications such as image segmentation, texture extraction, image denoising and data fusion (Li 2009). The potential of MRF models to retrieve spatial contextual information makes it desired to reduce the speckle noise of the PolSAR data. This research presents a novel approach for speckle reduction of PolSAR images by combining advanced statistical modeling and spatial context within an MRF framework. MRF models have been used in different image analysis problems such as segmentation (Deng and Clausi 2004) and classification (Tison et al. 2004).
In this paper, a combination of pixel-wise and contextual analysis is introduced for the representation of restored PolSAR data. First a probability density function (PDF) which is fitted well with the used data based on goodness-of-fit test, is obtained for pixel-wise analysis. Then the contextual smoothing is achieved with MRF model. A new idea which is proposed for speckle reduction of SAR data based upon weighted summation of these two sections (i.e. pixel-wise and contextual analysis). The weights are determined according to the spatial correlation between pixels over pre-defined neighbourhood system. For each window, if the correlation between the central pixel and neighbouring pixels is high, more weight is assigned to pixel-International Archives of the Photogrammetry, Remote Sensing and Spatial Information Sciences, Volume XL-1/W3, 2013
wise part and vice versa. Therefore, we can optimize the role of contextual smoothing in the speckle reduction by giving appropriate weight to it. Our proposed methodology is applied to full polarimetric L medium resolution ALOS data from Tehran, Iran and also to high resolution L-band PolSAR data over the Oberpfaffenhofen test-site in Germany. These images cover both urban and non-urban areas. The results of this adaptive speckle reduction method are compared to other well-known de-speckling methods. The efficiency of the approach has evaluated by quantitative metrics (i.e. Signal to noise ratio, Equivalent number of look and Root mean square error). Section 2 of this paper describes the methodology and introduces our proposed filtering technique. In the next section experimental results presented and discussion and conclusion offered in continuation.
2. METHODOLOGY
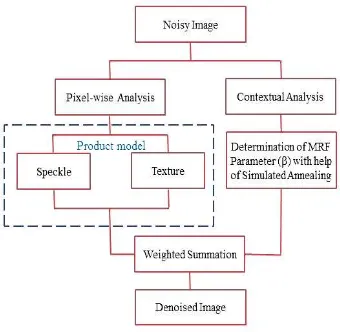
The main purpose of despeckling is the estimation of the noise-free image from the observed image. The noise-noise-free image is achieved in this study by performing of both pixel-wise and contextual analysis simultaneously but their effective combination remains a major challenge. Figure 1 illustrates the detailed flowchart of methodology we used for this challenging combination.
Figure 1. Flowchart of proposed approach.
We base our theory upon the doubly stochastic product model (Espinoza Molina, Gleich, and Datcu 2012), which decompose single look complex (SLC) value as:
k (1)
Where the strictly positive scalar random variable models
texture, and represents the backscatter variability due to heterogeneity of the radar cross section (Oliver and Quegan 2004). The second component, the speckle noise term ω, follows complex Gaussian distribution. With a logarithm transformation, the multiplicative nature of the above equation gets additive as follows:
We will use the homogeneous Gauss-MRF to model the spatial correlation between pixels for both texture and speckle components.
Therefore, we can separate pixel-wise and contextual parts as:
)
and their weighted summation is written as equation (5).
C
2.1 Pixel-wise statistical analysis
The texture term of the product model is given by the gamma distribution with PDF given by:
)
With shape parameter α > 0 and unit mean value E{ }=1.
The flexibility of the gamma distribution by different shape parameters is shown in Figure 2. The resulting distribution of the product model follows K-distribution.
Figure 2. Flexibility of gamma distribution with different values of shape parameter.
2.2 Contextual analysis by MRF
For extraction of contextual information and its integration with pixel-wise term for improving of speckle reduction, we adopt an MRF model which generally presents spatial correlation between neighbouring pixels. As a consequence, an MRF can be applied for contextual term and gamma distribution while Gaussian model are used for pixel-wise term for the SAR image statistics.
2.2.1 Markov random field
MRF theory enables the modeling of contextual dependencies between a set of sites S which are given by:
s i j i M j N
Where B denotes the pixel lattice and set of all possible values in the image. The values for a set of sites S will be denoted by:
x x xn
X 1, 2,..., (9)
We introduce first and second-order neighbourhood systems as illustrated graphically in Figs. 3 - 4(Levada, Mascarenhas, and Tannús 2008).
Figure 3. First-order neighbourhood system and its division into cliques. The black squares represent the site of interest and
the white squares represent the neighbouring sites.
Figure 4. Second-order neighbourhood system.
In this research Gauss-MRF will be presented that is more suitable for modeling images with a large number of intensity levels. This model is defined by the choice of continuous potential functions. Pairwise cliques, having two sites, are the smallest cliques to convey contextual information. Models with higher order cliques can potentially model more complex interactions between values than models using only pairwise cliques. The models discussed in this paper use only single and
pairwise cliques. The Gaussian model is defined for continuous
values by its mean and covariance terms. The conditional probability density function (pdf) for the label at a site given the labels of the neighbouring sites is given by:
2 which is as follows:
Gaussian model are:2
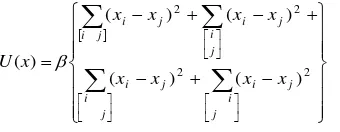
2.2.2 Energy function for Gauss-MRF model
Assuming second-order neighbourhood system, the energy function of the Gauss-MRF is given by:
confines an isotropic second-order isotropic neighbourhood system and the related set of pairwise cliques (Levada, Mascarenhas, and Tannús 2008), as depicted in Figure 4.
2.3 Weight determination
In the previous section, we discussed about how to determine pixel-wise and contextual terms separately. Now we modulate these parts by giving appropriate weights to each of them. A novel idea is proposed here for modulating these parts based upon weighted summation of these two sections (i.e.,pixel-wise and contextual analysis). The weights are determined based on the spatial correlation between pixels over a given neighbourhood system. For each window, if the correlation between the central pixel with neighbouring pixels is high, more weight is assigned to pixel-wise part and vice versa. Therefore, we can optimize the role of contextual smoothing in the speckle reduction by giving the appropriate weight to it. This approach maintains the mean value of the original signal in the homogenous areas and preserves the edges of features in the heterogeneous regions.
Therefore, weight parameter in Equation (14) (R parameter) can be estimated as follows:
2
Normalized weighting coefficient is given by:
2
3. QUANTITATIVE EVALUATION METRICS
The performance of the proposed algorithm for speckle reduction is evaluated in term of quantitative metrics such as signal to noise ratio (SNR), equivalent number of look (ENL), root mean square error (RMSE). Also the results are compared with other well-known speckle reduction methods. Larger SNR values correspond to qualitative image. SNR can be calculated from equation (16):
) (
) (
log 10
2 , 1 1
2 ,
2 , 1 1
2 ,
n m M
m N
n n m
n m M
m N
n n m
B A
B A SNR
(16)
In this equation A, B are de-noised and original images respectively and M×N is the size of image. The values of SNR indicate the quality of image reconstruction.
Equivalent Number of Looks (ENL) is another metrics which show the ability of speckle reduction and performance of smoothing procedure. This quantitative index calculated using the following equation:
2
) (
ENL (17)
μ and are the mean and standard deviation of the images. The
higher values of ENL show the higher efficiency in smoothing speckle on homogeneous areas.
Root Mean Square Error (RMSE) is other metrics which is root of the square error averaged over m×n window. This parameter is calculated as in (18) and lower values of that show higher quality of de-speckled image.
21 1
, ,
1
M
m N
n
n m n
m B
A MN
RMSE (18)
4. IMPLEMENTATION ON REAL POLSAR DATA
In this section we present restoration results applied to real PolSAR data. The results of the proposed methodology are shown using medium-resolution L-band ALOS data (image has size 512 x 512) from the Tehran area in Iran (Fig. 5(a)) and a sample data set of ESAR PolSAR data, from Oberpfaffenhofen test site (Fig. 5(c)). Figures 5(b) and 5(d) show two filtered images with the proposed method in this research. As seen in Figures 5(b,d), preserving and sharpening of linear structures such as roads and coastal line is visually evident.
(a) Original image (Tehran) (b) Despeckled image (Tehran)
(c) Original image (Oberpfaffenhofen)
(d) Despeckled image (Oberpfaffenhofen)
Figure 5. Despeckling Results of Amplitude Image.
Tables 1 and 2 list the comparison between quantitative indices of some de-noising methods for our case study. Improvement in the signal to noise ratio and amount of the RMSEs is also evident in terms of these metrics.
Table 1. Quantitative Comparison for Despeckeling of ALOS Image
Table 2. Quantitative Comparison for Despeckeling of ESAR Image
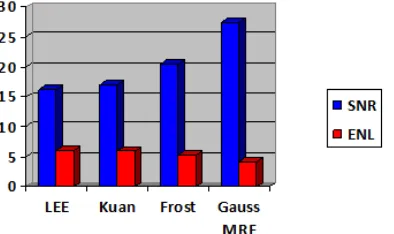
Figures 6 and 7 present a visual comparison of proposed method with other well-known methods.
Figure 6. Visual comparison for Despeckeling of ALOS Image. Parameters
SNR ENL RSME
Methods
Lee 17.69 6.32 0.087
Kuan 17.41 6.49 0.086
Frost 19.89 5.97 0.079
Gauss
MRF 25.66 4.95 0.023
Parameters
SNR ENL RSME
Methods
Lee 16.11 6.05 0.072
Kuan 17.04 5.93 0.069
Frost 20.38 5.19 0.058
Gauss
MRF 27.41 4.08 0.019 International Archives of the Photogrammetry, Remote Sensing and Spatial Information Sciences, Volume XL-1/W3, 2013
Figure 7. Visual comparison for Despeckeling of ESAR Image.
5. CONCLUSION
In this paper a novel despeckling algorithm has been developed for PolSAR imagery. This method works by integration of advanced statistical analysis with spatial contextual information with the help of Markov random field. We tested the proposed algorithm for a real medium-resolution L-band ALOS PolSAR data (image has size 512 x 512) from Tehran area in Iran and a sample data set of ESAR PolSAR data, from Oberpfaffenhofen test site. The obtained results confirm the effectiveness of proposed algorithm by both visual inspection and quantitative comparison. In particular, the proposed method has a good performance in preserving edges of features and improving signal to noise ratio in the final despeckled images.
6. REFERENCES
Deng, Huawu, and David A. Clausi. 2004. “Unsupervised
Image Segmentation Using a Simple MRF Model
with a σew Implementation Scheme.” Pattern Recognition 37 (12): 2323–2335.
Dierking, Wolfgang, and Thomas Busche. 2006. “Sea Ice Monitoring by L-band SAR: An Assessment Based on Literature and Comparisons of JERS-1 and ERS-1
Imagery.” Geoscience and Remote Sensing, IEEE Transactions On 44 (4): 957–970.
Espinoza Molina, Daniela, Du\vsan Gleich, and Mihai Datcu.
2012. “Evaluation of Bayesian Despeckling and
Texture Extraction Methods Based on Gauss–Markov and Auto-Binomial Gibbs Random Fields: Application to TerraSAR-X Data.” Geoscience and Remote Sensing, IEEE Transactions On 50 (5): 2001– 2025.
Lee, J. S., and E. Pottier. 2009. Polarimetric Radar Imaging: From Basics to Applications. Vol. 142. CRC. Lee, Jong-Sen. 1981. “Speckle Analysis and Smoothing of
Synthetic Aperture Radar Images.” Computer Graphics and Image Processing 17 (1): 24–32. Levada, Alexandre LM, Nelson DA Mascarenhas, and Alberto
Tannús. 2008. “A σovel Pseudo-likelihood Equation for Potts MRF Model Parameter Estimation in Image
Analysis.” In Image Processing, 2008. ICIP 2008. 15th IEEE International Conference On, 1828–1831. Moser, G., and S. B. Serpico. 2006. “Generalized Minimum
-error Thresholding for Unsupervised Change
Detection from SAR Amplitude Imagery.”
Geoscience and Remote Sensing, IEEE Transactions On 44 (10): 2972–2982.
Oliver, Chris, and Shaun Quegan. 2004. Understanding Synthetic Aperture Radar Images. SciTech Publishing.
Tello Alonso, Marivi, Carlos López-Martínez, Jordi J.
Mallorquí, and Philippe Salembier. 2011. “Edge
Enhancement Algorithm Based on the Wavelet Transform for Automatic Edge Detection in SAR
Images.” Geoscience and Remote Sensing, IEEE Transactions On 49 (1): 222–235.
Tison, Céline, J.-M. Nicolas, Florence Tupin, and Henri Maître.
2004. “A σew Statistical Model for Markovian
Classification of Urban Areas in High-resolution SAR
Images.” Geoscience and Remote Sensing, IEEE Transactions On 42 (10): 2046–2057.
Smith, J., 1987a. Close range photogrammetry for analyzing distressed trees. Photogrammetria, 42(1), pp. 47-56.