ESTIMATION OF BIOMASS POTENTIAL BASED ON
CLASSIFICATION AND HEIGHT INFORMATION
S. Müller a,b,*, O. Büscher b, M. Jandewerth c
a
Institute of Photogrammetry and GeoInformation, Leibniz Universität Hannover, Nienburger Str. 1, 30167 Hannover, Germany - [email protected]
b EFTAS Fernerkundung Technologietransfer GmbH, Oststraße 2-18, 48145 Münster, Germany - [email protected]
c
Fraunhofer-Institut für Umwelt-, Sicherheits- und Energietechnik UMSICHT, Osterfelder Str. 3, 46047 Oberhausen, Germany - [email protected]
KEY WORDS: Resources, Monitoring, Satellite, DEM, Extraction, Spatial Infrastructures, Sustainable
ABSTRACT:
On the way to make energy supply independent from fossil resources more and more renewable energy sources have to be explored. Biomass has become an important energy resource during the last years and the consumption is rising steadily. Common sources of biomass are agricultural production and forestry but the production of these sources is stagnating due to limited space. To explore new sources of biomass like in the field of landscape conservation the location and available amount of biomass is unknown. Normally, there are no reliable data sources to give information about the objects of interest such as hedges, vegetation along streets, railways and rivers, field margins and ruderal sites. There is a great demand for an inventory of these biomass sources which could be answered by applying remote sensing technology. As biomass objects considered here are sometimes only a few meters wide, spectral unmixing is applied to separate different material mixtures reflected in one image pixel. The spectral images are assumed to have a spatial resolution of 5-20m with multispectral or hyperspectral band configurations. Combining the identified material part fractions with height information and GIS data afterwards will give estimates about the location of biomass objects. The method is applied to test data of a Sentinel-2 simulation and the results are evaluated visually.
* Corresponding author. Tel. +49 511 762 4922
1. INTRODUCTION
Due to limited fossil resources the role of renewable energy is getting more and more important. The percentage part of renewable energy use in Germany has been increased from 1.3% in 1990 to 11% in 2011. Biomass resources are an important component of renewable energy. The German production of electric energy with biomass resources changed from 221GWh in 1990 to 31,920GWh in 2011. In the same period the production of heat using biomass increased from 28,265GWh to 118,570GWh. Biomass together with wind energy has been the fastest growing type in energy production since the last 20 years.
Since space for biomass production is limited and energy plants are competing with food production new sources of biomass production need to be investigated. Our approach aims to use biomass from landscape conservation elements that are in most cases not used in a targeted manner. The landscape conservation objects under investigation are hedgerows, unploughed strips, vegetation beside streets, rivers, watercourses and railways, fallow land and protected areas, where an economic usage is allowed.
For these types of biomass sources no reliable or no spatial information at all is area-wide available. In areas where biomass from landscape elements is already used, the spatial information about the existence is acquired manually. For a wide usage of these biomass types an automatic detection and inventory based on remote sensing is necessary to deliver a reliable source of
information. Our approach should fill the gap of monitoring area-wide landscape conservation elements for biomass use.
The paper is structured as follows: Chapter 2 gives an overview about existing approaches in the detection and monitoring of biomass objects. Moreover, the strategy of our approach is presented. Next, in Chapter 3 the used data sources are described. Chapter 4 deals with the proposed workflow in detail and the applied methods for each step are explained. Finally, in chapter 5 the objects of interest are described and the first results of our experiments are dicussed.
2. RELATED WORK
Remote sensing approaches that deal with biomass feedstock production consider in most cases only agricultural crops. An overview about these approaches can be found in Ahamed et al. (2011) who review concepts, methods and commercial software for monitoring energy crops.
Only a few approaches deal with the monitoring of small biomass units in contrast to forests and agricultural crop production. For these approaches sometimes additional information is used in form of height information to increase the recognition rates. Due to the limited number of approaches, a general trend of promising solutions is not existing. In the following the ideas of approaches that deal with these small objects are reviewed.
Estornell et al. (2012) use LiDAR data and airborne images to estimate biomass and volume of shrub vegetation. Features of International Archives of the Photogrammetry, Remote Sensing and Spatial Information Sciences,
both data sources serve here as input to a regression model. The results show good accordance of the estimations and ground trouth.
Forzieri (2012) relies only on spectral information from SPOT satellite images to retrieve an estimation of woody biomass. First he applies a Maximum Likelihood classifier to find regions of arboreal, shrub and herbaceous vegetation. The further approach is aimed at finding an analytical model representing the relationship between vegetation parameters like tree height and stem diameter and the spectral SPOT information by correlation analysis.
Popescu (2007) applies an existing model that estimates the carbon content of single pine trees with the two parameters tree height and crown diameter. In airborne LiDAR data tree crowns are identified with an adaptive technique of local maximum focal filtering resulting in the two parameters for the carbon model.
Bargiel (2013) examines the potential of TerraSAR-X High Resolution Spotlight images to classify the classes grasslands, herbaceous, trees, shrubs and flower strips. He processes a time series of 6 images of one year and applies with success a Random Forest classifier. For woody structures the approach delivers a producer's accuracy above 80%.
In this work we present an approach that aims at processing low spatial resolution satellite data of about 10-20m GSD that is cost-effective and area-wide available. Due to small objects of interest spectral unmixing is applied to achieve the fraction of each material inside a single pixel. For a more precise estimation of the achievable harvest amount, volume parameters like vegetation height are determined in digital surface data. The estimation of the biomass amount itself is not part of this paper, only areas that have high potential of biomass should be identified here.
3. DATA DESCRIPTION
3.1 AISA Eagle
The AISA Eagle sensor is a hyperspectral airborne line scanner that works in a spectral range of 400-970nm and separates up to 488 spectral bands. For our experiments a configuration of 107 spectral bands in a range of 431-926nm with a spatial resolution of 0.5m is used. The bandwidths in our test dataset of the single bands lie between 4.27nm and 4.81nm, the central wavelengths of all bands are shown in Table 1. An excerpt of the original
Table 1 AISA Eagle central wavelengths [nm] bands 1 to 107.
3.2 Sentinel-2
Sentinel-2 (cp. Drusch et al. (2012)) will be a pair of two satellites whereof the start of the first satellite is planned in 2014. Sentinel-2 will deliver data in the visible, near infrared and shortwave infrared spectrum comprising 13 spectral bands: 4 bands at 10m, 6 bands at 20m and 3 bands at 60m spatial resolution (cp. Table 2), with a swath width of 290km. Sentinel-2 will have the benefit to be available area-wide and cost-effective therefore a simulation to prepare the usage of Sentinel-2 of the 10m and Sentinel-20m bands is fulfilled in chapter 4.1.
band identify vegetation beside streets, rivers, watercourses and railways. For our experiments GIS information about streets and watercourses is taken from the German ATKIS Basis-DLM (cp. AdV, 1997) to reduce the search space in finding landscape conservation elements for a potential biomass usage. GIS information is an important source of information since the objects of interest are small in comparison to the available spatial image resolution.
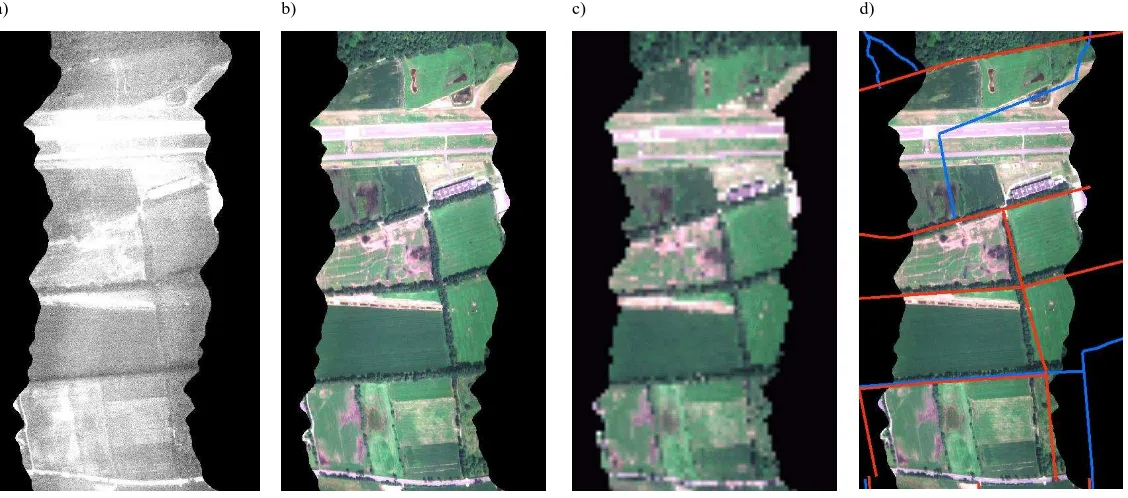
a) b) c) d)
Figure 1 a) AISA Eagle input data band 1 b) simulated Sentinel-2 data bands 2-4, 0.5m GSD c) simulated Sentinel-2 data bands 2-4, 10m GSD d) simulated Sentinel-2 data overlayed with input GIS, red = streets, blue = watercourses (including underground
watercourses).
4. METHODS
4.1 Simulation of Sentinel-2
Since Sentinel-2 data is not yet available simulation data is calculated based on a hyperspectral AISA Eagle dataset. In comparison to other data simulation approaches (cp. Segl et al. 2012) where complex sensor models are known and used a simplified method is applied here.
First, corresponding bands between the source and target dataset are determined. For example, band 1 of Sentinel-2 covers a bandwidth between 433nm and 453nm. All AISA Eagle bands that lie in this range form the basis for the simulation, here bands 2 to 6. The complete band mapping that is used is shown in Table 3.
Second, pixel values DN are calculated for each of the 9 Sentinel-2 simulation bands according to Equation 1, where ti is the band number of the target dataset, sn the band number of the source (AISA Eagle) dataset.
max
i n
min n
t s
n n
DN
DN
(1)Third, a resampling of the simulated bands is done to get the desired target resolution of 10m, 20m or 60m. In Figure 1 c) the simulation results for bands 2-4 with a spatial resolution of 10m are illustrated. The Sentinel-2 simulation data are the basis for the further experiments.
Sentinel-2 simulation
band number
accumulated AISA bands
amount of AISA bands
target spatial resolution
1 2-6 5 60
2 8-21 14 10
3 26-33 8 10
4 49-55 7 10
5 60-62 3 20
6 67-69 3 20
7 76-79 4 20
8 78-101 24 10
8b 93-96 4 20
Table 3 Corresponding AISA Eagle bands for Sentinel-2 simulation.
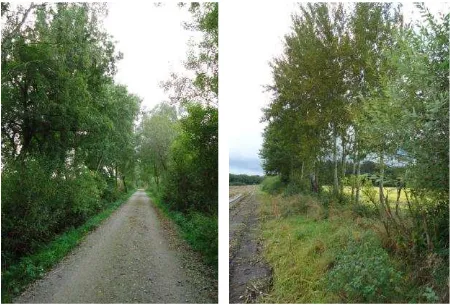
Figure 2 Examples of target objects in test site: vegetation beside streets (left), unploughed strips (right).
4.2 Spectral unmixing
Due to the limited spatial resolution of the Sentinel-2 simulation data and objects of interest that are smaller than pixel size the application of multispectral classification at sub-pixel level is limited or difficult. The smallest objects of interest like vegetation beside streets and unploughed strips (cp. Figure 2) have a width of not more than 3 to 5m thus single image pixels represent a mixture of reflectance values of several materials. In our case, neighboring crops or street surface influence the pixel values that represent the objects of interest.
In contrast to classification methods that assign the most probable class to each pixel, spectral unmixing decomposes a mixed pixel spectrum into a collection of constituent spectra, called endmembers, and a set of corresponding fractions, or abundances. Endmembers represent in this context the reflectance characteristics of pure material reflectances, for example water, soil, vegetation and street surface. The output of spectral unmixing is information about the number and spectra of the existing endmembers in an image and in contrast to classification methods for each pixel the individual composition of endmembers.
For any spectral unmixing approach a mixture model has to be defined that describes how constituent material substances in a pixel combine to yield the spectrum measured at the sensor. Most approaches assume a linear mixture model according to Equation 2, where DN is a pixel value, N the number of endmembers, ai the abundance of endmember i and si the spectrum of endmember i. According to Equation 3 the sum of all abundances for a unique pixel has to be 1.
1
For our experiments a powerful spectral unmixing approach called Sequential Maximum Angle Convex Cone (SMACC) that is available in the software ENVI is applied. SMACC (cp. Gruninger et al. 2004) works with a convex cone model (residual minimization) and simultaneously generates sets of endmembers and endmember abundance maps. The
endmembers are selected directly from the input data set. SMACC starts with a single endmember and increases incrementally in dimension. The abundance maps are created and updated at each step. The data vector that builds the maximum angle with the existing endmember is taken as additional new endmember and extends the endmember set. After adding a new endmember, the abundances of previous determined endmembers are updated. The method terminates when all data vectors are processed and assigned to an endmember or if a specified number of endmembers is found.
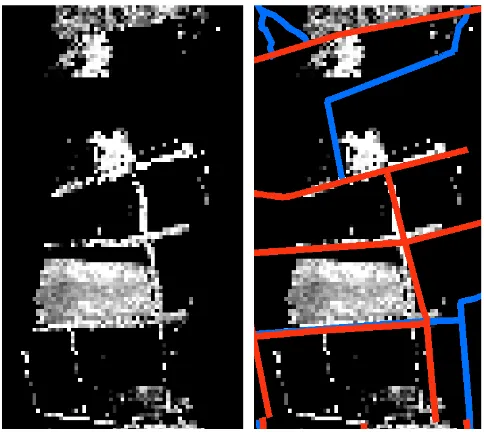
The result of this process are an abundance map, the extracted endmember spectra and special vector data that contain mapping information between each endmember and corresponding regions in the image that represent an endmember. The user can decide for the classes of interest and work with abundance maps for specific endmembers of interest. An example for an abundance map is shown in Figure 5 left.
4.3 Biomass potential estimation
The strategy for a biomass potential estimation is the combination of the spectral unmixing results with additional information that can be GIS data or height information. The estimation of the biomass amount itself is not topic of this paper as previously mentioned.
Initially the endmembers that represent the objects of interest have to be determined under evaluation of the endmember allocation information results that SMACC delivers. For our experiments all endmembers that represent vegetation classes are chosen. High values indicate high fraction of the specific endmembers, but the objects of interest that are for example hedges have still to be identified in the data.
One possibility to extract objects of interest is in our case the application of GIS data, because streets, rivers, railways and field borders are a good indication for the existence of biomass. This can be seen in Figure 1 d): nearly each object of interest is contained as object in the GIS data.
Taking biomass sources into account that are not touched by GIS data the following two methods have been developed, but experimental results are not yet available.
A promising indicator for the existence of voluminous biomass could be determined in data of digital surface models (DSM) detecting elevation of elongated shape. Possible data sources with sufficient spatial and height resolution are LiDAR data and aerial image matching results. Experiments with DSM data will start in a later stage of the project.
Another possibility of detecting potential biomass objects is the evaluation of the abundance maps itself without usage of additional data. Edge detection could be applied on the abundance maps that represent the endmembers of interest.
The final output results of the biomass potential analysis are consisting of information layers about
the location of detected biomass objects the material fractions inside biomass polygons height information about biomass objects International Archives of the Photogrammetry, Remote Sensing and Spatial Information Sciences,
5. RESULTS
The proposed approach is applied to test data from a test site in Germany, near the city of Bottrop in North Rhine-Westphalia. The test site is located in a rural area with rather extensive agricultural use and contains also parts of a natural preserve. The main objects of interest inside the test site are unploughed strips and vegetation beside streets as exemplary illustrated in Figure 2. The vegetation appears in the form of trees, shrubs and herbaceous with object widths beginning at 1.5m.
For the experiments all 4 Sentinel-2 simulation layer with a 10m spatial resolution are used as input information to the used SMACC algorithm. Due to the fact that the number of occurring endmembers is unknown, a maximum of 30 endmembers as termination condition is chosen. The SMACC algorithm ends, if the maximum number of found endmembers is reached or if the maximum relative error underruns a specific threshold. In Figure 4 the development of the maximum relative error in relation to the number of endmembers is illustrated. It can be seen that the maximum relative error converges starting from the value of 5 endmembers.
Figure 3 SMACC output: Behaviour of the maximum relative error (MRE) according to the number of endmembers.
The single spectra for the first 5 most important endmembers are shown in Figure 4. Each spectrum is consisting of 4 values, one for each input band of the Sentinel-2 simulation data. A mapping of the automatically determined endmembers to image classes is done after the spectral unmixing terminates with the result, that endmember no. 5 represents a class containing vegetation. It may happen that more than one endmember is corresponding to vegetation classes, each one to vegetation with a unique spectral response.
The abundance map for endmember 5 is shown in Figure 5 on the left handsite where bright pixel indicate high occurrence of vegetation. A visual analysis of the abundance map shows, that biomass objects of interest are well represented by endmember number 5, whereby also other vegetation objects like crops and forest are indicated.
To select elongated structures that correspond to the landscape conservation biomass objects of interest GIS data is used. A simple intersect function applied to the abundance map and buffered GIS data is used. In Figure 5 on the right handsite the correspondence of a buffered GIS to the abundance map is exemplarily shown.
Figure 4 Endmember spectra for endmember 1 to 5.
Figure 5 Abundance map for endmember 5 representing vegetation (left), overlayed with input GIS (right).
The application of edge detection and height data to find biomass objects independently of GIS data as described in Section 4.3 is not yet implemented.
6. CONCLUSION
In this work we presented an approach for the detection of biomass potential based on multispectral imagery. Due to the limited spatial resolution of the imagery in combination with small objects of interest, spectral unmixing in contrast to standard classification methods is applied.
It must be recognized that for the experiments simulation data based on aerial images is applied, real satellite data might be different in spectral and spatial characteristics resulting in different unmixing results.
The experiments show good results in indicating biomass objects. Nearly any of the biomass objects of interest could be detected with the approach. Spectral unmixing delivers abundance maps that have a higher degree of information in number of endmembers
MRE
1 2 3 4 band number
comparison to standard classification results that contain only information about the most probable class.
A further evaluation of the approach should be done in future based on reference data about biomass objects. Additional the usage of the Sentinel-2 bands of 20m spatial resolution should be investigated.
ACKNOWLEDGEMENTS
The research is done within the project BiomassMon (http://www.biomassmon.info/) that is funded by the Federal Ministry of Economics and Technology (BMWi) via the German Aerospace Center (DLR e.V.) under the funding numbers 50EE1212, 50EE1213 and 50EE1214.
REFERENCES
AdV, Arbeitsgemeindschaft der Vermessungsverwaltungen der Länder der Bundesrepublik Deutschland, 1997. ATKIS – Amtlich Topographisch-Kartographisches Informationssystem, Germany.
Ahamed, T., Tian, L., Zhang, Y., Ting, K.C., 2011: A review of remote sensing methods for biomass feedstock production, Biomass and Bioenergy, Volume 35, Issue 7, July 2011, Pages 2455–2469.
Bargiel, D., 2013. Capabilities of high resolution satellite radar for the detection of semi-natural habitat structures and grasslands in agricultural landscapes, Ecological Informatics, Volume 13, January 2013, Pages 9–16.
M. Drusch, U. Del Bello, S. Carlier, O. Colin, V. Fernandez, F. Gascon, B. Hoersch, C. Isola, P. Laberinti, P. Martimort, A. Meygret, F. Spoto, O. Sy, F. Marchese, P. Bargellini, 2012. Sentinel-2: ESA's Optical High-Resolution Mission for GMES Operational Services, Remote Sensing of Environment, Volume 120, May 2012, Pages 25-36.
Estornell, J., Ruiz, L.A., Velázquez-Martí, B., Hermosilla, T., 2012. Estimation of biomass and volume of shrub vegetation using LiDAR and spectral data in a Mediterranean environment, Biomass and Bioenergy, Volume 46, November 2012, Pages 710-721.
Forzieri, Giovanni, 2012. Satellite retrieval of woody biomass for energetic reuse of riparian vegetation, Biomass and Bioenergy, Volume 36, January 2012, Pages 432-438.
John H. Gruninger ; Anthony J. Ratkowski and Michael L. Hoke, 2004. "The sequential maximum angle convex cone (SMACC) endmember model", Proc. SPIE 5425, Algorithms and Technologies for Multispectral, Hyperspectral, and Ultraspectral Imagery X, 1 (August 12, 2004); doi:10.1117/12.543794; http://dx.doi.org/10.1117/12.543794
Popescu, Sorin C., 2007. Estimating biomass of individual pine trees using airborne lidar, Biomass and Bioenergy, Volume 31, Issue 9, September 2007, Pages 646-655.
Segl, K.; Guanter, L.; Rogass, C.; Kuester, T.; Roessner, S.; Kaufmann, H.; Sang, B.; Mogulsky, V.; Hofer, S., 2012. "EeteS—The EnMAP End-to-End Simulation Tool," Selected Topics in Applied Earth Observations and Remote Sensing, IEEE Journal of , vol.5, no.2, pp.522-530, April 2012
![Table 1 AISA Eagle central wavelengths [nm] bands 1 to 107.](https://thumb-ap.123doks.com/thumbv2/123dok/3244612.1397776/2.595.314.528.363.610/table-aisa-eagle-central-wavelengths-nm-bands.webp)