AUTONOMOUS HYPERSPECTRAL UAS PHOTOGRAMMETRY FOR
ENVIRONMENTAL MONITORING APPLICATIONS
E. Honkavaara a, *, T. Hakala a, L. Markelin a, A. Jaakkolaa, H. Saari b, H. Ojanen b, I. Pölönen c , S. Tuominend , R. Näsia, T. Rosnella, N. Viljanena
a
Finnish Geodetic Institute, Geodeetinrinne 2, P.O. Box 15, FI-02431 Masala, Finland – (eija.honkavaara, teemu.hakala, lauri.markelin, anttoni.jaakkola, roope.nasi, tomi.rosnell, niko.viljanen)@fgi.fi
b
VTT Photonic Devices and Measurement Solutions, P.O.Box 1000, FI-02044 VTT, Finland – (heikki.saari,harri.ojanen)@vtt.fi c
Department of Mathematical Information Tech., University of Jyväskylä, P.O.Box 35, FI-40014, Jyväskylä, Finland – (ilkka.polonen)@jyu.fi
d
The Finnish Forest Research Institute (Metla), PO Box 18, FI-01301 VANTAA, FINLAND– (sakari.tuominen)@metla.fi
Commission I
KEY WORDS: Photogrammetry, Remote Sensing, Hyperspectral, Block, Point cloud, Geometry, Radiometry, Calibration, UAS
ABSTRACT
The unmanned airborne system (UAS) remote sensing using lightweight multi- and hyperspectral imaging sensors offer new possibilities for the environmental monitoring applications. Based on the accurate measurements of the way in which the object reflect and emit energy, wide range of affecting variables can be monitored. Condition for reliable applications is reliable and accurate input data. In many applications, installation of geometric and radiometric reference targets in the object area is challenging, for instance, in forest or water areas. On the other hand, UASs are often operated in very poor conditions, under clouds or under variable cloud cover. Our objective is to develop an autonomous hyperspectral UAS imaging system and data processing chain that does not require any ground reference targets. Prerequisites for this kind of a system are an appropriate sensor setup, stable and well-calibrated instruments and rigorous data processing. In this paper, we will describe the new hyperspectral UAS imaging system that is under development. Important applications for the proposed system include precision agriculture, forest monitoring and water quality monitoring. Finally, we will consider the use of the system in forest inventory application and present the first results of the summer 2014 campaigns.
1. INTRODUCTION
Unmanned airborne systems (UAS) are increasingly utilized in wide variety of environmental monitoring applications. The latest developments in sensors have made the hyperspectral UAS remote sensing possible. In quantitative remote sensing applications, a fundamental requirement is data that is characterizing the physical geometric and reflectance characteristics of objects.
A novel Fabry-Perot interferometer based frame-format, light-weight hyperspectral camera is highly relevant technology in many environmental applications (Mäkynen et al., 2011; Saari et al., 2011; Honkavaara et al., 2012; 2013). When images are collected continuously with stereoscopic and multiview setups in a block structure, 3D surface information based on stereoscopy and spectral, bidirectional reflectance signatures can be produced. Area format imaging principle has many attractive features in comparison to pushbroom imaging that is the conventional technique used in hyperspectral sensors (Hruska et al., 2012).
When using area format imaging, in typical UAS projects, the area of interest is covered by hundreds or thousands of spatially overlapping images. Additional complication is that UAS campaigns are often carried out in difficult illumination conditions, under clouds or under partial cloud cover. In typical remote sensing applications, ground control points and
reference targets are installed in the project area. In many situations, installation of reference targets is laborious and sometimes difficult or even impossible. Examples of such objects are forest areas and water areas.
We are developing a data processing chain that combines rigorous photogrammetric and spectral data processing. Our previous results have been based on in situ reflectance targets. The efficiency requirements of the UAS campaigns have increased significantly, which has made the installation of ground reference targets highly intolerable. Objective of this investigation is to develop an autonomous hyperspectral UAS imaging system and data processing chain that does not require any ground reference targets. We will present the system concept in Section 2. In summer 2014 the system was tested in various environmental monitoring applications including precision agriculture, forest monitoring and water quality monitoring; as an example, the system performance will be experimented in forest inventory application (Section 3, 4).
2. EQUIPMENT AND DATA PROCESSING
2.1 Equipment
In this investigation, a hexacopter type UAV was used. The platform frame is Tarot 960 hexacopter with Tarot 5008 (340KV) brushless electric motors. Autopilot is Pixhawk The International Archives of the Photogrammetry, Remote Sensing and Spatial Information Sciences, Volume XL-1, 2014
equipped with Arducopter 3.15 firmware. Payload capacity of the system is ~3 kg and the flight time is 10-30 (depending on payload, battery, conditions, and flight style).
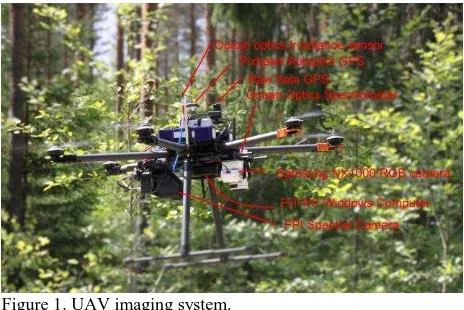
The system setup is shown in Figure 1. The central components of the system are a hyperspectral FPI-camera, Samsung NX300 RGB camera, Ocean Optics irradiance spectrometer, a small single frequency GPS receiver and FIT-PC Windows computer.
Figure 1. UAV imaging system.
The core of the observation system is a new kind of a light-weight hyperspectral camera that collects area format spectral data cubes. It is based on a Fabry-Perot interferometer (FPI). By changing the air-gap in the FPI during the exposure, the sensor produces tens of successive images at different wavelength bands in very short time. As each spectral band is collected with a small time delay when using different air gap values, each band has a slightly different position and orientation. Size of single spectral data cube band is 1024 by 648 pixels and the field-of-view at format corner is +/-31 º; the camera weighs less than 700 g. The FPI camera is equipped with a GPS receiver which records exact time of the beginning of each data cube. Furthermore, an irradiance sensor based on Intersil ISL29004 photodetector is integrated to the camera to measure the wideband irradiance during each exposure. (Mäkynen et al., 2011; Saari et al., 2011; Honkavaara et al., 2012; 2013)
A Samsung NX300 RGB camera is used to collect high spatial resolution stereoscopic data. This is expected to improve the orientation quality and to provide high density geometric object models. The camera has a 23.5 x 15.7 mm CMOS sensor with 20.3 megapixels, and a 16 mm lens.
Ocean Optics USB2000+ spectrometer (OOU2000) measures point-wise hemispherical spectral radiance in the range of 350-1000 nm in the passive domain and weighs 190 g. It has cosine collector optics for irradiance measurement. Optical fiber is used for flexible positioning of the optics and spectrometer. OOU2000 is used to measure irradiance on board UAV to transform the FPI camera radiance measurements to at sensor bidirectional reflectance factor (BRF) information.
For the georeferencing purposes, the UAS is equipped with single frequency NVS (NV08C-CSM) GPS receiver. It works with both GPS and GLONASS and GALILEO and BeiDou is fully supported. GPS is used to measure carrier phase raw measurement data.
2.2 Data processing
Typically hundreds of small-format UAV images are collected to cover the area of interest. Rigorous processing is required in order to derive quantitative information from the imagery. The FGI processing line contains the following steps (more details are given by Mäkynen et al., 2011; Hakala et al., 2013, 2014; Honkavaara et al., 2013; Markelin et al., 2014 and in the following sections).
1) System corrections of the FPI-images using laboratory calibrations, spectral smile correction and dark signal corrections.
2) Matching all FPI bands to reference band(s) in order to eliminate spatial displacement of the bands in the spectral data cube.
3) Determination of image orientations using GPS measurement, automatic image matching and ground control points if available (Section 2.2.1).
4) Dense matching methods are used to create 3D object geometric model that is required to calculate the relationship between images and the object (Section 2.2.1).
5) A radiometric imaging model is used to transform the DNs to reflectance (Section 2.2.2).
6) Calculating the reflectance output products: spectral image mosaics and bidirectional reflectance factor (BRF) data.
2.2.1 Geometric processing. In the previous investigations
we have used VisualSFM or interactive measurement to provide approximate orientations, followed by BAE Systems SocetSet to calculate the final orientations based on self-calibrating bundle block. The GNSS data from the autopilot GPS and ground control points have been used to provide georeferencing. (Honkavaara et al., 2013; Markelin et al., 2014)
In this study, we used RTK GPS solution based on single frequency phase observations. This information is expected to be much more accurate (10 cm) than the autopilot position observations (1-2 m), and thus feasible to be used in the autonomous mode. Position and velocity of the UAS are calculated in post-processing using open-source software RTKLib (ver 2.4.2). First GPS receiver’s raw data is converted to RINEX NAV (GNSS navigation messages) and RINEX OBS (observation data) with 100 Hz. Next is used Geotrim’s GPS station network to generated virtual reference station (VRS) with 10 Hz (www.geotrim.fi). Using RTKPOST tool, reference station data is interpolated to 100 Hz and then used to post-process the receivers data.
Each spectral channel is separated of the cube and converted to own images using Erdas Imagine software. Time is calculated from the cube information for each image and using custom based code post-processed GPS data is used to interpolate position and velocity information for each image.
Preliminary trajectory of the FPI camera is calculated by infusing the built in GPS receiver of the camera and NVS GPS receiver data. By knowing the exact time of a beginning of a data cube and exact time delay between cube layers we are able to receive a coordinate value for each layer of the cube. The International Archives of the Photogrammetry, Remote Sensing and Spatial Information Sciences, Volume XL-1, 2014
2.2.2 Radiometric processing. Objectives of the radiometric
processing are to eliminate all the sensor, illumination, atmosphere and object induced disturbances from the image radiometry. Important sensor related disturbances are the instability of the shutter and possible inaccuracy of the sensor calibration. Potential challenges in illumination include instability of illumination conditions due to changes in atmospheric content. The desired output is the real reflectance characteristics of the object, i.e. the bidirectional reflectance distribution (BRDF) information or nadir normalized reflectance.
In our previous studies the FPI camera was not calibrated to radiance, so it has not been possible to use the physically based radiometric correction methods. Reflectance reference panels have been used to transform the DNs to reflectance. If the illumination and sensor are stable, the atmospheric correction process is simpler, and single measurement of atmospheric conditions is sufficient in short campaigns. If sensor stability is poor, a multiple reference is needed or image based empirical correction has to be calculated (radiometric block adjustment). If the illumination is unstable, image based empirical correction is used or irradiance measurements during each exposure or multiple reference targets are needed. In our previous studies, the relative differences between images have been compensated for by using reflectance panels in each image (Honkavaara et al., 2014), UAV wideband irradiance measurements (Hakala et al., 2013), ground based spectral irradiance observations (Hakala et al., 2013) and/or radiometric block adjustment (Honkavaara et al., 2013, Hakala et al., 2014). Processing has been performed either with or without radiometric block adjustment mode (Honkavaara et al., 2013).
In this investigation we have implemented a method that uses UAV based spectral irradiance measurement and calibrated spectral images to provide the reflectance data. The reflectance is calculated separately for each image band as the quotient on the reflected radiance (image pixel values) and the irradiance (onboard irradiance sensor measurements). The method provides approximately the bi-directional at-sensor reflectance when imaging in the direct sunshine and hemispherical directional reflectance when imaging below clouds (Schaepman-Strub et al, 2006). This is a feasible method to provide reflectance information if the camera and irradiance sensor are accurate. The measure could be improved by more accurate modelling of the diffuse illumination. Challenge in the UAV based irradiance measurement is the tilting and turns of the platform, which impact the measured irradiance signal. We are using a cosine correction based on the tilt information provided by the autopilot, in order to compensate for the impacts of tilts on the measured signal.
3. EXPERIMENTS
The objective in the campaign was to study the applicability of a measurement tactic, where small UAV image blocks are used to provide in situ data for the national forest inventory purposes. To be cost efficient, the requirement is to collect data of a large number of test areas during a single day. Installation of geometric and radiometric reference targets in this kind of application is extremely laborious. Important parameters to be estimated using the data include the tree species (dominance), volume and density of the growing stock, amount of biomass and dimension (height and diameter) of the trees. Further parameters of interest are the health (or damages) and
georeferencing is required in order to generate accurate canopy height models; accurate radiometric correction is essential in order to derive the tree species and health information.
The method was testedin the Vesijako research forest area that is used (since 1922) by The Finnish Forest Research Institute (Metla) for silvicultural and forest management experiments. The research forest is located in the municipality of Padasjoki in southern Finland (approx. 61º 23’ lat. and 25º 03’ long.). A total of 12 test sites dominated by various tree species (Scots pine, Norway spruce, silver birch and Siberian larch) and representing various developmental stages from young to mature forest were selected in the area. Each test site covered 2 – 6 experimental plots of the size 1000 - 2000 m2 representing differing silvicultural treatments with buffer areas between the experiment plots. The test sites were selected so that they were located close to road in order to allow efficient procedures. Corners of each of the test sites were signalled to provide check points for geometric quality. For each of the areas, reflectance reference targets were installed in the road nearby to provide reflectance reference.
Figure 2. Vesijako test site. Numbers indicate 12 reference sites (red line indicates the airspace reservation area).
UAS flights were carried out in 25-26.6.2014. The flying height of 100 m (above ground level) provided a GSD of 10 cm for the FPI images and 3 cm for the Samsung images on ground level. The forward overlap was for the FPI 75% and the side overlap was 65%; the flight speed was 5 m/s. The spectral settings of the FPI camera are given in Table 1. The illumination conditions were highly variable during the campaigns. In this investigation we considered one of the ten separate flights that were flown under cloud cover.
Table 1. Spectral settings for the FPI camera.
Central wavelength (nm): 516.50, 522.30, 525.90, 526.80, 538.20, 539.20, 548.90, 550.60, 561.60, 568.30, 592.20, 607.50, 613.40, 626.30, 699.00, 699.90, 706.20, 712.00, 712.40, 725.80, 755.60, 772.80, 793.80, 813.90
FWHM (nm): 10.00, 8.00, 11.00, 9.00, 12.00, 10.00, 9.00, 12.00, 8.00, 16.00, 11.00, 14.00, 15.00, 15.00, 9.00, 15.00, 14.00, 11.00, 14.00, 11.00, 14.00, 16.00, 15.00, 15.00 The International Archives of the Photogrammetry, Remote Sensing and Spatial Information Sciences, Volume XL-1, 2014
4. RESULTS AND DISCUSSION
4.1 Geometric processing
The RTK GPS trajectory was processed with a 10 Hz frequency using the virtual reference station generated in the area using the Geotrim GNSS station network (www.geotrim.fi). The image centres for images of three FPI data cube reference bands were interpolated from the trajectory. Aerial triangulation was calculated for the FPI and RGB images using the Smart3DCapture software. FPI and RGB images were processed simultaneously in one block that was georeferenced by the FPI image locations. Orientations of all the FPI bands were then interpolated from the photogrammetrically improved trajectory. Median reprojection error of the RGB FPI block was 0.45 image pixels. The 3D TIN model of the forest is shown in Figure 3. The geometric object model was internally consistent and accurate but the absolute georeferencing was not quite accurate. We expect that the absolute accuracy can be enhanced by improving the quality of the sensor calibration and by using the GPS trajectory more rigorously in the bundle block adjustment.
Figure 3. 3D TIN model of the area.
4.2 Reflectance data
Examples of the UAV irradiance observations are shown in Figures 4 and 5. As the flight was carried out under a cloud cover, the irradiance measurements were quite stable in different flying directions; the use of cosine correction to eliminate tilts of irradiance sensor made the results poorer. In this study we thus used the irradiance data without cosine correction.
Figure 4. Average irradiance [mW/cm2/nm] for a set of images.
Figure 5. Irradiance spectrum for a single point.
An example of the radiance of a tree top in one FPI-image, and the spectral irradiance measurement by USB2000+ during the exposure are shown in Figure 6. The derived at-sensor reflectance in Figure 6c is consistent with expected canopy reflectance. Reflectance of band 29 centered at 764 nm was distorted; this peak is visible also in individual irradiance spectrum measurement (Figure 6b) and similar for the all the collected images. Eliminating this observation provides consistent reflectance signature.
a)
b)
0.00 5.00 10.00 15.00 20.00 25.00 30.00 35.00 40.00 45.00 50.00
500 600 700 800 900 Wavelength (nm)
radiance [uW/(cm2.nm.sr)] irradiance [uW/(cm^2 nm)]
c)
0 0.1 0.2 0.3 0.4 0.5 0.6 0.7 0.8 0.9 1
500 600 700 800 900 Wavelength (nm)
tree tree-edited Reflectance
Figure 6. An example of reflectance measurement on a tree top. a) RGB and FPI image (l0=764 nm). b) Tree top radiance spectrum and the irradiance spectrum during the exposure. c)
Reflectance of the tree top; tree: full spectra; tree-edited: without the problematic observation at l0=764 nm. The International Archives of the Photogrammetry, Remote Sensing and Spatial Information Sciences, Volume XL-1, 2014
There are many uncertainties in this measurement process that contribute to the uncertainty of the reflectance measurement. The estimated reflectance is at-sensor reflectance, and does not take into account the diffuse radiance at the object, but when flying at low altitudes, it is expected that it corresponds quite well the reflectance at tree top. The UAV tilt correction method of the irradiance measurements has to be further improved. Also the calibration quality of individual system components has to be studied. In the following processing it is still necessary to take into account the BRDF effects and shadows. In the future we will investigate the integration of the irradiance measurements to the radiometric block adjustment method (Honkavaara et al., 2013).
5. CONCLUSIONS
We demonstrated the concept of autonomous hyperspectral UAS photogrammetry in the data collection process for a forest inventory application. Ultimately, the method does not require any ground reference targets, and by this way enable highly efficient data collection procedure. The data processing was carried out in a post-processing mode. Outputs of the process are hyperspectral point clouds that can be used as the initial information in different remote sensing applications. Our results were promising, but in the future the uncertainty components should be further evaluated.
ACKNOWLEDGEMENT
Study has been partly funded by Finnish Innovation agency Tekes, project HSI-Stereo.
REFERENCES
Hakala, T., Honkavaara, E., Saari, H.; Mäkynen, J., Kaivosoja, J., Pesonen, L., Pölönen, I, 2013. Spectral imaging from UAVs under varying illumination conditions. Int. Arch. Photogramm. Remote Sens. Spat. Infor. Sci. 2013, XL-1/W2, 189–194. Hakala T., Honkavaara E., Markelin L., 2014. Hemispherical Directional Reflectance Factor using UAV and a hyperspectral camera, validation and crop field test. SPIE remote sensing 2014.
Honkavaara, E., Markelin, L., Hakala, T., Peltoniemi, J., 2014. The Metrology of Directional, Spectral Reflectance Factor Measurements Based on Area Format Imaging by UAVs, PFG 2014 / 3, 0185–0198.
Honkavaara, E., Saari, H., Kaivosoja, J., Pölönen, I., Hakala, T., Litkey, P., Mäkynen, J., Pesonen, L., 2013. Processing and Assessment of Spectrometric, Stereoscopic Imagery Collected Using a Lightweight UAV Spectral Camera for Precision Agriculture. Remote Sens. 2013, 5, 5006-5039.
Hruska, R., Mitchell, J., Anderson, M., Glenn, N.F., 2012. Radiometric and geometric analysis of hyperspectral imagery acquired from an unmanned aerial vehicle. – Remote Sensing 4 (9): 2736–2752.
Markelin, L., Honkavaara, E., Näsi, R., Nurminen, K., Hakala, T., 2014. Geometric processing workflow for vertical and oblique hyperspectral frame image mosaics collected using UAV. The International Archives of the Photogrammetry, Remote Sensing and Spatial Information Sciences, Volume XL-3, 2014.
Mäkynen, J., Holmlund, C., Saari, H., Ojala, K., Antila, T., 2011. Unmanned aerial vehicle (UAV) operated megapixel spectral camera, Proc. SPIE 8186B.
Saari, H., Pellikka, I., Pesonen, L., Tuominen, S., Heikkilä, J., Holmlund, C., Mäkynen, J., Ojala, K., Antila, T., 2011. Unmanned Aerial Vehicle (UAV) operated spectral camera system for forest and agriculture applications, Proc. SPIE 8174. Schaepman-Strub, G., Schaepman M.E., Painter, T.H., Dangel, S., Martonchik, J.V, 2006. Reflectance quantities in optical remote sensing—definitions and case studies, Remote Sensing of Environment 103 (1), 27–42.

![Figure 4. Average irradiance [ mW/cm2/nm] for a set of images.](https://thumb-ap.123doks.com/thumbv2/123dok/3258352.1399525/4.595.101.245.593.708/figure-average-irradiance-mw-cm-nm-set-images.webp)
