KINECT FUSION IMPROVEMENT USING DEPTH CAMERA CALIBRATION
D. Pagliari a, F. Menna b, R. Roncella c, F. Remondino b, L. Pinto a
a
DICA, Politecnico di Milano, Piazza Leonardo da Vinci 32, Milano, Italy - (diana.pagliari, livio.pinto)@polimi.it
b
3D Optical Metrology (3DOM) unit, Bruno Kessler Foundation (FBK), via Sommarive 18, Povo (Trento), Italy (fmenna, remondino)@fbk.eu, http://3dom.fbk.eu
c DICATeA, University of Parma, Parco Area delle Scienze 181/A, Parma - [email protected]
Commission V, WG 3
KEY WORDS: Calibration, Depth Map, Kinect, 3D modelling, Fusion Libraries
ABSTRACT:
Scene’s 3D modelling, gesture recognition and motion tracking are fields in rapid and continuous development which have caused growing demand on interactivity in video-game and e-entertainment market. Starting from the idea of creating a sensor that allows users to play without having to hold any remote controller, the Microsoft Kinect device was created. The Kinect has always attract researchers in different fields, from robotics to Computer Vision (CV) and biomedical engineering as well as third-party communities that have released several Software Development Kit (SDK) versions for Kinect in order to use it not only as a game device but as measurement system. Microsoft Kinect Fusion control libraries (firstly released in March 2013) allow using the device as a 3D scanning and produce meshed polygonal of a static scene just moving the Kinect around. A drawback of this sensor is the geometric quality of the delivered data and the low repeatability. For this reason the authors carried out some investigation in order to evaluate the accuracy and repeatability of the depth measured delivered by the Kinect. The paper will present a throughout calibration analysis of the Kinect imaging sensor, with the aim of establishing the accuracy and precision of the delivered information: a straightforward calibration of the depth sensor in presented and then the 3D data are correct accordingly. Integrating the depth correction algorithm and correcting the IR camera interior and exterior orientation parameters, the Fusion Libraries are corrected and a new reconstruction software is created to produce more accurate models.
1. INTRODUCTION
Scene’s 3D modelling and motion tracking are sectors in continuous and quickly development. The videogames industry has been characterized by a recent boost in the field of gesture recognition, in order to allow users to have more immersive and funny game experience. Starting from the idea of creating a sensor that allows users to play without holding any controller, Microsoft Corporation launched the Kinect sensor in 2010. The Kinect sensor has always attracted research from different fields - from robotics (El-Iaithy et al, 2012, Oliver et al, 2012) to Computer Vision (Han et al., 2013), from biomedical engineering (Alnowami et al, 2012, Guevara et al, 2013) to archaeology (Richards-Rissetto et al., 2012) - due to its 3D capabilities and low-cost. In a short while Software Development Kit (SDK) realized by third-party communities have been released enabling to use the device not only as a game device, but also as a measurement device (Khoshelham, 2011; Menna et al., 2011; Mankhoff et al., 2012; Chow and Lichti, 2013). In June 2011, Microsoft released its official control libraries and SDK for full body motion capture, facial and vocal recognition. The most recent Fusion Libraries (firstly released in March 2013) allow to use the device as a low-cost scanning sensor and to quickly produce polygonal/meshed 3D models just moving the Kinect around the scene.
A drawback of this sensor is the geometric quality of the delivered 3D data and the low repeatability: for example, if one compares different subsequent frames acquired without moving the Kinect, it is frequent to have different measurements corresponding to the same pixel or even no-data information at all.
Following these open research issues, the paper evaluates the accuracy and repeatability of the depth maps delivered by the Kinect sensor as well as the strength and weakness of Kinect
Fusion Libraries (section 3.1). The article presents firstly a thorough calibration and a performance analysis of the Kinect imaging sensors, with the aim to evaluate accuracy and precision of the acquired information. Then a straightforward calibration procedure of the depth images is performed to estimate the error committed by the sensor as a function of the distance between the system and the object. The delivered 3D data are corrected accordingly, as well as the Infrared (IR) camera interior and exterior orientation. Finally a new reconstruction software that integrates and correct the Fusion Libraries is created. The approach was tested in different indoor scenarios at different scales. Results are reported and commented.
2. THE KINECT SENSOR AND THE GEOMETRIC CALIBRATION OF ITS OPTICAL SENSORS 2.1 The Microsoft Kinect sensor
The Kinect sensor is an active 3D camera developed by Microsoft and the Israeli company PrimeSense. It was firstly launched on the market on November 2011 as a remotely control device for the Microsoft platform Xbox360. Unlike other human-based control device lunched by other firm (see for examples, Wii Remote Control by Nintendo or PlayStation Move by Sony) in this case the user can play and completely control the console without having to hold any kind of device, but only with the use of voice and gesture. The success of the device is continuously supported by the release of official and third party libraries and SDKs that still attract researcher from different fields. The Kinect is a low-cost sensor that allows the real-time measurement of depth information (by triangulation with Light Coding technology) and the acquisition of RGB
images at a frame rate up to 30 fps. It is composed by an RGB camera, an IR camera, an IR-based projector, a microphone array, a tilt motor and a 3-axis accelerometer.
In February 2012, the Kinect for Windows version was launched. Nowadays the SDK is officially released only for this version of the Kinect, but it can be easily used also with the Xbox360 one. The main difference between the two devices is their operative measurement range: the Kinect for Windows is capable of measure from 0.35 to 4 meters. The Xbox360 version instead required a minimum distance of 0.80 meters between the sensor and the measured object. During the test here presented the Kinect for Xbox360 was used, so all the data were acquired from the minimum distance of 0.80 meters. Both sensor versions need external power supply when connected to the Personal Computer (PC).
It is imminent the release of a new generation of Kinect sensors based on the Time-of-Flight (ToF) measurement principle.
2.2 RGB an IR camera calibration
The RGB camera is an Aptina MT9M112 CMOS sensor with a maximum resolution of 1280x1024 pixel. A specific graphic user interface (GUI) was coded to control the sensor and show the video stream on the computer’s display and grab single video frames. So it is possible to rotate and translate the sensor in the correct position and acquire only the desired frames for the calibration procedure.
The same procedure was followed to calibrate the IR sensor, an Aptina MT9M001 CMOS sensor. In this case the IR projector was covered with the aim to avoid interference between the projected speckle pattern and the camera calibration target recognition tool.
For the geometric calibration of the two sensors, a standard photogrammetric bundle adjustment is used. The estimated IO (Interior Orientation) parameters are reported in Table 1.
Camera name
Kinect RGB Camera Kinect IR Camera Imaging sensor
Type Aptina MT9M112 CMOS Aptina MT9M001 CMOS
Resolution [px] 1280 x 1024 1280 x 1024
Pixel size [px] 2.8 m 5.2 m
Interior parameters
Value St. Dev Value St. Dev
Focal length [mm] 3.099 2.0e-3 6.497 3.0e-3
Format wide [mm] 3.58 6.66
Format height [mm] 2.87 5.32
Image wide [px] 640 640
Image height [px] 480 480
Principal Point x [mm] -0.040 9.2e-04 -0.005 2.0e-3
Principal Point y[mm] -0.020 1.0e-03 -0.004 3.0e-3
Additional parameters
K1 -1.366e-003 9.1e-05 1.795e-003 4.3e-05
K2 7.857e-004 1.7e-05 -8.337e-005 2.5e-06
P1 -1.518e-004 2.9e-05 -1.835e-004 2.1e-05
P2 -9.514e-004 3.2e-05 2.538e-004 2.2e-05
Table 1. Sensors and interior orientation parameters of RGB and IR cameras estimated during the camera calibration procedure.
2.3 Image sensors data analysis
In order to evaluate the precision of the Kinect, the different data acquired by the Kinect sensors (RGB, IR images and the raw depth measurements) were statistically analysed. To this end 100 subsequent images were captured. The image frame rate used was 30 fps, so it is possible to assume no environmental changes (i.e. illumination changes) during the time the test was realized. Although the sensors resolution is equal to 1280x1024 all the data were saved as 640x480 images. Microsoft libraries allow to acquire data from the IR camera
only with a lower resolution so, in order to have data fully comparable, also the RGB data were acquired with the same resolution of the IR camera.
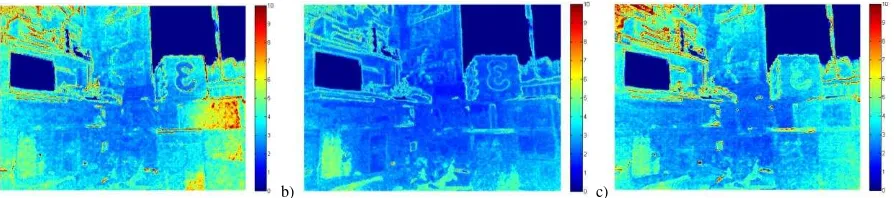
A statistical treatment of the repeated measurements was performed: for each corresponding pixel the average value and the standard deviation were computed. For the RGB images the analysis was realized separating the three image channels. Figure 1 shows the colour maps representing the standard deviations in a 8bit colour depth scale (256 tonal values).
a) b) c)
Figure 1. Standard deviation computed among 100 subsequent frames for each corresponding pixel for each channel (a-red channel, b-green channel, c-blue channel). The colour scale corresponds to differences of pixel values.
It is quite evident a certain level of variation of the intensity value registered, especially in correspondence of the object boundaries. It is also interesting to notice how the green channel is characterized by lower variations, maybe because the elements sensitive to green light are, in the Bayer scheme, double of those sensible to blue or red light.
The same analysis was performed also for the IR images (see Figure 2). It is worth to notice that the larger standard deviations are probably due to the data stored at 16 bit (65536 tonal values). By analysing the value of a pixel selected near the image centre over a sequence of 100 subsequent frames (see Figure 3) a systematic trend is not visible and a moderate noise is observed.
Figure 2. Standard deviation computed for each corresponding pixel for 100 subsequent IR images. The colour scale corresponds to
differences of pixel values.
Figure 3. Value of a pixel (coded in 16 bits) acquired near the image center of the IR camera during the test
The Microsoft SDK allows accessing also the raw depth data measured by the Kinect sensor (expressed in mm, with a nominal resolution of 1 mm), but to our knowledge it is not possible to perform image matching with the speckle pattern data because the projected pattern is not known. As previously done for RGB and IR image, the mean and the standard deviations of each correspondent pixel on the different frames were computed: as the sensors delivered data equal to zero when it is not able to perform any measurement at all, null values were removed from the computation.
In Figure 4 the standard deviation colour map created from the depth measurements is shown. The object boundaries are not well defined and some vertical bands are also present within the map as already reported in previous works (Menna et al, 2011; Chow and Lichti, 2013).
Figure 4. Standard deviation [mm] computed for each corresponding pixel of the raw depth data acquired by the IR camera.
2.4 Depth measurement accuracy
The Kinect depth camera is able to collect data in the range 0.80-4.00 meters, but as the baseline between the IR camera and the IR pattern projector is very short (around 7.4 cm) it is important to quantify the error committed by the measurement system when the distance between the sensor and the object increases. For this reason a straightforward calibration procedure was performed estimating the error committed by the sensor as a function of the distance to the object. During the tests, the sensor was located at known distances from a reference plane and progressively moved away from the wall chosen as a reference plane (from 0.80 to 4.00 meters with regular step). The distances were measured with a laser distance meter at the two sensor extremities, in order to limit some possible rotation effect. For each sensor position, 100 depth maps were acquired, storing the data in 16 bit images, thus allowing a discretization equal to the sensor resolution (1 mm). As the procedure described above does not give information on how the error spreads out over the entire image format, the analysis was extended to the whole depth map opportunely transformed in point cloud. A least squares fitting plane was computed on the point clouds of the flat wall registered at the different distances. Residuals between each point cloud and the corresponding plane were computed.
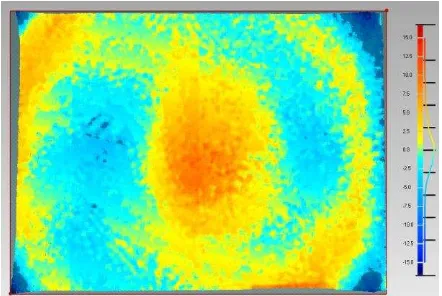
Figure 5 shows a colour map of the residuals from the least squares plane computed at a distance of 0.8 meters. The depth map was obtained considering 100 acquisitions (with the sensor fixed at a distance equal to 0.80 meters) and computing the average value for each corresponding pixel. Important systematic radial effects are quite evident especially toward the corners of the sensed area, as known from the literature. The behaviour is very similar also for the other planes measured at larger distances. These errors show that a simple correction computed as difference between a reference measured value and the one delivered by the Kinect would be correct only locally. On the contrary a better procedure of depth map calibration may consist in using the residuals from the plane as corrections (with inverted signs) for each pixel of the depth map. The corrections should be computed for different reference planes at different distances and stored in form of a multi-dimensional matrix. Then for a given depth value delivered from the Kinect, a correction may be linearly interpolated between the corresponding values of the closest planes. This procedure was tested in laboratory and gave promising results in terms of improvements of the depth map accuracy. At the same time it resulted too time consuming and therefore, considering that the
most common application of the Kinect sensor are for visualization purposes, a simpler method was found and is exposed hereafter.
Figure 5. Residuals of a depth map of a planar surface with respect to the interpolating plane
By observing the histogram of residuals and the colour map in the center of the sensor format (Figure 5), the residuals are normally distributed around zero with a standard deviation approximately of 2.5-3 mm that is very close to the expected theoretical precision of the Kinect (Menna et al., 2011). At the corners instead, systematic errors are significantly larger probably due to an inappropriate modelling of optical distortions. For this reason a less rigorous procedure but faster and simpler to be implemented consisted in discarding the depth map values with a radial distance larger than 300 pixel from the center. While the Kinect was moved, new objects such as the floor appeared in the images. Therefore, the statistical analysis was conducted selecting a region equal to 100x100 pixel, located as centred as possible and corresponding only to the wall chosen as the reference plane. A portion of the images as centred as possible was used as there are some important border effect that must be tacked into account if one want to create point clouds or models using the frame in all its extension. For each acquisition step the average and the standard deviation of each corresponding pixel in the patch selected on the 100 images registered was compute, as well as the distance from the interpolating plane calculated applying the least square method. Considering the distances with respect to the interpolating plane, any possible residual rotation effect existent between the sensor and the surface was removed. The deviation of the data delivered by the Kinect from a flat surface perpendicular to the sensor itself was also evaluated. Following this procedure, a system integrates and merges consecutive depth data, assuming that the relative position between the sensor and the object changes over time, reconstructing a final single dense surface 3D model (Izadi et al, 2011; Newcombe et al., 2011). The depth data registered by the Kinect, usually provide a low quality 3D model. Being the resolution of the incoming depth map limited to 1 mm and being the coded light approach not always robust
enough to provide high level of completeness in the reconstructed scene, the 3D model extracted from a single acquisition is usually stepped and with missing parts. Moreover, as discussed in section 2.2, the data registered by the sensor are normally very noisy.
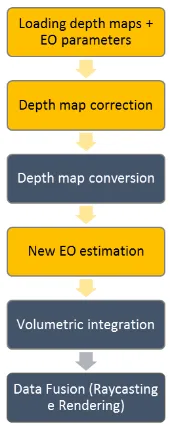
Due to commercial reasons, the Kinect Fusion algorithms (and its source code) are not available to the developer community. Nonetheless, Microsoft documentation, regarding the libraries workflow, is pretty explanatory: at first the raw depth image coming from the sensor is converted and integrated with point-wise surface normal information. Using some sort of iterative alignment algorithm, probably similar to an Iterative Closest Point (ICP) procedure, the Sensor-to-World (S2W) transformation is computed. Assuming the sensor changes its position over time acquiring a scene from different viewpoints, the Fusion Libraries computes the instantaneous sensor poses (locations and orientations). Then the aligned depth maps are merged together using a sort of 3D running average. Finally the reconstruction volume can be exported as a triangulated mesh or raycasted from a (virtual) sensor pose to be visualized. The whole workflow is summarized (in dark blue colour) in Figure 6.
3.2 Our software implementation
After some preliminary tests in laboratory, it was clear that the exterior orientation parameters estimated by the Kinect Fusion camera tracking module are affected by not negligible errors. The camera poses, registered when the sensor reconstructs an object rotating on a turning table for multiple turns, does not describes a single circle. Moreover the sensor is not stable in its measurement and a systematic error in depth measurement is committed. Therefore, starting from the Kinect Fusion libraries, a new software was created in order to correct each frame according to the calibration results previously obtained and to enforce the camera poses.
The implemented procedure is characterized by two main steps: a first phase (Figure 6), where only the raw depth data and the corresponding Exterior Orientation (EO) parameters, estimated by the Fusion ICP procedure, are stored. In a second stage (Figure 7), the orientation parameters of each depth frame are corrected by imposing some constraints. The procedure supposes that the acquisition is performed moving the object using a turning table: in this way the relative object-sensor motion is represented by a circular trajectory. Then all the Fusion-evaluated sensor EOs are loaded to estimates a best fit circular trajectory. During the acquisition, subsequent Sensor-to-Object space transformations coming from the ICP procedure accumulate errors that produce drift phenomena in the estimated trajectory. For this reason the optimal circular sensor path procedures produce identical results, and estimating the circle that best fits all the sensor positions is much simpler and, above all, much faster. Every frame position are consequently corrected imposing that the sensor centre must lay on the estimated trajectory: unless an angular displacement is provided for each frame, this means that the sensor centres are projected directly on the estimated circle. With this constraint the sensor pose cannot be corrected.
Figure 6. Modified (green box) Kinect Fusion pipeline for the data acquisition phase.
Figure 7. Modified (yellow boxes) Kinect Fusion pipeline for the data elaboration phase.
4. EXPERIMENTS AND RESULTS 4.1 Small statue
A first test was realized to understand potentialities and weaknesses of the Fusion packages. A small statue in white matte plastic (ca 35 cm height and 20 cm wide) was used (Figure 8). The object was selected because it was already used to evaluate the performances of a Kinect device acquiring range maps with the OpenNi Libraries and then co-registering them to create a unique mesh model (Menna et al., 2011). On the other hand for the test hereafter presented, the 3D model was created directly as a mesh, using the Microsoft Fusion SDK.
The acquisition was realized by placing the statue on a turntable and the Kinect in a upper position looking downward. This strategy was used just to simplify the data acquisition. An ICP alignment with the scale factor estimation was performed in Cloud Compare between the obtained mesh model and the reference one, previously obtained with a triangulation scanner
(Next Engine). The test was repeated several times yielding to different model versions acquired by orienting the Kinect with different view angles. The average estimated scale factor was equal to 0.9744. The final standard deviation of the alignment was equal to 1.2 mm. The presence of a scale factor is probably the sum of different effects arising from the fact that the focal length of the IR camera and the baseline between the IR camera and the projector stored in the Fusion Libraries are approximate values.
Figure 8. The 3D mesh model of the statue scanned with the Next Engine (left) and one of the smooth models created in real time with the Kinect Fusion Libraries (right)
The Euclidean distances between the scaled 3D mesh model of the statue, surveyed with the Kinect sensor and the reference model are shown in Figure 9 (left). The differences are shifted toward negative values in the upper part of the statue (i.e. the hair) and to positive values around the neck. In general the difference are lower than 5 mm. This systematic error persists because the Fusion model was scaled using a medium scale factor, equal to 0.9744. Observing Figure 9 (left) it is evident how the scale factor is not uniform, but it is function of the distances. Probably this effect may be reduced using the focal length of the specific sensor in use.
For this reason, a second series of test was performed to evaluate the effect on the final mesh model modifying the interior orientation parameters. In the Microsoft SDK the focal length values (along x and y axes) are computed rescaling nominal focal length value (equal to 285.63 pixels) along the two image dimension while the position of the principal point is equal to (0.5;0.5) because the sensor is supposed of square sides equal to one. These parameters were corrected according to the ones estimated during the IR camera calibration procedure. With this modifications, the 3D model produced by the Kinect slightly improved and the obtained results, in terms of shortest distances, are shown in Figure 9.
Figure 9. 3D comparison (shortest differences) between the reference model and the Kinect Fusion mesh (left) and the Fusion model with the IO parameters correction(right).
It is evident how a correction of the IO parameters allows realizing a smooth model whose dimension are closest to reference one. Despite the improvement, some residual effects due to a non-correct estimation of the baseline length is still present. With the aim to better correct the data delivered by the Kinect a correction of the depth measurement was them performed: this is equal to estimate a different scale factor as a function of the distance between the camera and the object. With respect to the work presented in (Menna et al., 2011), the accuracy of the 3D model generated with the Kinect fusion libraries seems to be lower. This is probably due to the sequential procedure used by Fusion libraries to align the point clouds. On the other hand the model is less noisy and does not present band artifacts.
4.2 Laboratory scenario
A second series of test was carried out on a larger scene with the aim to evaluate the improvements produced by depth measurement correction. This correction was implemented for each single pixel of each depth image (using a unique correction curve) that was then effectively fused to create the mesh model. The Kinect acquires images with a frame rate up to 30 fps, but not all the measured data are used. Only when a frame is completely processed the last feature frame (under the condition that the camera pose is tracking successfully) is processed. To better appreciate the effect of the depth correction, an office corner, where the distances between the sensor and the objects were in the range 1-3 meters, was surveyed. The Kinect was held in the hands and it was translated and rotated in a small area (around 1 m2) in order to obtain a complete and smooth model of the selected scene. The reference model was created with a single scan with Leica HDS7000 (with a manufacture accuracy in average of about 2mm considering the different materials present in the scene).
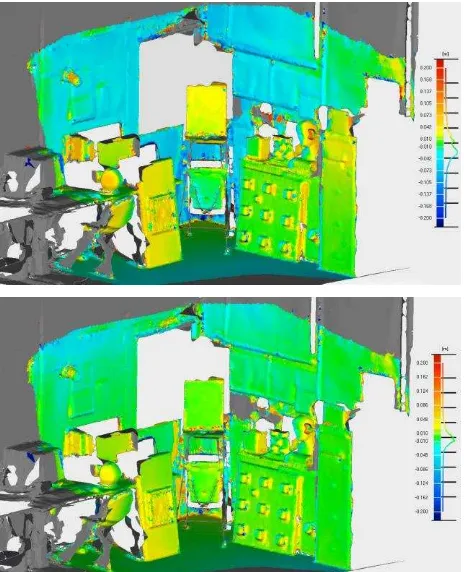
Figure 10. 3D comparison (shortest differences) between the reference model and the Kinect Fusion mesh (up) and with the mesh corrected accordingly to the depth correction (down).
In Figure 10 the differences with the reference model are shown. The effect of a depth correction is evident mainly for the objects more distant from the Kinect sensor, as it could be expected. In Figure 11 the differences between the reference model and the Kinect Fusion mesh with and without the corrections are shown. Applying the depth correction, the area of tolerance (represented in green) is wider and also the object more distant from the Kinect fall inside this area. It is clear that if one wants to use the Kinect to reconstruct wider indoor spaces (such as entire rooms) it is fundamental to perform a depth calibration and a depth correction of the delivered data before they are fused to create the final mesh model.
4.3 Lego storage bricks
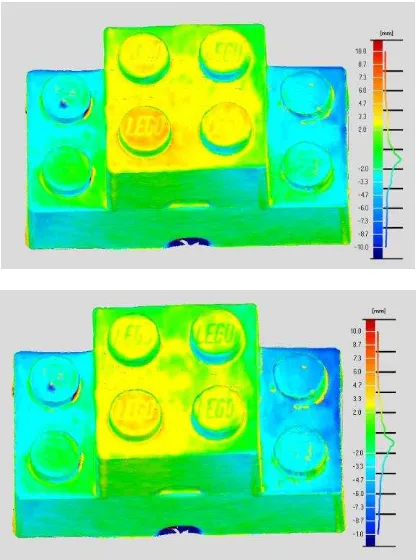
The last test was realized surveying two Lego storage bricks stuck together. A yellow storage brik-4 (25 cm x 25 cm x 19 cm) was placed central on blue 8-brick (50 cm x 25 cm x 19 cm). A reference 3D model of the bricks was surveyed with ShapeGrabber laser scanner (with a resolution of 0.5 mm). The objects were placed on a turntable and slowly rotated in front of the Kinect sensor for multiple turns. During the acquisitions, the depth map were stored with the corresponding OE camera parameters. These parameters were then corrected with the procedure presented in the previous section 3.2 (see Figure 11).
Figure 11. The Trajectory reconstruct by the EO parameters of the Fusion Libraries (blue) and the corrected trajectory (red)
In Figure 12 the differences between the Kinect models (as created by the Fusion Libraries and the corrected one) and the reference model are presented. It is notable how the green areas (geometric differences smaller than 2 mm) enlarge after the application of the EO parameters correction procedure.
5. CONCLUSIONS
The Kinect Fusion libraries, firstly released on March 2011, allow creating in real time a smooth model of an object simply by moving the Kinect around it. These libraries have been tested under several aspects in order to understand their potentialities and weaknesses, and to evaluate whether is possible to improve them. First of all, a straightforward calibration of each sensor was performed to evaluate the accuracy and precision of the Kinect sensor. From the analysis carried out it has emerged that the Kinect sensor data show some instability during subsequent acquisition and that better results can be obtained by averaging. Then the Fusion Libraries have been tested to evaluate how much precise are the smooth models that can be easily creates using the available software. The comparisons with a 3D reference model have shown that the differences are within the
Figure 12. 3D comparison (shortest differences) between the reference model and the Kinect Fusion one (up) and with the mesh corrected accordingly to the new OE parameters estimated.
range of 5 mm. It is important to underline that the delivered mesh does not require any modelling action, so the Kinect could be a very useful tool when it is necessary to quickly produce 3D not-detailed models. However, from the analysis carried out it has emerged how it is possible to obtain better results correcting both the orientation parameters (internal and external) and the depth measurements.
For this reason, starting from the Kinect Fusion SDK a new software was created, implementing within the orientation parameters and the depth measurement correction. The presented results show that it is possible to interact with the Microsoft libraries and improve them applying a more rigorous and photogrammetric approach, such as camera calibration and an estimation of the error committed by the depth camera as a function of the distance. Improvements in terms of geometric accuracy are significant and interesting in particular when the Kinect is not used just a gesture recognition device.
To our knowledge it is not possible to process directly the speckle pattern data: the first level where one can interact with the delivered data is the raw depth map. From the test carried out and previously discussed emerged how the depth data correction is the most influent in order to correct the systematic error that characterize the Kinect sensor. Furthermore, using the Fusion libraries the camera poses can be corrected imposing some constraints about the followed trajectory. During our tests the object were placed on a turntable and the results obtained with the estimation of an average circle are encouraging.
REFERENCES
Alnowami, M., Alnwaimi, B., Tahavori, F., Copland, F., Wells, K., 2012. A quantitative assessment of using the Kinect for
Xbox360 for respiratory surface motion tracking , Proc. SPIE 8316, Medical Imaging.
Chow, J. C., & Lichti, D. D. 2013. Photogrammetric Bundle Adjustment With Self-Calibration of the PrimeSense 3D Camera Technology: Microsoft Kinect. Access, IEEE, 1, 465-474.
El-Iaithy, R.A., Jidong Huang, J., Yeh, M., 2012. Study on the use of Microsoft Kinect for robotics application. Position Location and Navigation Symposium (PLANS), IEEE/ION, Vol, no., pp. 1280-1288.
Guevara, D.C., Vietri, G., Prabakar, M., Jong-Hoon Kim, 2013: Robotic Exoskeleton System Controlled by Kinect and Haptic Sensors for Physical Therapy. Biomedical Engineering Conference (SBEC), pp.71-72.
Han, J., Shao, L., Xu, D., Shotton, J., 2013: Enhanced Computer Vision with Microsoft Kinect Sensor: A Review. IEEE Transitions on Cybernetics, Vol 43(5).
Izadi, S., Kim, D., Hilliges, O., Molyneaux, D., Newcombe, R., Kohli, P., Shotton, J., Hodges, S., Freeman, D., Davison, A., Fitzgibbon, A., 2011. KinectFusion: Real-time 3D Reconstrucion and Interaction Using a Moving Depth Camera, Proc. ACM Symposium on User Interface Software and Technology (UIST’11).
Khoshelham, K., 2011. Accuracy analysis of Kinect depth data. Int. Archives of the Photogrammetry, Remote Sensing and Spatial Information Science, Vol. 38(5/W12).
Mankhoff, K. D., Russo T.A., 2012. The Kinect: a low cost, high resolution, short-range, 3D camera. Earth Surface Process and Landforms, Vol. 38(9), pp. 926-936, doi:10.1002/esp.3332.
Menna, F., Remondino, F., Battisti, R., Nocerino, E., 2011. Geometric investigation of a gaming active device, Proc. SPIE 8085, Videometrics Range Imaging and Applications XI, http://dx.doi.org/10.0.1117/12.890070.
Newcombe, R. A., Izadi, S., Hilliges, O., Molyneaux, D., Kim, D., Davison, A.J., Kohli, P., Shotton, J., Hodges, S., Fitzgibbon, A., 2011. KinectFusion: Real-Time Dense Surface Mapping and Tracking, Proc. IEEE ISMAR.
Oliver, A., Kang, S., Wunsche, B. C., MacDonald, B., 2012. Using the Kinect sensor ad a navigation sensor for mobile robotics. Proc. 27th Conference on Image and Vision Computing, pp. 509-514. doi:10.1145/2425836.2425932.
Richards-Rissetto, H., Remondino, F., Agugiaro, G., Robertsson, J., von-Schwerin, J., Girardi, G., 2012: Kinect and 3D GIS in archaeology. Proc. 18th IEEE Intern. Conference on Virtual Systems and MultiMedia (VSMM), G. Guidi / L. Addison (Eds.), pp. 331-338. Milan, Italy.