ESA EXOMARS: PRE-LAUNCH PANCAM GEOMETRIC MODELING AND
ACCURACY ASSESSMENT
D. Li a, R. Li b, A. Yilmaz a, *
a
Photogrammetric Computer Vision Laboratory, The Ohio State University, USA - (li.943, yilmaz.15)@osu.edu b
Dept. of Civil, Environ. and Geodetic Eng., The Ohio State University, USA – [email protected]
Commission VI, WG VI/4
KEY WORDS: Error Propagation, Mapping, Localization, Robotics, Triangulation, Photogrammetry
ABSTRACT:
ExoMars is the flagship mission of the European Space Agency (ESA) Aurora Programme. The mobile scientific platform, or rover, will carry a drill and a suite of instruments dedicated to exobiology and geochemistry research. As the ExoMars rover is designed to travel kilometres over the Martian surface, high-precision rover localization and topographic mapping will be critical for traverse path planning and safe planetary surface operations. For such purposes, the ExoMars rover Panoramic Camera system (PanCam) will acquire images that are processed into an imagery network providing vision information for photogrammetric algorithms to localize the rover and generate 3-D mapping products. Since the design of the ExoMars PanCam will influence localization and mapping accuracy, quantitative error analysis of the PanCam design will improve scientists’ awareness of the achievable level of accuracy, and enable the PanCam design team to optimize its design to achieve the highest possible level of localization and mapping accuracy. Based on photogrammetric principles and uncertainty propagation theory, we have developed a method to theoretically analyze how mapping and localization accuracy would be affected by various factors, such as length of stereo hard-baseline, focal length, and pixel size, etc.
* Corresponding author. This is useful to know for communication with the appropriate person in cases with more than one author. 1. INTRODUCTION
The 2018 ESA ExoMars Rover missions, planning for six months of Martian surface operations, will focus on providing contextual information to detect, locate and measure targets of potential scientific interest, localize the landing site along with other geological research (Paar, 2008). As the ExoMars rover will be expected to travel kilometers over the Martian surface, the vision component stereo PanCam system will provide data essential to mission planning and scientific analysis (Li et al., 2010). The purpose of this paper is to describe an error propagation model developed to quantitatively analyze the potential of the ExoMars PanCam system for mapping and localization.
The ExoMars PanCam system consists of a pair of identical Wide-Angle Cameras (WAC) and one High-Resolution Camera (HRC). The WAC has a larger field of view (FOV) angle i.e. 34° whereas the HRC only has a FOV of 5° (Paar et al., 2010). This can be compared with the MER mission’s Navcam 45° FOV and Pancam 16° FOV (Griffiths et al., 2006). However the HRC’s much longer focal length empowers it can ‘see’ much farther than the WAC. Provided these important characteristics, we have also studied how incorporating the HRC impacts attainable accuracy levels for mapping and localization. The attainable level of accuracy is first analyzed theoretically based on a rover traverse involving only two sites. Then, analysis is extended to a long, multiple-site traverse scenario. In the two-site rover localization model, the location of the rover at the first site is fixed. The location of the rover at the second site is determined by identification of matching features between these two sites. We assume that the only possible errors are those in the measurements of the image coordinates of the features.
Based on stereo triangulation and intersection equations, errors in the spatial coordinates of the feature points are determined from any errors in the image coordinates of the features. In this manner, we obtained measurements of features distributed between two adjacent sites as well as any measurement errors associated with the features. By considering that the rover could look backward from the second site to view these feature points, the space resection method is used to triangulate the position of the rover. As a result, feature-measurement errors were propagated to the location of the second site. Finally, applying the error propagation law, this two-site localization process can be extended to multiple sites.
We have established the relationship between the distribution of the features and the length of the traverse segment between two sites while maintaining a relative rover localization accuracy of 1%. We have also estimated the average traverse segment length while the rover maintained a 1% localization error over a 3-km-long traverse and compared the results with the practical Mars Exploration Rover (MER) mission. The average traverse segment length is around 36 meters for ExoMars rover using only the PanCam WAC system, while this value is approximate 34 meters for the MER mission using Navigation Cameras (Navcam). If incorporating of HRC to the PanCam WAC system, it is expected to be effective at a farther distance since HRC has much a longer focal length than WAC. Our results show that the improvement of the average traverse segment from the addition of HRC data is around 10%, which means that the rover can travel 10% further while maintaining the same level of localization accuracy.
This paper presents the results from a theoretically analysis of the attainable mapping and localization accuracy of the The International Archives of the Photogrammetry, Remote Sensing and Spatial Information Sciences, Volume XL-3, 2014
ExoMars PanCam system under the latest ESA specifications. The results of this analysis will facilitate the optimal design of the ExoMars PanCam system and may be used as a general guideline for field tests on Earth and mission operations on Mars. Under various changing elements such as rover, camera and environmental parameters, we establish an error propagation model to estimate how far the rover could traverse while maintaining a level of 1% localization accuracy. The results also show that the HRC can be a potential while promising data source for improving localization capabilities. Future work should include comparison of this theoretical error analysis model with the experimental results of localization and mapping accuracy from field tests on Earth.
2. METHODOLOGY
2.1 Mapping Accuracy Analysis at Single Site
Feature point measurement error is the main error source for bundle adjustment (BA) based rover localization if target identification error from different sites is not considered (Li and Di, 2005). This error can be divided into range measurement error, r, and azimuth measurement error, . A detailed
analysis of mapping accuracy was discussed in Di and Li (2007), where simplified parallax equations were used. Based on the error propagation law, range measurement error can be calculated from Equation 1 shown below, where r (range) is the distance from the object to the camera, b is the stereo baseline length, f is the focal length, and p is the parallax measurement
error (i.e., correlation/matching error):
2
Apparently the range measurement error scales quadratically with the distance from the object to the camera.
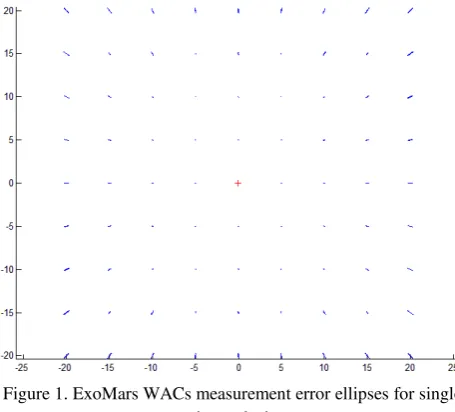
Figure 1. ExoMars WACs measurement error ellipses for single site analysis
During MER operations, we observed that the azimuthal inconsistency between adjacent stereo pairs (caused by telemetry error and by other errors such as camera calibration error) is about one pixel (Di et al., 2004). Therefore in this analysis we assume a one-pixel azimuthal error (i.e., ) is tan -1
(1pixel/f). Error ellipses for ExoMars WACs mapping accuracy are shown in Figure 1 as calculated by the co-variance matrix in Eq. 3. It is apparent that the position errors are mainly in the radial directions and are consistent with the range measurement error results described by Eq. 1. The error ellipses of MER Navcam and Pancam mapping accuracy can be calculated in a similar process.
2.2 Rover Localization across Two Sites
The methodology of utilizing feature points (landmarks) in rover localization via a bundle adjustment (BA) has been successfully used in the NASA MER 2003 mission (Li et al., 2002 and 2005). Since the BA process requires the establishment of an imagery network that integrates orbital and ground images covering the entire region of rover operations, we have simplified the process of rover localization into two consecutive procedures in order to facilitate the accuracy analysis. First, assuming the rover measures the same landmarks from two adjacent sites, we use a rigid transformation (rotation and translation) to adjust the coordinates of these two sets of observations similar to the method described in Olson et al., (2003). Based on these two sets of observations of the same landmarks, we can derive the optimized rigid transformation between them. Finally, we can apply the same optimized rigid transformation to the initial positions of the second site. Since we take into consideration of image measurement and tie-point distribution, the analytical result should be consistent with results from bundle adjustment.
The rigid transformation between the landmark observations from the adjacent sites is represented as:
1 2 2 The International Archives of the Photogrammetry, Remote Sensing and Spatial Information Sciences, Volume XL-3, 2014
where (X1, Y1)T and (X2, Y2)T are the ground coordinates of the landmarks measured from Site 1 and Site 2, respectively. Since
all of the coordinate observations have errors, we use (
)T to describe the associated observation error. Variables (a, b, c, d)T represent the unknown rigid transformation parameters to be estimated. The transformation parameters can be solved using the following general least-unknown vector. According to the error propagation principle for least-squares adjustment, the co-variance matrix of the rigid transformation parameters △ △ is calculated as:1
Applying the adjusted rigid transformation parameters to adjust the landmark measurements from Site 2, we can obtain the the landmarks measured from Site 2 is
2 _
T site tie
C
C
(9)2.3 Rover Localization at Multiple Sites
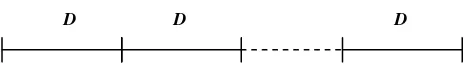
To extend the two-site rover localization to multiple sites (Figure 2), we apply the analysis results of the two-site traverse segment to propagate the errors through the traverse (Li et al.
the absolute localization error of a two segment traverse will be
m2 = √2m1 = √2kD2, and relative error mr2 = m2/2D = kD/√2 = mr1/√2. Similarly for n+1 sites (n segments), the absolute and relative localization errors are calculated as:
2
2.4 Incorporating HRC with Stereo WAC
Since the HRC has much a longer focal length than the WAC, it enables the HRC to observe the object in a great number of distances comparing with the WAC. Based on the different FOV between HRC and WAC according to PanCam system specifications, we can estimate the rough distance where the coverage of the single HRC image is closed to that of the single WAC image. Then this estimated distance can be converted to the number of traverse segments assuming that each traverse segment has the same length. In other words, the HRC at the first traverse site could be used to improve the rover localization accuracy after a certain number of traverse segments. Applying the similar feature point distance measurement accuracy analysis in section 2.1, we can estimate the improved distance measurement of feature point by incorporating HRC with either left or right WAC. Finally, the improved feature point distance would in turn to enhance the rover localization accuracy across multiple traverse segments.
3. EXPERIMENTAL RESULTS AND DISCUSSION
3.1 Localization Accuracy across Two Sites
In order to investigate the relationship between rover localization accuracy and traverse length, the distribution and total number of tie points need to be considered. From the ExoMars WACs mapping error ellipses in Figure 1, we found that the optimal location of a landmark is in the middle of the two sites. Applying this method of analysis, we also verified that the optimal location for multiple landmarks is at the centroid of the landmarks that are in the middle between the two sites. This means that in idea situation, evenly distributed landmarks produces the highest localization accuracy. By introducing the convergence angle along with the traverse length, the location of each landmark can be determined. As shown in Figure 3, we designate the distributions of 6, 9, 12 and 16 landmarks. From the figure, convergence angles are defined as an angle at either site between the beginning and end sights covering the set of tie points in the middle. If the traverse length is also known, we can easily calculate coordinates of each landmark under every scenario in Figure 3 using the principles of trigonometry.
D D D
Figure 2. Multiple-site traverses (n+1 sites, n segments). The International Archives of the Photogrammetry, Remote Sensing and Spatial Information Sciences, Volume XL-3, 2014
After we designate each landmark’s location, we can use the above-mentioned method to derive the rover localization accuracy. The first step is to calculate the optimal rigid transformation between the two sets of landmarks observed from adjacent sites; the second step is to adjust the rover location at the second site using the calculated rigid transformation in previous step. For the four scenarios in Figure 3, we first fix the traverse length between two sites (e.g., 20 m) and then change the convergence angle (e.g., from 20 degree to 130 degree). We then can calculate the relationship of the localization accuracy to the convergence angle.
As shown in Figure 4, we found that for each scenario there exists a certain range of convergence angles where the localization error is at the minimum. We define this range as the optimal convergence angle. We have also indicated the practicable range around 70 to 90 for the convergence angle based on the experiences in MER operations. Note that we use the relative localization error here, which is defined as the ratio of absolute localization error to traverse length.
Once we get the optimal convergence angle, then we can fix the optimal convergence angle and change the traverse length (e.g., from 10 m to 100 m). Similarly, we can illustrate the relative localization errors as a function of different traverse lengths (Figure 5).
We can observe that the relative error mr linearly increases with the increase of traverse length D. Taking the six landmarks as an example, further computations indicate that the relative error is mr = 0.033D. Based on this figure, we can calculate that the 1% localization error is at 30.7 m. Correspondingly, the absolute localization error m, which is then proportional to the square of the traverse length, is calculated as m = 0.033D2.
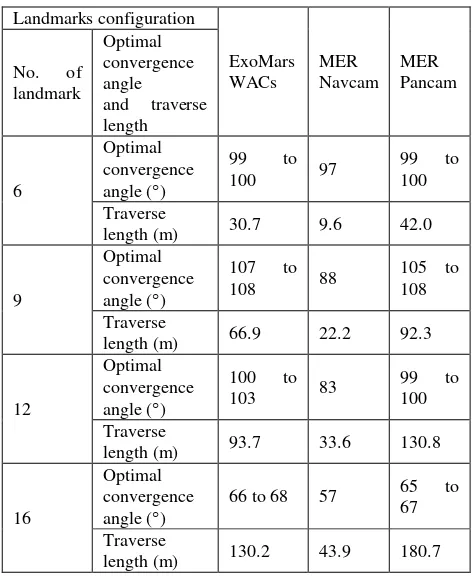
Similarly, we can generate the formulae for calculating relative and absolute localization error for the other scenarios. Table 1 lists optimal convergence angles and traverse lengths that meet the 1% error limit with different image network configurations for ExoMars WACs, MER Navcam, and MER Pancam.
Landmarks configuration
ExoMars WACs
MER Navcam
MER Pancam No. of
landmark
Optimal convergence angle and traverse length
6
Optimal convergence angle ()
99 to
100 97
99 to 100
Traverse
length (m) 30.7 9.6 42.0
9
Optimal convergence angle ()
107 to
108 88
105 to 108
Traverse
length (m) 66.9 22.2 92.3
12
Optimal convergence angle ()
100 to
103 83
99 to 100
Traverse
length (m) 93.7 33.6 130.8
16
Optimal convergence angle ()
66 to 68 57 65 to 67
Traverse
length (m) 130.2 43.9 180.7
Table 1. Landmarks configuration and rover localization accuracy.
Figure 3. Landmarks distribution patterns.
Figure 4. Relative localization error vs. convergence angle.
Figure 5. Relative localization error vs. traverse length. The International Archives of the Photogrammetry, Remote Sensing and Spatial Information Sciences, Volume XL-3, 2014
3.2 Localization Improved by Adding HRC
Assume the traverse segment is 30.7 m for adjacent sites, we can generate the following FOV analysis across several sites in the following Figure 6. The blue lines at each site represent the FOV angle of stereo WACs, and the cyan lines denote the FOV of HRC viewing from the first site. We can see the FOV coverage of HRC only occupies roughly 45 percent and 75 percent of stereo WAC at traverse site 2 and 3 respectively. However, the FOV coverage of HRC is almost the same to the WAC starting from site 4.
Figure 6. PanCam FOV analysis across multiple sites (assume the traverse segment is 30.7 m; X-Y axis have different scales)
Now we can incorporate the HRC to the stereo WAC in our analysis when the rover traverses to a distance of approximate 92 m from the site where the HRC is taken. Based on the results listed in this table and the above analysis, we can draw following conclusions for rover localization at two sites:
1. Rover localization error varies with the traverse length, tie point (landmark) number and distribution, and the camera system (stereo base, focal length, etc.).
2. In general, localization error is proportional to the square of the traverse length. In other words, the relative localization error is approximately proportional to the traverse length. Moreover, the localization error decreases as the baseline length or focal length increases.
3. With six to sixteen well-distributed tie points in the middle of two sites, the rover localization error is within 1% at a traverse of 30 m to 130 m for ExoMars PanCam stereo WAC, and this number can be increased by 10% when incorporating HRC; 9 m to 44 m for the MER Navcam; and a traverse of 42 m to 180 m for MER Pancam.
3.3 Localization Accuracy with 5-km Traverse
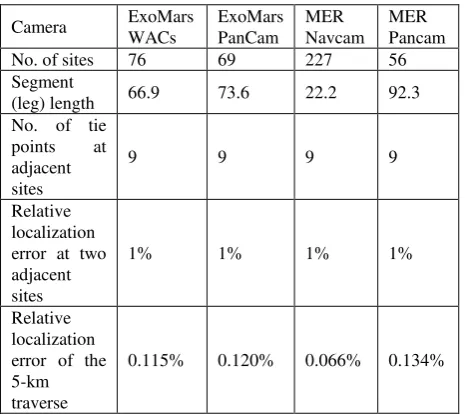
Using Eq. 10a & 10b, we evaluated the rover localization accuracy for a 5-km traverse under the constraints of nine landmarks and the localization accuracy of 1% for each traverse leg (one segment). Results of this analysis are presented in Table 2.
Camera ExoMars
WACs
ExoMars PanCam
MER Navcam
MER Pancam
No. of sites 76 69 227 56
Segment
(leg) length 66.9 73.6 22.2 92.3 No. of tie
points at adjacent sites
9 9 9 9
Relative localization error at two adjacent sites
1% 1% 1% 1%
Relative localization error of the 5-km traverse
0.115% 0.120% 0.066% 0.134%
Table 2. Multiple-site rover traverse design and error analysis for a 5-km traverse.
From the above table, we can see that if we keep an optimal configuration for each traverse segment and keep the relative localization error within the segment to within 1%, an overall relative accuracy of 0.2% can be achieved for a 5-km traverse.
In the above analysis, target identification error (from the adjacent site) was not taken into account. In general, target identification error (the maximum of which is the size of the target), is smaller than the 3-D measurement error for far- and middle-range targets. If we suppose that the localization error would be double when considering the target identification error (i.e., if the localization error were 2% at one segment) an overall localization accuracy of 0.3% could still be achievable for a 5-km traverse.
4. CONCLUSIONS
This paper presents the results from a theoretically analysis of the attainable mapping and localization accuracy of the ExoMars PanCam under the latest ESA specifications. The results of this analysis will facilitate the optimal design of the ExoMars PanCam and may be used as a general guideline for field tests on Earth and mission operations on Mars. Under various changing elements such as rover, camera and environmental parameters, we establish an error propagation model to estimate how far the rover could traverse while maintaining a level of 1% localization accuracy. Through rover traverse design and accuracy analysis, we have found that with six to sixteen well distributed landmarks evenly located in the middle of two sites, ExoMars rover localization error can be controlled within 1% over a traverse of 30 to 130 meters. This traverse segment length can be improved by approximate 10% by adding HRC to the analysis according to our analysis. Similarly, we have obtained a traverse of 9 to 44 meters for the MER Navcam, and 42 to 180 meters for the MER Pancam. If we keep an optimal configuration for each traverse segment and control the relative localization error within that segment to 1%, an overall accuracy of 0.2% to 0.3% can be achieved for a 5-km traverse. However, these results are derived from a purely theoretical analysis without consideration of obstacles in real-life applications. For example, if the onboard software cannot find a sufficient number of reliable landmarks for a long The International Archives of the Photogrammetry, Remote Sensing and Spatial Information Sciences, Volume XL-3, 2014
traverse segment, the traverse segment length should be shortened. Further research needs to be done on field experiment verification of these theoretical analysis using a PanCam prototype with similar system specifications.
REFERENCES
Di, K., and Li, R., 2004. CAHVOR camera model and its photogrammetric coversion for planetary applications. Journal of Geophysical Research-Planets. Vol.109, No.E04004 (doi: 10.1029/2003JE002199).
Di, K. and Li, R., 2007. Topographic Mapping Capability Analysis of Mars Exploration Rover 2003 Mission Imagery. In Proceedings of 5th International Symposium on Mobile Mapping Technology (MMT 2007), Padua, Italy, May 28-31, 2007, 7p.
Griffiths, Andrew D. et al., 2006. Context for the ESA ExoMars rover: The panoramic camera (PanCam) instrument, International Journal of Astrobiology, Vol. 5, No.3, pp. 269-275.
Li, R., Ma, F., Xu, F., Matthies, L.H., Olson, C.F. and Arvidson, R.E., 2002. Localization of Mars Rovers using Descent and Surface-based Image Data. Journal of Geophysical Research-Planets, Vol.107, No.E11, pp.4.1-4.8 (doi: 10.1029/2000JE001443).
Li, R., Squyres, S.W., Arvidson, R.E. et al., 2005. Initial results of rover localization and topographic mapping for the 2003 Mars Exploration Rover mission, Journal of Photogrammetric Engineering and Remote Sensing, Vol. 71, No.10, pp.1129-1142.
Li, R., and Di, K., 2005. Rover traverse design and error analysis. Technical report submitted to JPL Mars Technology Program. Mapping and GIS Laboratory, CEEGS, The Ohio State University, Columbus, OH, USA.
Li, R., Di, K., Howard, A., Matthies, L., Wang, J., and Agarwal, S., 2007. Rock Modeling and Matching for Autonomous Long-Range Mars Rover Localization. Journal of Field Robotics, Vol.24, No.3, pp.187-203.
Li, R. Wang, W., Tang, M., et al., 2010. ESA ExoMars rover localization and topographic mapping: Pre-launch PanCam modeling and error analysis, 41st Lunar and Planetary Science Conference, 1–5 March 2010, The Woodlands, Texas.
Olson, C.F., Matthies, L.H., Schoppers, M., Maimone, M.W., 2003. Rover navigation using stereo ego-motion. Journal of Robotics and Autonomous Systems, Vol.43, No.4, pp.215-229.
Paar, G. et al., 2008. ExoMars panoramic camera 3D vision: Expected quality of rover surroundings description, EGU General Assembly, 13–18 April 2008, Vienna, Austria. Paar, G., 2010. 3D Vision for Panoramic Camera of ESA
ExoMars mission 2018.
http://3dvision.joanneum.at/3DVision/projects/exomars (accessed 20 Aug. 2010)
Zhang, Z., and Zhang, J., 1997. Digital Photogrammetry. Press for Wuhan Technical University of Surveying and Mapping, Wuhan, China, pp. 171-172 (in Chinese).