CUBESAT-DERIVED DETECTION OF SEAGRASSES USING PLANET IMAGERY FOLLOWING UNMIXING-BASED DENOISING: IS SMALL THE NEXT BIG?
D. Traganos a, *, D. Cerra b, P. Reinartz b
a
German Aerospace Center (DLR), Remote Sensing Technology Institute, Rutherfordstraße 2, 12489 Berlin, Germany [email protected]
b
German Aerospace Center (DLR), Earth Observation Center (EOC), 82234 Wessling, Germany (daniele.cerra, peter.reinartz)@dlr.de
Commission WG I/8
KEY WORDS: Mediterranean seagrass, Posidonia oceanica, Planet, CubeSats, Unmixing-based denoising, Depth-invariant index, Support Vector Machines
ABSTRACT:
Seagrasses are one of the most productive and widespread yet threatened coastal ecosystems on Earth. Despite their importance, they are declining due to various threats, which are mainly anthropogenic. Lack of data on their distribution hinders any effort to rectify this decline through effective detection, mapping and monitoring. Remote sensing can mitigate this data gap by allowing retrospective quantitative assessment of seagrass beds over large and remote areas. In this paper, we evaluate the quantitative application of Planet high resolution imagery for the detection of seagrasses in the Thermaikos Gulf, NW Aegean Sea, Greece. The low Signal-to-noise Ratio (SNR), which characterizes spectral bands at shorter wavelengths, prompts the application of the Unmixing-based denoising (UBD) as a pre-processing step for seagrass detection. A total of 15 spectral-temporal patterns is extracted from a Planet image time series to restore the corrupted blue and green band in the processed Planet image. Subsequently, we implement Lyzenga’s empirical water column correction and Support Vector Machines (SVM) to evaluate quantitative benefits of denoising. Denoising aids detection of Posidonia oceanica seagrass species by increasing its producer and user accuracy by 31.7% and 10.4%, correspondingly, with a respective increase in its Kappa value from 0.3 to 0.48. In the near future, our objective is to improve accuracies in seagrass detection by applying more sophisticated, analytical water column correction algorithms to Planet imagery, developing time- and cost-effective monitoring of seagrass distribution that will enable in turn the effective management and conservation of these highly valuable and productive ecosystems.
* Corresponding author
1. INTRODUCTION
Seagrasses are one of the most productive and widespread yet threatened coastal ecosystems on the planet. They are marine flowering plants that form extensive, submerged meadows at less than 50m of depth as they rely on light to grow through photosynthesis. Seagrass ecosystems provide a plethora of ecosystem services of high economic value (Costanza et al., 1997) including sequestration of carbon (Fourqurean et al., 2012), nursery grounds for marine species (Boström and Bonsdorff, 1997), buffering from coastal erosion (Ward et al., 1984) and amelioration of seawater pollution (Lamb et al., 2017). Despite their importance, these valuable habitats face a decline of their extent due to various threats, which are mainly anthropogenic (Telesca et al., 2015). Lack of data on their distribution hinders any effort to rectify this decline through effective detection, mapping and monitoring.
Remote sensing can mitigate this data gap by allowing retrospective quantitative assessment of seagrass beds over large areas and in remote locations in a time- and cost-effective fashion. Recent advances in remote sensing technology are expected to increase the spatial, temporal and spectral resolution of Earth observation. Part of this increasing trend in the development of spaceborne sensors is CubeSats (National Academies of Sciences, Engineering and Medicine, 2016). CubeSats are small satellites whose size is expressed in increments of 10 cm cubes, such that 1 cube is 1U or “unit”, 2
cubes are 2U (two 10 cm cubes together) etc. Earth observation scientists have barely assessed the potential of these shoebox-sized satellites in terms of lower-cost, but faster science return (National Academies of Sciences, Engineering and Medicine, 2016). Having launched 88 CubeSats on 14.02.2017 (the so-called ‘Doves’), Planet has reached an unprecedented milestone of operating approximately 120 satellites in parallel in low Earth orbit. Planet’s satellite constellation of CubeSats 3U will allow daily imaging revisit of the entire Earth once it enters normal imaging operation.
Here we evaluate the quantitative application of Planet high spatial resolution imagery (Planet Team, 2017) for the detection of seagrass and coastal habitats more broadly. The application is evaluated in Thermaikos Gulf, NW Aegean Sea, Greece (Eastern Mediterranean Sea). The eastern shelf waters of the gulf offer an ideal natural laboratory for the application of coastal remote sensing approaches due to the low cloud cover, high water transparency, gentle depth slope, and presence of seagrass meadows of sparse to extensive coverage.
2. DATA AND METHODS 1.1 Field data
In this study, we employ field data that we collected during a boat-, snorkelling- and free-diving-based survey in between 10 –13.07.2016. The temporal difference of four months between The International Archives of the Photogrammetry, Remote Sensing and Spatial Information Sciences, Volume XLII-1/W1, 2017
the field survey and satellite data acquisition, as noted in 1.2, is acceptable due to the nature of Mediterranean seagrass meadows which undergo changes in greater time scales. Field data consist of points related to specific habitat and coordinates. Four different substrates were observed: a) Posidonia oceanica seagrass, b) Cymodocea nodosa seagrass, c) Sand, d) Algae and Rocks.
1.2 Satellite data
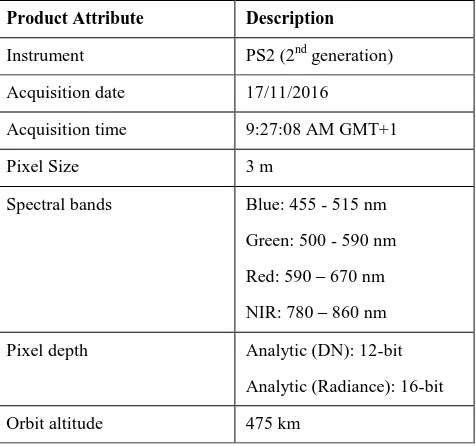
The satellite data used in our study are acquired by Planet’s PlanetScope (PS) Earth-Imaging multispectral CubeSat constellation (Planet Team, 2017). Here, we process the Ortho Scene products which are one of the three product lines for PlanetScope imagery1. PS Ortho Scenes are orthorectified, scaled Top of Atmosphere Radiance image products (Level 3B) and are delivered as analytical (4-band) and visual (RGB) products. PS CubeSats captures imagery at a ground sampling distance of 3.7 m at a reference altitude of 475 km and the imagery is then orthorectified to a pixel size of 3 m. The analytical Ortho Scene imagery used in processing and analysis steps herein was acquired on 17/11/2016 and information about its specific attributes is shown in Table 1. The signal-to-noise ratio (SNR) of the selected image is 68.8.
1.3 Unmixing-based Denoising
A schematic workflow of our adapted methodology is presented in Fig. 1. The low Signal-to-noise Ratio of (SNR) of the selected PS image prompts the application of the Unmixing-based denoising (UBD) as a Pre-processing step. UBD has been recently proposed to selectively retrieve spectral bands characterised by a low SNR by exploiting their correlation with non-corrupted pixels across the whole spectral dimension in hyperspectral images (Cerra et al., 2014). Spectral unmixing is the process which decomposes a hyperspectral image element into a linear combination of signals representing the backscattered solar radiation in each spectral band. Considering the physical properties of a mixed spectrum, UBD assumes the residual vector derived from the unmixing process to be mostly composed of noise and more relevant in spectral bands where atmospheric absorption effects are stronger, and therefore ignored in the reconstruction. In spite of adopting a linear unmixing model, which in theory does not adapt well to water, UBD achieved satisfactory results when applied to spectral bands in the blue range for scenes acquired over coastal waters in previous works (Cerra et al., 2013). Recently, it has been successfully applied to multitemporal stacks of multispectral images (Cerra et al., 2016a, 2016b).
Here, a total of 15 spectral-temporal patterns is extracted from a multitemporal Planet image time series, selected among the purest image elements in the stack. In addition to the PS image of the 17/11/2016, two other PS images from 30/09/2016 and 03/12/2016 with SNRs of 90.1 and 71.8, respectively, comprise this multispectral image time series. Subsequently, UBD is applied to restore the corrupted blue and green band in the
To display the quantitative benefits of UBD on the Planet high spatial resolution image, we implement Lyzenga’s empirical water column correction (Lyzenga, 1981, 1978) on the initial the empirical water column correction as they are the easiest to identify and cover large areas over different depths. The empirical algorithm derives one depth-invariant bottom index before and one after the denoising. These indices are not bottom reflectances, but rather represent a relation between radiances in the blue and green spectrum without a depth effect.
We choose Lyzenga’s empirical algorithm due to its practicality (it does not require field or bathymetry data) and efficiency in improving mapping accuracies in waters that feature horizontal and vertical homogeneity of their optical properties of up to 15 m which are the case in the Thermaikos survey site. Furthermore, this survey site features same substrates (sand and seagrass) over a wide depth range (0 – 16 m), inducing the implementation of Lyzenga’s algorithm.
1.5 Support Vector Machines
The Support Vector Machines (SVM) comprise a group of theoretically superior, supervised classifiers based on the statistical learning theory of Vapnik (1995). These essentially machine learning algorithms solve classification problems by fitting an optimal hyperplane, which comprises the decision boundary, to the training samples. The samples that fall closer to this hyperplane are the so-called support vectors which
Product Attribute Description Instrument PS2 (2nd generation)
Acquisition date 17/11/2016
Acquisition time 9:27:08 AM GMT+1
Pixel Size 3 m
Spectral bands Blue: 455 - 515 nm
Green: 500 - 590 nm
Red: 590 – 670 nm NIR: 780 – 860 nm Pixel depth Analytic (DN): 12-bit
Analytic (Radiance): 16-bit
Orbit altitude 475 km
Table 1. PlanetScope Analytic Ortho Scene Product Attributes. The International Archives of the Photogrammetry, Remote Sensing and Spatial Information Sciences, Volume XLII-1/W1, 2017
Figure 1. Workflow of the herein processed methodology. The Planet Image Time Series consists of three different PlanetScope Analytic Ortho Scenes. Lyzenga’s empirical water column correction is adapted from Lyzenga (1978, 1981).
are the only data used by SVM in the classification step. We apply SVM utilising the universal Gaussian radial basis function kernel (RBF):
K (x, xi) = exp (-g|x - xi| 2
) (1)
where g is the parameter that defines the width of the RBF. In addition, we set a regularisation parameter, C which controls the degree of acceptable misclassification through limiting the influence of individual training samples. Furthermore, we select a Cross validation parameter which monitors the accuracy of results during the grid search for the selection of the best pair of values for g and C. Specific model parameters to run both SVM experiments are shown in Table 2. The RBF kernel is employed on the acquired field data to classify both depth-invariant indices before and after the application of UBD. The SVM experiments are run using the open-source LIBSVM library (Chang and Lin, 2013).
The quantitative evaluation of the potential benefits of UBD on Planet data for detection of Mediterranean seagrasses and other shallow submerged habitats is performed through the accuracy assessment of the SVM-derived results. The accuracy assessment employs field data from Thermaikos survey site using the error matrix and Kappa value (Congalton, 1991).
3. RESULTS
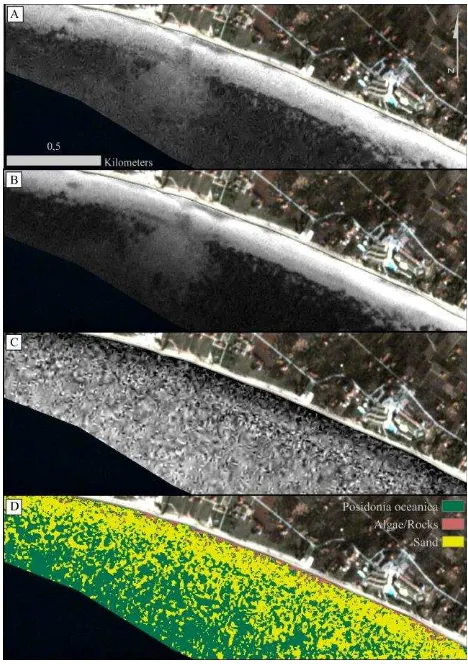
Our experimental results are displayed in methodological succession in Fig. 2 and 3. Visual inspection of Fig. 2A and 2B, which show the initial ‘noisy’ blue and green bands of PlanetScope image over our test site, reveals several artefacts, generated and enhanced in the acquisition and pre-processing of the acquired images. While we have not been able to determine to which extent these artefacts are introduced for each processing step, they appear to be significantly decreased following application of the Unmixing-based denoising (Fig. 3A, 3B). The depth-invariant index of ‘noisy’ blue and green bands (Fig. 2C) indicates that Lyzenga’s empirical water
Table 2. Model parameters used to run Support Vector Machines utilising the universal Gaussian radial basis function kernel (RBF) for both experiments; before and after the application of Unmixing-based Denoising (UBD). Min and Max report the minimum and maximum values which define the grid range (g and C dimension). A multiplier of 10 is set for grid range for both experiments.
column correction fails to eliminate the effect of water column attenuation on bottom reflectances. In contrast, applying Lyzenga’s algorithm on the denoised depth-invariant index (Fig. 3C) yields a seemingly more realistic representation of the bottom. The SVM-derived classification results comprise submerged habitat distribution maps of our survey site in the Thermaikos Gulf (Fig. 2D, 3D). Accuracy assessment (Table 3, 4) of the classifications of the resulting ‘noisy’ and denoised depth-invariant indices following application of UBD and empirical water column correction reflects the visual inspections. The denoised depth-invariant index of blue and green Planet reflectances improves overall accuracy and Kappa value from 53.2% and 0.26 to 68.1% and 0.5, respectively. Denoising aids detection of Posidonia oceanica seagrass species by increasing its producer and user accuracy by 31.7% and 10.4%, correspondingly, with a respective increase in its Kappa value from 0.3 to 0.48. On the other hand, both classified depth-invariant indices, before and after denoising, fail to detect Cymodocea nodosa seagrass species. Moreover, the error matrix indicates that P. oceanica seagrass class is mainly confused with sand class. Generally, denoising unveils fine, smaller patches of sand within the homogeneous P. oceanica meadows, an essential feature of the high spatial resolution Planet imagery towards finer scale seagrass detection. Both classification results lack clear delineation of the seaward limit of P. oceanica seagrass.
4. DISCUSSION AND CONCLUSIONS
Using high spatial resolution CubeSat-derived Planet imagery, we detect Posidonia oceanica, the dominant Mediterranean seagrass species, with acceptable accuracies following application of UBD, empirical water column correction and SVM. On one hand, we expect Planet’s high spatio-temporal resolution imagery to cover gaps in finer scale seagrass detection of temporal cover of remote sensing data provided by
Model parameters
Before UBD After UBD
Support vectors 43 31
RBF width, g 100 1000
Regularisation parameter, C
0.01 10
Min (g), Max (g) 0.01 1000
Min (C), Max (C) 0.01 1000
Cross validation 3 3
Termination criterion for grid search
0.1 0.001
Termination criterion for final training
0.1 0.001
Figure 2. Experimental steps without the application of Unmixing-based denoising. A and B display the initial, ‘noisy’ blue and green Planet reflectance, respectively. C is the depth-invariant index (Lyzenga’s empirical water column correction) of A and B before applying the Unmixing-based denoising (UBD). D shows Support Vector Machine classification result of C. All rasters are draped over a PlanetScope analytic Ortho RGB Scene of 17/11/2016 over our test site in Thermaikos Gulf, NW Aegean Sea, Greece, projected in UTM (zone 34) system/WGS84.
Table 3. Error matrix of Fig. 2D before the application of UBD on Planet imagery. CN: Cymodocea nodosa seagrass, PO: Posidonia oceanica seagrass, A/R: Algae and Rocks, S: Sand
bigger multispectral satellites like Sentinel-2 and Landsat-8. On the other hand, remote sensing of coastal ecosystems like
Figure 3. Experimental steps with the application of Unmixing-based denoising. A and B display the denoised blue and green Planet reflectance following the UBD application on the A and B of Fig. 2., respectively. Differences in overall brightness from A and B of Fig. 3 are due to their different histogram stretch. C is the depth-invariant index of A and B after the UBD application. D shows Support Vector Machine classification result of C. All rasters are draped over a PlanetScope analytic Ortho RGB Scene of 17/11/2016 over our test site in Thermaikos Gulf, NW Aegean Sea, Greece, projected in UTM (zone 34) system/WGS84.
Table 4. Error matrix of Fig. 3D after the application of UBD on Planet imagery. CN: Cymodocea nodosa seagrass, PO: Posidonia oceanica seagrass, A/R: Algae and Rocks, S: Sand
seagrasses requires sensors with higher SNR than the ones applied in terrestrial ecosystems. Planet’s low SNR for Before UBD
Class CN PO A/R S Total User
accuracy
CN 0 0 0 0 0 0
PO 3 26 0 14 43 60.5
A/R 0 1 6 1 8 75
S 6 14 5 18 43 41.9
Total 9 41 11 33 94
Producer accuracy
0 63.4 54.6 54.6
Kappa value
0 0.3 0.72 0.1
Overall accuracy: 53.2; Kappa value: 0.26
After UBD
Class CN PO A/R S Total User
accuracy
CN 0 0 0 0 0 0
PO 2 39 2 12 55 70.9
A/R 3 1 7 3 14 50
S 4 1 2 18 25 72
Total 9 41 11 33 94
Producer accuracy
0 95.1 60.1 81.1
Kappa value
0 0.48 0.43 0.57
Overall accuracy: 68.1; Kappa value: 0.5
pixel-based coastal and aquatic, generally, applications may bring degradations in the image quality. In our study, these are shown to hinder the production of informative habitat maps following Lyzenga’s empirical water column correction. We attribute this problem to the selection of pixels that represent sandy bottoms in different depths but suffer from notable degradations.
As we show here, the low SNR drawback can be balanced, first, by the application of UBD which significantly improves seagrass detection amongst other submerged habitats including sand and algae/rocks. A second solution for the SNR deficit for water applications can be possibly provided by applying data fusion between Planet high spatio-temporal resolution images and Sentinel-2 and/or Landsat-8 lower spatial, but higher spectral resolution. A third and last, possible solution for the noise issue can be provided through the use of Object-based Image Analysis (OBIA) which in contrast to pixel-based approaches, first analyse image scenes to relatively homogeneous areas by decomposition and then produce object-based instead of pixel-object-based classifications (Blaschke, 2010). In contrast to its increasing popularity and efficiency to terrestrial approaches, however, applications of OBIA to coastal areas are scarce.
In the near future, our objective is to improve accuracies in seagrass detection by applying more sophisticated, analytical water column correction algorithms to Planet imagery, developing time- and cost-effective mapping and monitoring of seagrass distribution. Effective exploitation of this new kind of high spatio-temporal resolution multispectral dataset can meet the scale and aim of the majority of future seagrass mapping and monitoring projects, from a small meadow to a whole coastline, allowing for improved management and conservation of these significant coastal ecosystems.
ACKNOWLEDGEMENTS
Dimosthenis Traganos is supported by a DLR-DAAD Research Fellowship (No. 57186656). Planet satellite images (Planet Team, 2017) are provided through the Planet’s Ambassadors program2.
REFERENCES
Blaschke, T., 2010. Object based image analysis for remote sensing. ISPRS Journal of Photogrammetry and Remote Sensing 65(1), pp. 2-16.
Boström, C. and Bonsdorff, E., 1997. Community structure and spatial variation of benthic invertebrates associated with Zostera marina (L.) beds in the northern Baltic Sea. Journal of Sea Research 37 (1), pp. 153–166.
Cerra, D., Bieniarz, J., Beyer, F., Tian, J., Muller, R., Jarmer, T. and Reinartz, P., 2016. Cloud removal in image time series through sparse reconstruction from random measurements. IEEE Journal of Selected Topics in Applied Earth Observations and Remote Sensing 9(8), pp. 3615-3628.
Cerra, D., Bieniarz, J., Muller, R., Storch, T. and Reinartz, P., 2015. Restoration of simulated enmap data through sparse spectral unmixing. Remote Sensing 7(10), pp. 13190-13207.
2
https://www.planet.com/markets/ambassador-signup/
Cerra, D., Muller, R. and Reinartz, P., 2014. Noise reduction in hyperspectral images through spectral unmixing. IEEE Geoscience and Remote Sensing Letters 11(1), pp. 109–113.
Cerra, D., Gege, P., Müller, R. and Reinartz, P., 2013. Exploiting noisy hyperspectral bands for water analysis. In: 33th EARSeL Symposium Proceedings. pp. 43-48
Chang, C., Lin, C., 2013. LIBSVM : A Library for Support Vector Machines. ACM Transactions on Intelligent Systems and Technology 2(3), pp. 1–39.
Congalton, R.G., 1991. A Review of Assessing the Accuracy of Classifications of Remotely Sensed Data. Remote sensing of Environment 46 (1), 35–46.
Costanza, R., Arge, R., Groot, R. De, Farber, S., Grasso, M., Hannon, B., Limburg, K., Naeem, S., Neill, R.V.O., Paruelo, J., Raskin, R.G., Sutton, P. and van der Belt, M., 1997. The value of the world’s ecosystem services and natural capital. Nature 387, pp. 253–260.
Fourqurean, J.W., Duarte, C.M., Kennedy, H., Marba, N., Holmer, M., Mateo, M.A., Apostolaki, E.T., Kendrick, G.A., Krause-Jensen, D., McGlathery, K.J. and Serrano, O., 2012. Seagrass ecosystems as a globally significant carbon stock. Nature Geoscience 5, pp. 505-509.
Lamb, J.B., Water, J.A.J.M. Van De, Bourne, D.G., Altier, C., 2017. Seagrass ecosystems reduce exposure to bacterial pathogens of humans, fishes, and invertebrates. Science 355(6326), pp. 731-733.
Lyzenga, D.R., 1981. Remote sensing of bottom reflectance and water attenuation parameters in shallow water using aircraft and Landsat data. International Journal of Remote Sensing 2(1), pp. 71–82.
Lyzenga, D.R., 1978. Passive remote sensing techniques for mapping water depth and bottom features. Applied Optics 17 (3), pp. 379–383.
National Academies of Sciences, Engineering, and Medicine, 2016. Achieving Science with CubeSats: Thinking Inside the Box. Washington, DC: The National Academies Press. pp. 130
Planet Team (2017). Planet Application Program Interface: In Space for Life on Earth. San Francisco, CA.
https://api.planet.com
Telesca, L., Belluscio, A., Criscoli, A., Ardizzone, G., Apostolaki, E.T., Fraschetti, S., Gristina, M., Knittweis, L., Martin, C.S., Pergent, G., Alagna, A., Badalamenti, F., Garofalo, G., Gerakaris, V., Pace, M.L., Pergent-martini, C., 2015. Seagrass meadows ( Posidonia oceanica ) distribution and trajectories of change. Scientific Reports 5, pp. 1–14.
Vapnik, V., 1995. The Nature of Statistical Learning Theory, Springer-Verlag New York. pp. 188.
Ward, L.G., Michael Kemp, W., Boynton, W.R., 1984. The influence of waves and seagrass communities on suspended particulates in an estuarine embayment. Marine Geology 59(1- 4), pp. 85–103.