A DISTRIBUTED ONLINE 3D-LIDAR MAPPING SYSTEM
J. Schmiemanna∗, H. Harmsa, J. Schattenberga, M. Beckerb, S. Batzdorferb, L. Frerichsa
aInstitute of Mobile Machines and Commercial Vehicles, Technische Universit¨at Braunschweig, Germany
-(j.schmiemann, h.harms, j.schattenberg, l.frerichs)@tu-braunschweig.de bInstitute of Flight Guidance, Technische Universit¨at Braunschweig, Germany
-(s.batzdorfer, m.becker)@tu-braunschweig.de
KEY WORDS:Decentralized online LIDAR mapping, mobile ad-hoc networking, heterogeneous machine cluster
ABSTRACT:
In this paper we are presenting work done within the joint development project ANKommEn. It deals with the development of a highly automated robotic system for fast data acquisition in civil disaster scenarios. One of the main requirements is a versatile system, hence the concept embraces a machine cluster consisting of multiple fundamentally different robotic platforms. To cover a large variety of potential deployment scenarios, neither the absolute amount of participants, nor the precise individual layout of each platform shall be restricted within the conceptual design. Thus leading to a variety of special requirements, like onboard and online data processing capabilities for each individual participant and efficient data exchange structures, allowing reliable random data exchange between individual robots. We are demonstrating the functionality and performance by means of a distributed mapping system evaluated with real world data in a challenging urban and rural indoor / outdoor scenarios.
1. INTRODUCTION
In the joint development project ANKommEn - funded by the German Federal Ministry of Economic Affairs and Energy. Ad-ministrated by the Space Administration of the DLR (funding code: 50NA1518) - a prototypical system, consisting of two Un-manned Ground Vehicles (UGV), which are perfect suitable to carry out tasks like e.g. long term exploration in indoor like sce-narios, and three Unmanned Aerial Vehicles (UAV), which are able to cover long distances in exploring spacious terrain scenar-ios e.g. for generating three dimensional elevation models of the environment.
Hence the aim is a versatile system, depending on the deploy-ment scenario, a single robot, multiple similar or even a cluster of heterogeneous robots can be used. To enable those capabilities and to be able to combine the strength of each robotic platform, a distributed system approach seems reasonable. In this paper we want to demonstrate the performance of our design and special implementations by means of a distributed Multi Robot LIDAR Mapping System. All LIDAR data is acquired using multiple Velodyne VLP-16 sensors.
The novelty in our approach is, that we are able to incorporate en-vironmental information from different participants across a het-erogeneous cluster of machines within the mapping process. This allows for the individual robots to see even beyond the horizon of their own sensor.
A typical use case scenario could be to superficially explore ex-tensive unknown terrain using a UAV to then use those informa-tion as prior for the detailed mapping of structures with man-ageable extension in detail, using a UGV. The prior information gathered by the UAV can then be used in a wide range of ap-plications from automated path planning and proactive obstacle avoidance, to simply using it as an overview for a operator, who may not have direct line of sight to the controlled robot.
∗Corresponding author
In order to exchange data in a distributed machine cluster a mo-bile ad-hoc network (MANET) is used, which is capable to detect route changes due to the mobility of the vehicles and to deliver traffic over multiple hops. Furthermore a new communication layer is proposed to exchange sensor data between the vehicles and a ground station. The communication layer expands the local messaging system of each vehicle to work with non-ideal wire-less links. The online LIDAR mapping with multiple vehicles requires a high bandwidth and a reliable data exchange, therefore the communication layer provides mechanisms for data compres-sion and buffering during communication drop outs.
2. HARDWARE
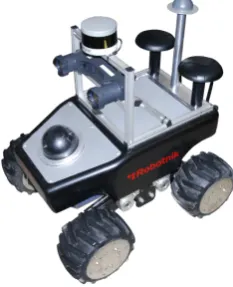
The Unmanned Ground Vehicles (UGV) are based on the ’Sum-mit XL’ robot by Robotnik (cf. Figure 1). For airborne data ac-quisition, the robotic platform ’AR200’ by AirRobot (cf. Figure 2) is used. Both UGV and one UAV are equipped with, with a VLP-16 LIDAR by Velodyne.
For localization purposes, each unit is equipped with an iner-tial measurement unit (IMU) type ADIS16488 (Analog Devices) and a multi-constellation capable GNSS-Receiver type LEA M8T (uBlox).
3. RELATED WORK 3.1 Communication
Figure 1. SummitXL UGV by Robotnik
Figure 2. AR200 UAV by AirRobot
a certain range. Routing algorithms for MANETs should quickly react to topology changes and discover new paths within the small-est possible time. Therefore the methods can be distinguished based on the manner the route discovery mechanism performs and can be divided into proactive, reactive and hybrid routing protocols. Current implementations that are widely used nowa-days are Optimized Link State Routing (OLSR), Better Approach To Mobile Adhoc Networking (BATMAN-adv) and open802.11s. OLSR (layer-3 implementation) and BATMAN-adv (layer-2 im-plementation) are both proactive protocols, whereas open802.11s is a hybrid routing protocol implemented on layer-2. A good comparison of the protocols as well as a performance analysis for UAV applications is given in [Pojda et al., 2011].
Beside suitable routing algorithms for a multi-robot system par-ticular attention to the middleware architecture and user space ap-plications is necessary. Current middleware systems such as ROS (Robert Operating System) [Quigley et al., 2009] or Lightweight communications and marshalling (LCM) [Huang et al., 2010] provide a publisher subscriber mechanism for message exchange, to make distributed applications more fault tolerant. ROS uses a centralized approach to connect subscriber and publisher, with is a huge drawback for multi-robot systems, whereas LCM uses a decentralized approach which is achieved by sending all mes-sages as UDP multicast. Over the last years several extensions were developed to make ROS more suitable for multi-robot sys-tems. In [Tiderko et al., 2016] called multimaser f kiewas presented to synchronize multiple ROS masters. Another solu-tion isnimbro network developed by [Schwarz et al., 2016] which provides mechanism like data compression and Forward Error Correction to better deal with lossy network links. Fur-thermore currently ROS2 is under development, which will make use of different implementations of the Data Distribution Ser-vice (DDS), which already provides middleware serSer-vices. DDS uses a Quality of Service (QoS) based subscriber publisher
con-cept and is more suitable for real-time embedded systems. Sev-eral implementations of the DDS standard are available such as RTI Connext DDS [Real-Time Innovations, 2017] or OpenSplice [PrismTech, 2017]. A comprehension comparison between ROS and ROS2 is shown in [Maruyama et al., 2016].
3.2 Mapping
Due to the presence of massive noise while mapping in unstruc-tured and dynamic environments, a probabilistic approach for modeling the SLAM problem is state of the art. Firstly intro-duced formulations of the SLAM problem were based on filtering techniques, while recent methods are mostly based on smooth-ing approaches. The filtersmooth-ing formulation only contains the cur-rent robot pose and map. Therefore filtering methods are often referred to online state estimation techniques. Famous filtering techniques are Kalman Filters [Smith et al., 1990], Particle Fil-ters [H¨ahnel et al., 2003, Grisetti et al., 2007] and Information Filters [Thrun et al., 2004, Eustice et al., 2005]. Smoothing ap-proaches are formulated to estimate the whole robot trajectory from the full set of measurements in the mean of least squares error minimization. Suitable for solving such non-linear prob-lems are for instance Gauss-Newton or Levenberg-Marquardt al-gorithms.
Lu et al. [Lu and Milios, 1997] introduced a novel graph nota-tion for the smoothing formulanota-tion of the SLAM problem. Those approaches have been significantly improved over the time [Ol-son et al., 2006]. Due to their nature of incorporating each and every measurement, this group of approaches is often referred to the full SLAM formulation. A superb introduction to this topic is given by Grisetti et al. [Grisetti et al., 2010]. Dellaert et al. [Del-laert, 2005] introduced a novel approach to the domain of graph SLAM, which had already proven successfully it’s capability of handling large scale problems with lots of unknowns in the do-main of photogrammetry and computer vision. This novel ap-proach to solve the full SLAM problem is called Square Root Smoothing and Mapping (Square Root SAM). It is based on fac-torization of the information matrix. A detailed description is given by Dellaert et al. [Dellaert and Kaess, 2006].
Olson [Olson, 2009] introduces a novel method for place recog-nition. To make place recognition more reliable and to avoid false positive data association he has developed a two phased al-gorithm. Once promising place recognition hypotheses along a pose graph are found, they are grouped with respect to their spa-tial distance. Those grouped hypotheses are then analyzed using a pair-wise consistency check. Each pair of hypotheses constructs a loop of rigid body transformations consisting of the two hypothe-ses and two dijkstra links on the analyzed graph. A consistency metric is defined, which is proportional to the probability that all four rigid body transformations construct a loop.
4. THE APPROACH 4.1 Localization
So the GNSS based positioning is used for aiding the IMU mea-surements within an extended Kalman Filter using the navigation software framework of the Instiute of Flight Guidance. The men-tioned ADIS IMU (cf. Section 2) provides high frequent, three di-mensional measurements of accelerations and angular rates. Us-ing common strap down algorithm processUs-ing, high frequent po-sition, velocity, attitude and heading information is provided in real time. Due to the short time stability of pure inertial navi-gation, the GNSS positioning results are used for aiding purpose within the Kalman Filter’s update step. To overcome the absence of GNSS aiding information even when using Multiconstellation, mainly two options are possible. First a short coasting period is possible after the data fusion has reached steady state. Second it is possible due to the high modular design of the navigation soft-ware framework to use position and/or attitude increments from environmental sensor data processing for aiding the IMU.
The determined vehicle’s state vector is than high frequently dis-tributed within the system for georeferencing measurements of the used environmental sensors especially the RGB camera and the LiDAR for photogrammetry and SLAM applications.
4.2 Communication
We considered BATMAN-adv and open802.11s for the network routing, as they are also recommended by [Pojda et al., 2011]. First throughput experiments with BATMAN-adv and an overview of our hardware setup are described in [Harms et al., 2016]. Fur-ther communication experiments however have shown some flap-ping route problems in BATMAN-adv, because BATMAN-adv uses the amount of originator messages (OGMs) received in a sliding window for determining the link metric. Therefore links with low package loss are preferred, even if the throughput is low, which is often problematic in our scenarios. Currently we are evaluating open802.11s, which has shown comparable through-put results but uses an air time link metric instead.
For choosing an appropriate middleware architecture not only communication aspects like the suitability for MANETs were considered, but also the ability to visualize streamed data in an graphical user interface and the availability of sensor drivers. In view of those factors we choose ROS as middleware, because it comes with greater abilities to integrate existing drivers and more possibilities to visualize sensor data. To address the limited multi-robot communication we build up a custom communication layer on top of ROS to exchange topics and services via unreli-able Wifi links, similar to the approach developed by [Schwarz et al., 2016].
In our approach every robot runs an independentroscore. To transfer messages between multiple robots the regular ROS topic transport mechanism is splitted up and enlarged with a set of nodes for sending and receiving data. Each topic can be config-ured with a user defined protocol (TCP or UDP), rate and priority that best fits the needs. To avoid data loss of topics requiring a reliable connection during communication drop outs, each topic can also be buffered for a certain time. Topic prioritization and buffering are defined as QoS option in the following. To automat-ically connect topics between multiple robots the current state of eachroscoreis send out via UDP broadcast regularly and vali-dated by the receivers. The topic receivers can either be precon-figured via a configuration file, or settings can be adapted via a
rvizplugin on the fly. Furthermore the custom communication layer is able to reduce the network load by compressing messages via zstd [Facebook, 2016] and to stream image topics via h.264 to further reduce the needed bandwidth.
UTM
o
0o
1x
1Map
r
Global Graph
Local Graph
x
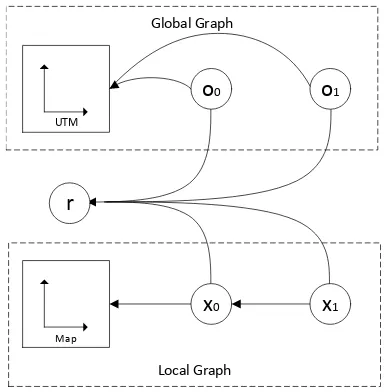
0Figure 3. Processing pipeline of the pose graph merging method
4.3 Mapping
The Mapping system is based on a Relative Pose Graph formu-lation, whereby direct pose to pose constraints are gained using ICP-like methods. To reduce the number of iterations needed for convergence, one can use the positional and attitudinal informa-tion obtained by an EKF (cf. Secinforma-tion 4.1). The online state es-timation from the EKF is used to georeference the Pose Graphs, as well. Non linear optimization is then done using incremental Smoothing and Mapping (iSAM).
One main contribution is a mechanism to find consistent con-straints between independent Relative Pose Graphs to convict dif-ferent ones into a single common frame of reference, even within areas of degraded GNSS signals. In areas where direct line of sight to a sufficient amount of GNSS satellites is given, at least for certain sections of the robots trajectory, one can convict the whole trajectory into a common frame of reference (such as UTM). Due to the presence of generally high errors using GNSS like methods for georeferencing, especially for ground vehicles in dense urban or in overgrown wooded areas, we have developed a mechanism, which is robust against errors.
Therefore we are searching for poses which are near to each other in those concerned Relative Pose Graphs. To find nearby poses the initial position and orientation between both Pose Graphs is crucial. In case both trajectories can be georeferenced with suf-ficient accuracy, finding an appropriate initial guess for relative position and orientation is quite straightforward. If not, the task is unlikely harder to complete. For those purposes we have imple-mented an algorithm to extract reliable two dimensional features from three dimensional Velodyne like LIDAR sensors.
It is probable that sensor readings from poses, which are spa-tially close to each other, describe the same physical scene. Thus allowing us to calculate the relative position and orientation be-tween the different points of view the sensor readings were col-lected from. Constraints generated this way are treated as place recognition hypothesis. Due to partially huge errors in the initial relative positioning of both Pose Graphs and due to the fact that introducing wrong constraints into the Pose Graphs would lead to instant divergence, eliminating false positive place recognition hypothesis is an important step, too.
are using extended loop closing techniques to only accept those hypothesis, which are most self consistent. Therefore we are run-ning a pairwise consistency test by building up rigid body trans-forms including two hypothesis each and the related shortest links on both Pose Graphs. In general the consistency of both hypoth-esis correlates with the likelihood for both hypothhypoth-esises, con-nected with the shortest links on each Pose Graph, to construct a loop. Therefore the uncertainties are taken into consideration using joint marginals.
Mapping usually poses tremendous demands on the quality of the localization results, which in fact are rarely being reached under near to reality deployment conditions. Therefore ICP-like meth-ods are used to refine positional and attitudinal information, to then register readings of the environmental readings to a common frame of reference. Thus, the consecutive registration of readings from environmental sensor within a common frame of reference, is referred to the term mapping.
As referred in Section 3.2, the whole mapping process is based on a non-linear optimization of a Pose Graph, which is formulated as a Factor Graph. The whole mapping system is illustrated in Figure 3. The mapping pipeline shall be discussed briefly in the following. The complete graph consists of three different types of values. Firstlyxiare poses within a local frame of reference. They are connected consecutively, using pose to pose factors as described in Section 4.3.1. The upper part of Figure 3 shows the Global Graph, which contains global posesojwithin the world fixed WGS84 reference system. Those values are directly ob-tained using methods as described in Section 4.1. Furthermore, to calculate the transformation between the local - and the global frame of reference an additional valueris introduced.
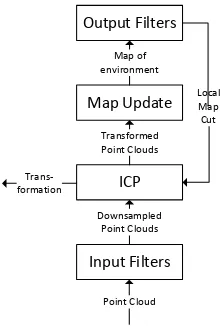
4.3.1 Local Frame of Reference The first step of each run of the mapping process, is creating a pose graph within the local map frame. This frame of reference can be chosen arbitrary and therefore mostly will be set to zero. Each incoming scan of the VLP-16 is then registered using an ICP-Chain-Algorithm with a robotic centric map. The concrete pipeline is illustrated in fig-ure 4. Incoming pointclouds are first downsampled using differ-ent kind of filters e.g. voxel grid filters. Furthermore important point features, such as surface normals, observation directions and similar, are calculated. Those features are needed for further processing. The downsampled pointcloud is then passed to the ICP-Core.
For each point thennearest neighbors are searched. In this step, we can configure e.g. the maximum radius, in which we are searching for neighbors and we can define the number of neigh-bors to search for. After establishing correspondences between the input pointcloud and the robotic centric map, outlier filters are used to reject false positive correspondences. Therefore we usu-ally use a Trimmed Distance Outlier Filter, which rejects a certain amount - e.g. 10 percent - of the longest distances and Surface Normal Outlier Filter, which only accepts correspondences, if the angle between the corresponding normals is smaller then a given threshold.
All remaining correspondences are then used to minimize the transformation error between the input points and the internal robotic centric map. Therefore different kind of error metrics can be used. Experiments have shown, that a point to plane error metric generally leads to the best results within our use cases.
Both steps - finding correct correspondences and minimizing the transformation error - are then iterated, until certain convergence
Input Filters
Figure 4. Processing pipeline of the ICP-Chain-Algorithm
criteria are met. As convergence criteria we typically use a max-imum number of iterations, to limit the maximal amount of time, and the change of transformation error with respect to rotation and translation smoothed across multiple steps to avoid oscilla-tions.
The obtained transformation is then introduced to the Local Graph as pose to pose constraints, between the affected poses.
4.3.2 Global Frame of Reference Since our exploration sys-tem is designed to operate in spacious outdoor scenarios, geo-referencing all created maps is crucial e.g. to relate the obtained maps with prior information or with maps generated from other agents within the cluster of machines.
Therefore, a second graph is built (cf. upper part Figure 3), which contains nodes referenced to the world fixed Universal Transverse Mercator (UTM) reference system. Due to it’s nature of being globally aligned, poses referenced to the UTM reference system are hereinafter called global. In contrast to the Local Graph, the Global one only contains factors affecting a single value.
Both graphs are connected with so called Reference Frame Fac-tors. Those factors affecting three different values, within the non-linear optimization process. Both corresponding poses - one in the global and one in the local graph - and a third value called
r, which represents the transformation between both frames of references. On this way we are introducing the transformation from the local to he global frame of reference to the optimization process itself.
4.3.3 Place Recognition When mapping large scale outdoor scenarios, place recognition becomes a fundamental aspect. To increase accuracy and compensate errors due to drift along the robot’s trajectory, one can introduce additional constraints be-tween non consecutive poses in the local graph.
Therefore nearby poses are searched using a kD-Tree. Potential candidates for place recognition have to pass several tests. First, to avoid introducing to many factors - which normally lead to instability of the graph - a minimum length of the traversed path between both considered poses has to be ensured. Therefore eq. 1 has to be fulfilled.dijindexrepresents the distance in pose indices, whilstdCloud is the minimum traversal length for the robot to save the next cloud anddminis the threshold for the minimum traversed distance.
Eq. 2 ensures that the distance between both considered poses
dijtranslationalis less then a certain threshold. This ensures po-tential overlap in the readings of the environmental sensor.
xi−xj=dij
translational< dmax (2)
At least we are calculating the profit for each place recognition hypothesis. Eq. 3 calculates the loop factorl referencing the shortest (dijkstra) pathddijkstrabetween both considered poses and the norm of the actual translational distance between both poses|dijtranslational|. This allows us to adaptively generate place recognition hypothesizes. A large loop, which has accumulated a larger error, will usually require a taller search radius to find proper poses for loop closing. Thus requires to accept place recognition hypothesis containing poses, which have a larger dis-tance in the current solution of the non-linear graph optimization.
dijdijkstra
|dijtranslational| > lmin (3)
All place recognition hypothesizes are then evaluated using meth-ods proposed by Olson (cf. Section 3.2) [Olson, 2009] to accept only the most consistent subset of all generated hypothesizes.
Our mapping system is capable of finding constraints across mul-tiple independent pose graphs, as well. Therefore we are using the proposed method in a quite straightforward fashion, with the difference, that generally more place recognition hypothesizes are accepted. The most difficult part in registering independent pose graphs is to find a suitable initial guess, to efficiently run place recognition algorithms. If both trajectories are georefer-enced (cf. Figure 3) this information can be used for guessing the transformation between both pose graphs, otherwise we are using general purpose features [Schmiemann et al., 2016] to roughly align both graphs.
5. EXPERIMENTS 5.1 Urban Scenario
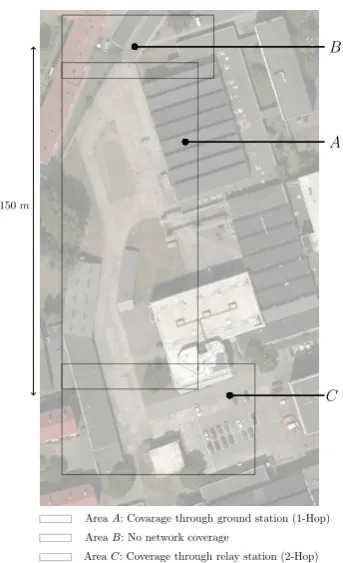
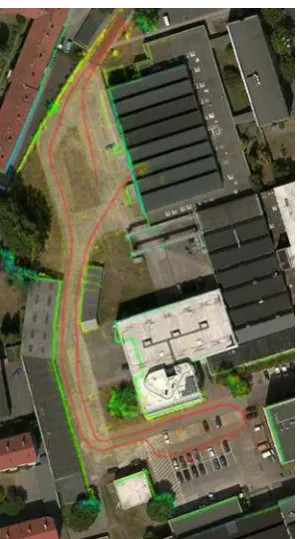
To evaluate the capabilities of the mobile adhoc network, as well as the interaction between the communication setup and the map-ping process, the testing ground shown in Figure 5 is used. A ground station for controlling the UGVs and online visualization is placed at PointAand an UGV for online mapping is driving from pointAto PointBand afterwards to PointC. While driving the described pattern the vehicle is crossing the depicted areas in the following order:A−B−A−C−A. PointAof the ground station is located inside a hall, whereas PointBandCare located outdoor. Furthermore there are also some buildings in the line of sight between PointA,B, andC. In all described experiments the following topics are transferred from the UGV to the ground station:
• Robot State Topic , 1Hz
• Camera Topic, 10Hz
• Map Updates, irregular rate
The main objective of the investigation is to find out how the de-livery rate of vehicle control messages (the robot state and video
A B
C
AreaA: Covarage through ground station (1-Hop)
AreaB: No network coverage
AreaC: Coverage through relay station (2-Hop) 150m
Figure 5. Experiment Area
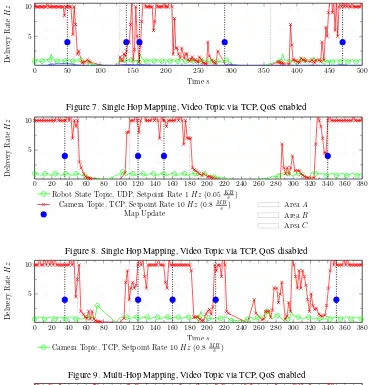
topic) performs under challenging network conditions, such as low bandwidth due to poor signal quality, multi-hop links or if the available bandwidth is reduced because a map update is trans-mitted to the ground station. Figure 7 up to Figure 11 shows the delivery rate of the mentioned topics from the UGV towards the ground station over the whole track time. The size of the map update varies between 1.5 MB for the first update and approxi-mately 100 MB for the last update (uncompressed size).
In the first experiment described in Figure 7 the UGV is only able to communicate with the ground station in AreaA. While crossing AreaB andCalmost no messages can be delivered to the ground station, due to the missing network link. Also the delivery rate of the camera topic drops down while transferring a map update.
In the second experiment, the same pattern was driven again, but the transfer of the video and robot state topic was done with a higher priority than the map update, to avoid a drop of the deliv-ery rate during map updates. When Comparing Figure 7 and 8, it shows an improved message delivery rate for the high priority topics while driving in AreaA.
Figure 9 shows the delivery rate for the same topics again, letting driving pattern also unchanged, but in contrast to the first two experiments a relay station is placed in between AreaAandC. This arrangement leads to a 2-hop link when driving in AreaC
and resulting in an improved delivery rate of the robot state and video topic in AreaC. However the video rate still is unstable and far below the set point rate of 10Hzin the multi-hop area.
When changing the protocol for the video topic from a JPEG to a h.246 compression and sending the video topic via RTP protocol, the delivery rate can be further improved in the 2-hop areaC, due to lower bandwidth requirements, as described in Figure 10.
Figure 6. Result of the mapping process
it is possible to run the mapping process on the ground station and avoid data burst of larger map updates. In contrast to the first experiments the rely station was replaced with a second UGV, that is dynamical occupying a position in between the ground station and the mapping UGV. As shown in Figure 11 the delivery rate of the velodyne messages reaches a value near the set point rate in the first multi-hop areaB, but significantly drops down in the second multi-hop areaC.
Figure 6 shows the mapping result for the online mapping pro-cess. The red line illustrates the trajectory of the UGV. It oper-ated 346 seconds and traversed a track of 485 meters in length. The whole Pose Graph consists of 976 poses and the whole map consists of 2.9 million data points. The data points are shown in Figure 6, too.
Due to the closed shape of the trajectory, efficient and robust place recognition allows for consistent mapping of the environ-ment. Our methods recognizes places mainly at three different areas. The first loop is closed, when the UGV returns to Area A (cf. Figure 5) after mapping Area B. A second loop is closed along the narrow passage between Area C and Area A, which is enclosed by garages to both sides. The third area, where multi-ple loop constraints are introduced to the Pose Graph, is located between the starting point, which is revisited, before the UGV enters the hall.
5.2 Rural Scenario
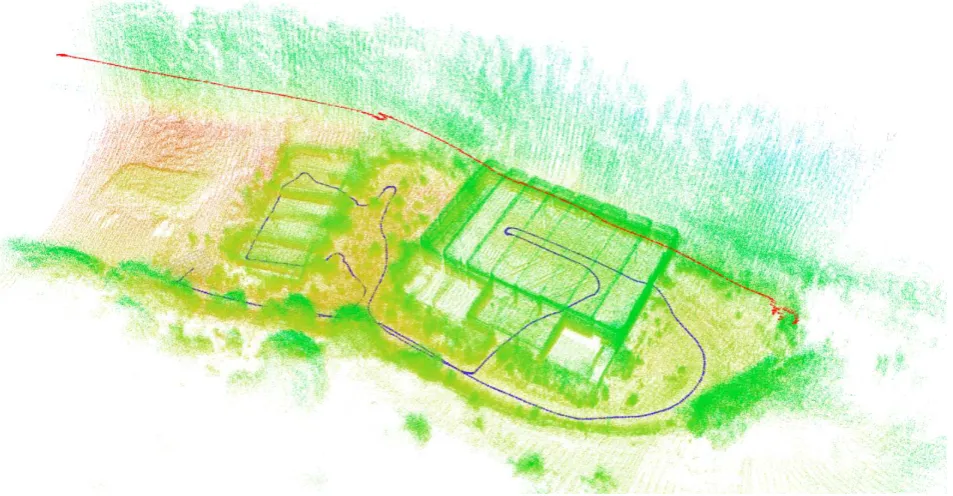
To evaluate the mapping system in a more demanding scenario, another experiment in an unstructured and cluttered environment, with alternating indoor and outdoor passages, has been run. The aim was to explore two buildings, which are located in a thickly wooded rural area. For exploration a team of heterogeneous robots was used. An UAV was used to superficially explore the area and determine the driveways for an UGV.
Table 1 shows some basic information about the exploration mis-sion for both - the UGV and the UAV. It shows, that the
explo-Table 1. Simultaneous exploration with UGV and UAV
UGV UAV
Nb. of poses 961 249
Exploration Time [s] 415 76
Track length [m] 466 184
Nb. of data points [million] 3.4 1.3
ration with the UAV only takes a fraction of time compared to the exploration using the ground vehicle, although the explored area is larger. On the other hand it is plausible, that the aerial exploration exposes only few details. In particular, exploration inside the workshop halls is fully excluded. At the time the UAV has explored the whole exploration area, the UGV starts to op-eration. In this experiment, the UGV was controlled via RC, but the enviornmental information gathered by the UAV can be used to automatically generate a secure and short path for the UGV.
Figure 12 illsutrates the result of the mapping process. The color decodes the height of each data point. The red line shows the trajectory of the UAV, which flew over the area at an altitude of approximately 30 meters. The trajectory of the UGV is drawn in blue. It starts at the left hand side of Figure 12 travells along the driveway on the bottom of the Figure to the main entrance of the hall at the right hand side. It explores the complete building from the inside and exits through a side exit. At that point the Place Recognition Algorithm detects the first loop closure. Before it returns to the starting position, it turns right to explore the second building in the middle of the map. After reentering the driveway, multiple additional loop closing contraints are introduced.
6. CONCLUSION
As shown, the mapping system is capable of mapping large scale mixed indoor / outdoor scenarios in structured and unstructured environments. Furthermore it is possible to exchange map data reliable between independent agents to share information and use this as prior information for further exploration. It was shown, that the system is capable of handling information from differ-ent sources - ground based and aerial - and combine those into a consistent map of the environment.
Furthermore the communication experiments have shown that map updates are mainly send to the ground station during single hop phases. Also we are able to transport topics requiring a rela-tive low bandwidth like smaller h.264 streams during multi-hop phases. To avoid long running map transfers when bandwidth re-quirements can not be full-filled further work on the QoS mecha-nism of the framework are necessary. Also the message delivery rate could be improved when a Forward Error Correction method would be integrated.
REFERENCES
Dellaert, F., 2005. Square root sam. In: S. Thrun, G. S. Sukhatme and S. Schaal (eds), Robotics: Science and Systems, The MIT Press, pp. 177–184.
Dellaert, F. and Kaess, M., 2006. Square root sam: Simultaneous localization and mapping via square root information smoothing.
I. J. Robotics Res.25(12), pp. 1181–1203.
0 50 100 150 200 250 300 350 400 450 500
Figure 7. Single Hop Mapping, Video Topic via TCP, QoS enabled
0 20 40 60 80 100 120 140 160 180 200 220 240 260 280 300 320 340 360 380
Robot State Topic, UDP, Setpoint Rate 1H z(0.05K B s ) Camera Topic, TCP, Setpoint Rate 10H z(0.8M B
s ) Map Update
AreaA AreaB AreaC
Figure 8. Single Hop Mapping, Video Topic via TCP, QoS disabled
0 20 40 60 80 100 120 140 160 180 200 220 240 260 280 300 320 340 360 380
Camera Topic, TCP, Setpoint Rate 10H z(0.8M B s )
Figure 9. Multi-Hop Mapping, Video Topic via TCP, QoS enabled
0 20 40 60 80 100 120 140 160 180 200 220 240 260 280 300 320 340 360 380
Robot State Topic, UDP, Setpoint Rate 1H z(0.05K B s )
Figure 10. Multi-Hop Mapping, Video h.264 Stream, QoS enabled
0 20 40 60 80 100 120 140 160 180 200 220 240 260 280 300 320 340 360 380
Camera Topic, TCP, Setpoint Rate 5H z(0.4M B s )
Velodne Topic, TCP, Setpoint Rate 10H z(2.7M B s )
AreaA AreaB AreaC
Figure 12. Map of rural wooded area with two workshop halls generated by a team of UGV / UAV
Facebook, I., 2016. Zstandard - fast real-time compression algo-rithm.https://github.com/facebook/zstd.
Grisetti, G., Kmmerle, R., Stachniss, C. and Burgard, W., 2010. A tutorial on graph-based slam. IEEE Intell. Transport. Syst. Mag.
2(4), pp. 31–43.
Grisetti, G., Stachniss, C. and Burgard, W., 2007. Improved tech-niques for grid mapping with rao-blackwellized particle filters.
IEEE Trans. Robotics23(1), pp. 34–46.
H¨ahnel, D., Burgard, W., Fox, D. and Thrun, S., 2003. An effi-cient fastslam algorithm for generating maps of large-scale cyclic environments from raw laser range measurements. In: IROS, IEEE, pp. 206–211.
Harms, H., Schattenberg, J., Schmiemann, J. and Frerichs, L., 2016. A communication layer for uav/ugv swarm applications. In: 5th International Conference on Machine Control & Guid-ance.
Huang, A. S., Olson, E. and Moore, D. C., 2010. Lcm: Lightweight communications and marshalling. In:IROS, IEEE, pp. 4057–4062.
Lu, F. and Milios, E. E., 1997. Globally consistent range scan alignment for environment mapping. Auton. Robots4(4), pp. 333–349.
Maruyama, Y., Kato, S. and Azumi, T., 2016. Exploring the per-formance of ros2. In:EMSOFT, ACM, pp. 5:1–5:10.
Olson, E., 2009. Recognizing places using spectrally clus-tered local matches. Robotics and Autonomous Systems57(12), pp. 1157–1172.
Olson, E., Leonard, J. J. and Teller, S. J., 2006. Fast iterative alignment of pose graphs with poor initial estimates. In:ICRA, IEEE, pp. 2262–2269.
Pojda, J., Wolff, A., Sbeiti, M. and Wietfeld, C., 2011. Perfor-mance analysis of mesh routing protocols for uav swarming ap-plications. In:ISWCS, IEEE, pp. 317–321.
PrismTech, 2017. OpenSplice DDS.http://www.prismtech. com/dds-community.
Quigley, M., Conley, K., Gerkey, B. P., Faust, J., Foote, T., Leibs, J., Wheeler, R. and Ng, A. Y., 2009. Ros: an open-source robot operating system. In:ICRA Workshop on Open Source Software.
Real-Time Innovations, 2017. RTI Connext DDS Professional. http://www.rti.com/products/dds/index.html.
Schmiemann, J., Harms, H., Schattenberg, J. and Frerichs, L., 2016. Examination of methods for error-tolerant data associa-tion between independent relative pose graphs during multi-agent slam. http://mcg2016.irstea.fr/wp-content/uploads/ 2017/05/MCG2016_paper_9.pdf.
Schwarz, M., Beul, M., Droeschel, D., Schller, S., Periyasamy, A. S., Lenz, C., Schreiber, M. and Behnke, S., 2016. Supervised autonomy for exploration and mobile manipulation in rough ter-rain with a centaur-like robot.Front. Robotics and AI.
Smith, R., Self, M. and Cheeseman, P., 1990. Estimating un-certain spatial relationships in robotics. In: I. J. Cox and G. T. Wilfong (eds),Autonomous Robot Vehicles, Vol. 8, pp. 167–193.
Thrun, S., Liu, Y., Koller, D., Ng, A. Y., Ghahramani, Z. and Durrant-Whyte, H. F., 2004. Simultaneous localization and map-ping with sparse extended information filters. I. J. Robotic Res.
23(7-8), pp. 693–716.