DTM GENERATION FROM TERRASAR-X USING TIN ALGORITHM IN PAPUA
ISLAND, INDONESIA
Danang Budi Susetyo a, Moh. Fifik Syafiudin a, Yudo Prasetyo b
a Center of Topographic Mapping and Toponym, Geospatial Information Agency, Indonesia - (danang.budi, moh.fifik)@big.go.id b Dept. of Geodetic Engineering, Diponegoro University, Semarang, Indonesia – [email protected]
Commission VI, WG VI/4
KEY WORDS: DTM, TerraSAR-X, TIN, Indonesia
ABSTRACT:
One of the outputs of mapping activity in Indonesia is Digital Terrain Model (DTM). DTM generated by stereo plotting with photogrammetry concept, where Indonesia Topography Map at medium scale using Synthetic Aperture Radar (SAR), and currently, one of SAR data that used to produce Indonesian Topographic Map is TerraSAR-X.
This paper discusses about DTM generation in Papua Island, Indonesia, using TerraSAR-X, which is part of topographic mapping activity on a scale of 1:25,000. We choose Triangulated Irregular Network (TIN) as the interpolation method. After TIN was build and edited, we have to check to produce good DTM. Quality control involves visual and statistic quality.
In statistic aspect, we compare Linear Error 90% (LE90) value to map accuracy that regulated in Head of Geospatial Information Agency Rules Number 15 Year 2014. We use 50 test points for 59 map sheets in scale 1:25,000 (the area around 10,000 km2). To validate the elevation, we interpret test points elevation in the stereo model, then we compare to an elevation in DTM. LE90 value is 9.75 m, so we can conclude that DTM elevation still in class 3. In a visual aspect, we must edit the DTM. There are 9 parameters in visual quality control, and to meets these parameters, we can use three methods: add and reduce mass point, move mass point, and add breakline. Editing to the DTM can make we sure that it meets the quality standard in scale 1:25,000 data.
1. INTRODUCTION
One of the outputs of mapping activity in Indonesia is Digital Terrain Model (DTM), which is a part of hypsography feature extraction in national base map mandated in Indonesian Law Number 4 Year 2011 about Geospatial Information. DTM generated by stereo plotting with photogrammetry concept, where Indonesia Topography Map at large scale using aerial photo, whereas at medium scale using Synthetic Aperture Radar (SAR) (Susetyo et al, 2016).
One of the important applications of SAR data is DEM generation, where the final product from SAR processing is Digital Surface Model (DSM). DSM from interferometry is the variation in phase difference from pixel to pixel that can be converted into relative change in surface elevation (INTERMAP, 2009). Another method, radargrammetry, requires image acquired with varying incidence angles, and to acquire good geometry for radargrammetry pairs, the intersection angle between the reference image and matched image should have enough angles for the observed parallax which is used to determine the terrain elevation (Yu et al., 2011). Interferometry suffered from low coherence over highly vegetated areas, but it showed high precision over the rest of areas, whereas radargrammetry gave consistent results over the entire areas (D’Ozouville et al., 2008).
SAR technology applied in Indonesia since 1993, when Indonesian Geospatial Information Agency (it was called Bakosurtanal) using ERS-1 that supplied from Pare-pare ground station, Indonesia (Bakosurtanal and Mapiptek, 2009). The ground station is managed by Indonesian National Institute of Aeronautics and Space (LAPAN).
Currently, one of SAR data that used to produce Indonesian Topographic Map is TerraSAR-X. TerraSAR-X is Germany’s
public-private partnership (PPP) between DLR and EADS Astrium GmbH (Werninghaus and Buckreuss, 2009). Based on some research, TerraSAR-X has high resolution and good accuracy (Weber et al., 2006), (Dana et al., 2008), (Nonaka et al., 2008), (Sefercik et al., 2012), (Capaldo et al., 2013), (Balz et al., 2014), (Hennig et al., 2015), (Prihanggo et al., 2015). DSM generation from TerraSAR-X can also use interferometry or radargrammetry. The short wavelength of the TerraSAR-X satellite causes temporal incoherence for repeat pass interferometry, thus, the satellite’s data is not well suited to derive reliable surface models in many regions of the world using interferometry, so radargrammetry also implemented and enables the generation of DSM with vertical height accuracy of 5 to 10 meters (LE90) for slopes smaller than 20° based on Stripmap mode data (Kiefl et al., 2010).
Input data from TerraSAR-X to produce Indonesian Topographic Map are Orthorectified Radar Image (ORRI) and DSM. ORRI and DSM used to extract hypsography feature on the ground (bare earth) (Susetyo and Perdana, 2015), so we can get the mass point, breakline, and the stream for interpolated into DTM.
This paper discusses DTM generation in Papua Island, Indonesia, using TerraSAR-X, which is part of topographic mapping activity on a scale of 1:25,000. The scope of this paper only limited in DTM generation from stereo plotting method and does not discuss SAR processing to get final ORRI and DSM. If be detailed, the aspects discussed are hypsography feature extraction in stereo plotting, DTM generation method, the editing process, and DTM quality control so we get DTM in Papua Island that has good quality in geometry and visual. This paper will give some overview about mapping method in Indonesia, especially in medium scale, such as stereo plotting using SAR data, DEM generation, until quality control
2. DATA USED
As discussed above, the input data from TerraSAR-X are ORRI and DSM. Examples of ORRI and DSM can be seen in Figure 1, where ORRI located on the left side (figure a), and DSM on right side (figure b).
Because we use photogrammetry technique to get the 3D model, of course, we need matched image which has overlap with the reference image, in this case, is ORRI. Although using the principle of photogrammetry, but SAR and aerial photo have a different method. If using the aerial photo we have to measure parallax between two photos to converted into height information, but 3D model generation using SAR data is by getting parallax from a height of DSM to be added to ORRI, so we can build stereo mate (Susetyo et al, 2016). Stereo mate will be a pair of ORRI image to be processed in photogrammetry stereo workstation to build a 3D model (Mulyana, 2007).
Figure 1. (a) ORRI, (b) DSM (Susetyo et al, 2016)
3. STUDY AREA
Area examined in this paper is Papua Island, Indonesia, consisting of Mappi and Merauke Regency. That is one of mapping area in 2016. The study area is 59 sheets in scale 1:25,000, as described in Figure 2.
Figure 2. Study area
Like most other Papua region, this area also covered by stream and swamp, as described in Figure 3. The stream is main transportation in Papua, where Digul stream is one of the biggest in Papua and Indonesia. Around the stream, there are still many swamps.
Dominated by swamps and rivers becomes the most challenge in stereo plotting, including in hypsography features extraction. It is because interpretation is more difficult to do. One of the challenges is difficulties to distinguish between puddles of the swamp and the mainland, so it is more difficult to plotting mass point. In hydrography features extraction, it is difficult enough to plot swamp boundary and seasonal stream. Of course, it will affect in DTM generation because the quality of DTM depends on stereo plotting product. Because of that, operator skill to interpret the image is very needed.
Figure 3. Sample of the swamps
4. METHODOLOGY
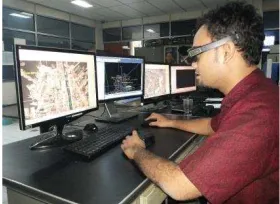
As mentioned in chapter 2, we use ORRI and stereo mate to be processed in photogrammetry stereo workstation to build a 3D model. We can use a combination of stereo plotting and GIS software to extract topographic features from the 3D models. The advantage using stereo plotting is we get 3D data with high accuracy and desired objects (Pranadita and Harintaka, 2013). Stereo plotting process using photogrammetry stereo workstation can be seen in Figure 4.
Figure 4. Stereo plotting process (picture taken from Center of Topographic Mapping and Toponym presentation)
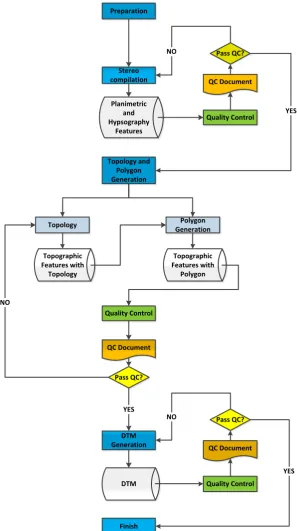
Vector data in stereo plotting can be divided into planimetric and hypsography features. Planimetric features are building, transportation, and vegetation boundary, while hypsography features are the mass point, breakline, and stream. After extract topographic features (in line shape) from stereo plotting process, the next step is topology and polygon generation. Topology is used to ensure that spatial characteristics and interrelations of geodatabase features can be used to model real geographic features (USGS, 2012). After we make sure that no error in topology, we can start to generate DTM from hypsography features. Methodology illustration in the flowchart can be seen in Figure 5.
In this paper, we choose Triangulated Irregular Network (TIN) as interpolation method. TIN was chosen because it doesn’t change the accuracy of vector data, it just connects each vertex in triangulation. Furthermore, when we convert to raster data, visualization of DEM result is better than the other methods, such as IDW or Kriging, beside the TIN accuracy is good enough compare with the others (Susetyo and Syetiawan, 2016). After TIN was build and edited, we have to check to produce good DTM. Quality control involves visual and statistic quality (Podobnikar, 2009). Visual quality associated with density and consistency, and statistic quality associated with accuracy (Karel et al., 2006). Quality control is a part of mapping process to detect deviations so that Quality Assurance (QA) can be done to ensure these data meet the standards of quality (Wisnu et al., 2014).
Preparation
Stereo compilation
Planimetric and Hypsography
Features
Quality Control QC Document
Pass QC? NO
Topology and Polygon Generation
YES
Polygon Generation Topology
Topographic Features with
Topology
Topographic Features with
Polygon
Quality Control
QC Document
Pass QC? NO
DTM Generation
DTM Quality Control
QC Document Pass QC? NO
YES
Finish
YES
Figure 5. Part of Indonesian Topographic Mapping business process (adapted from Mapping Terms of Reference)
5. RESULT AND DISCUSSION 5.1 DTM Generation
DTM generated by drop the elevation of hypsography features from the surface to the terrain. If plotting area covered by vegetation or building, so terrain elevation refers to surrounding open area.
The hypsography features to generate DTM are the mass point, breakline, and stream. Mass point placed randomly, and mass point density depends on topographic condition, while breakline used as a boundary when there are extreme changes in
5.2 DTM Accuracy Validation
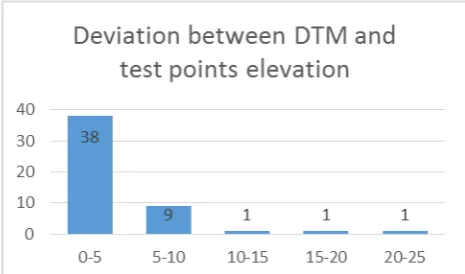
If we use SAR data in stereo plotting, there is a possibility that each operator has different elevation interpretation than the others. As a validation, we use test points to make sure that hypsography features elevation still meet the tolerances. This step is a part of DTM quality control in statistic aspect. We use 50 test points to validate DTM accuracy, and spread them randomly. We measure the elevation of the point in the stereo model and then compared to an elevation in DTM. Overall, there is no significance deviation value between DTM and test points elevation. Only 3 points have difference more
DTM and test points elevation in the histogram can be seen in Figure 6.
Figure 6. The deviation between DTM and test points elevation
The deviation between elevation in the stereo model and DTM is used to calculate RMSE and LE90. LE90 is used to determine the vertical accuracy. Validation refers to Head of Geospatial Information Agency Rules Number 15 Year 2014 about Base Map Accuracy. We compare Linear Error 90% (LE90) value to map accuracy that regulated in Head of Geospatial Information Agency Rules Number 15 Year 2014. To get LE90, first we must get Root Mean Square Error (RMSE) with this equation:
RMSE =
(1)
where:
Δh = elevation differences between DTM and test point
n = the number of test points So we can get LE90 with this equation:
LE90 = 1.6499 x RMSE (2) After that, we can compare that LE90 value to vertical accuracy in Head of Geospatial Information Agency Rules Number 15 Year 2014, as outlined in Table 1.
Class 1 Class 2 Class 3 Table 1. Indonesia Topographic Map accuracy
Based on Equation 1 and 2, we can get RMSE and LE90 as elevation still in class 3. If that data is in class 3, it can conclude that DTM meets the accuracy standard requirement in scale 1:25,000, but still in minimum accuracy level. Basically, there is no significant effect of accuracy class difference, it is just the better of accuracy class, the data is better.
Class 1 Class 2 Class 3
5 m 7,5 m 12,5 m
Table 2. Vertical accuracy in scale 1:25,000
5.3 DTM Editing
After we make sure that DTM meets the accuracy standard, we can start to DTM editing. This step is a part of quality control to produce good DTM in the visual aspect.
The parameters in visual quality in DTM quality control are: a. The DTM fineness is consistent
b. No elevation under 0 (zero), except depression and basin c. Basin and depression with 10 m elevation differences was
built
d. No extreme elevation (spikes) e. Water body has the same elevation f. DTM along the stream flow smoothly
g. Hilltop and ridge has no extreme value compare with surrounding height
h. Mass point density in accordance with the topography i. DTM profile is smooth and logical
Refers to those parameters, DTM must be edited to produce good visual quality. Editing doesn’t change topography significantly because still refers to DTM elevation that generated first. In general, editing must be done to the waterfront, because triangulation from adjacent mass point and stream make TIN looks rough.
We can use some methods to edit DTM: add and reduce mass point, move mass point, and add breakline. These methods can make DTM smoother visually, so can meets parameter a, d, f, g, h, and i. Other parameters, b, c, and e, must be met in stereo plotting step.
We can editing DTM by some methods: a. Add or reduce mass point
This is the first option in DTM editing. We can add or reduce mass point according to the needs. It is useful to make DTM profile better in visual, but it must still meet the density standard. Indonesia topography map scale 1:25,000 requires distance at least 10 m (for steep topography) and at most 100 m (for the coastal area or sloping topography). Example for add or reduce mass point can be seen in Figure 7.
b. Move mass point
Beside add and reduce, move mass point also can be an option to editing DTM. Mass point placement randomly enables to produce rough DTM, especially around the water body. Editing mass point position can make DTM smoother. Example for move mass point can be seen in Figure 8. c. Add breakline
Another option in DTM editing is added breakline. Breakline can be used when there is elevation change, for example in around water body. Breakline can help to make DTM smoother, especially because vertices from breakline is closer compare with mass point. Example for add breakline can be seen in Figure 9.
(a) Before editing (b) After editing Figure 7. Add and reduce mass point
(a) Before editing (b) After editing
Figure 8 Move mass point
(a) Before editing (b) After editing
Figure 9. Add breakline
6. CONCLUSION
One of the outputs of mapping activity in Indonesia is Digital Terrain Model (DTM). DTM generated by stereo plotting with photogrammetry concept, where Indonesia Topography Map at large scale using aerial photo, whereas at medium scale using Synthetic Aperture Radar (SAR). Currently, one of SAR data that used to produce Indonesian Topographic Map is TerraSAR-X.
DTM generated must meets the quality standard in statistic and visual aspect. In statistic aspect, we must measure LE90 value to decide the vertical accuracy of the data. We can decide quality in visual aspect with some parameters, and to edit DTM we can use three methods: add and reduce mass point, move mass point, and add breakline.
Data used in this paper is half of Papua Island, Indonesia. In a statistical aspect, LE90 value is 9.75 m, so it can be classified to class 3 based on Head of Geospatial Information Agency Rules Number 15 Year 2014 about Base Map Accuracy. In a visual aspect, quality is met after editing has been done to the DTM.
ACKNOWLEDGEMENTS
Thanks are going to Center of Topographic Mapping and Toponym, for providing Topographic database from mapping activity in 2016, especially in Papua Island. We also thank to PT. Geopranata Cipta as mapping private company that did the mapping project in that area.
REFERENCES
Bakosurtanal, and Mapiptek. 2009. Survei Dan Pemetaan Nusantara. Jakarta: BAKOSURTANAL dan MAPIPTEK.
Balz, Timo, Xueyan He, Lu Zhang, and Mingsheng Liao. 2014. “TerraSAR-X Stereo Radargrammetry for Precise DEM Generation in South-East Asia.” Igarss 2014, no. 1: 1–5. Capaldo, Paola, Mattia Crespi, Francesca Fratarcangeli, Andrea
Nascetti, Francesca Pieralice, Martina Porfiri, and Thierry Toutin. 2013. “DSMs Generation from TerraSAR-X High Resolution Spotlight Imagery: Evaluation of Radargrammetric Approaches Implemented in the Scientific Software Sisar.” 5. TerraSAR-X / 4.
DLR – Oberpfaffenhofen. http://terrasar-
x.dlr.de/papers_sci_meet_5/final/TSX_2-2_topography/Crespi-et-All.pdf.
D’Ozouville, Noémi, Benoît Deffontaines, Jérôme Benveniste, Urs Wegmüller, Sophie Violette, and Ghislain de Marsily. 2008. “DEM Generation Using ASAR (ENVISAT) for Addressing the Lack of Freshwater Ecosystems Management, Santa Cruz Island, Galapagos.” Remote Sensing of Environment 112 (11):
Geospatial Information Agency. 2014. “Head of Geospatial Information Agency Rules Number 15 Year 2014 about Base Map Accuracy.” Cibinong.
Hennig, Simon D., Wolfgang Koppe, Karlheinz Gutjahr, Roland Perko, and Hannes Raggam. 2015. “Evaluation of Radargrammetry DEMs Based on TerraSAR-X Staring SpotLight Imagery.” DGPF Tagungsband, 1–8.
INTERMAP. 2009. “Interferometric Synthetic Aperture Radar.” Venezia.
Karel, W, N Pfeifer, and C Briese. 2006. “DTM Quality Assessment.” International Archives of Photogrammetry, Remote Sensing, and Spatial Information Science XXXVI (July).
Kiefl, N, W Koppe, and S D Hennig. 2010. “Terrasar-X Stereo Digital Elevation Models for Complex Terrain Conditions in Alpine Regions and Its Suitability for Orthorectification Purposes of Optical and Sar Imagery.” In ISPRS TC VII Symposium, XXXVIII:333–36. Vienna, Austria.
Mulyana, Ade Komara. 2007. “Analisis Tekstur Citra IFSAR Untuk Ekstraksi Fitur Rupabumi.” In Ekstraksi Unsur Rupabumi Dan Studi Deformasi Dari Citra Radar Dan ASTER, 1–12. Cibinong: Badan Koordinasi Survei dan Pemetaan Nasional (BAKOSURTANAL).
Nonaka, T, Y Ishizuka, N Yamane, T Shibayama, S Takagishi, and T Sasagawa. 2008. “Evaluation of the Geometric Accuracy of Terrasar-X.” The International Archives of the Photogrammetry, Remote Sensing and Spatial Information Sciences XXXVII (Part B7): 135–40. Podobnikar, Tomaz. 2009. “Methods for Visual Quality
Assessment of a Digital Terrain Model.” S.a.p.i.en.s 2.2 2 (October 2012).
Pranadita, Sekar, and Harintaka. 2013. “Pembuatan Model Elevasi Digital Dari Stereoplotting Interaktif Foto Udara Format Sedang Dengan Kamera Digicam.” Jurnal Ilmiah Geomatika 19 (2): 101–5.
Prihanggo, Maundri, Arga Geofana, and Ade Komara Mulyana. 2015. “Uji Akurasi Ketelitian Vertikal DSM TerraSAR-X (Studi Kasus : Kota Banjarmasin Dan Kota Palangkaraya).” In Forum Ilmiah Tahunan Ikatan Surveyor Indonesia. Malang.
Republik Indonesia. 2011. Indonesian Law Number 4 Year 2011 about Geospatial Information. Jakarta.
Sefercik, Umut G, Alexander Schunert, Uwe Soergel, and Kinichiro Watanabe. 2012. “Validation of DEMs Derived from High Resolution SAR Data : A Case Study on Barcelona.” In ISPRS Annals of The Photogrammetry, Remote Sensing and Spatial Information Sciences, I-7:49–54. Melbourne, Australia: XXII ISPRS Congress, 25 August - 01 September 2012.
Susetyo, Danang Budi, and Aji Putra Perdana. 2015. “Uji Ketelitian Digital Surface Model (DSM) Sebagai Data
Dasar Dalam Pembentukan Kontur Peta Rupabumi Indonesia (RBI).” In Seminar Nasional Penginderaan Jauh, 1–8. Bogor: Lembaga Penerbangan dan Antariksa Nasional.
Susetyo, Danang Budi, M Fifik Syafiudin, and Aji Putra Perdana. 2016. “Stereokompilasi Unsur Rupabumi Skala 1:25.000 Menggunakan Data TerraSAR-X Dan Citra SPOT-6.” In Seminar Nasional Penginderaan Jauh, 1–8. Depok: Lembaga Penerbangan dan Antariksa Nasional. Susetyo, Danang Budi, and Agung Syetiawan. 2016.
“Perbandingan Metode Interpolasi Terhadap Hasil Pembentukan Digital Terrain Model ( DTM ).” In Seminar Nasional 3rd CGISE Dan FIT ISI 2016. Yogyakarta: Departemen Teknik Geodesi Fakultas Teknik Universitas Gadjah Mada.
USGS. 2012. Digital Database Architecture and Delineation Methodology for Deriving Drainage Basins , and a Comparison of Digitally and Non-Digitally Derived Numeric Drainage Areas. Reston, Virginia.
Weber, Marco, Jorg Herrmann, Irena Hajnsek, and Alberto Moreira. 2006. “TerraSAR-X and TanDEM-X: Global Mapping in 3D Using Radar.” In Proc. 2nd Int. Transactions on Geoscience and Remote Sensing 60 (5): 1–4.
Wisnu, Batoro, Akhmad Riqqi, Agung B Harto, and Ade K Mulyana. 2014. “Pengembangan Prosedur Kontrol Kualitas Produksi Peta Rupabumi Indonesia Skala Besar (Studi Kasus: Peta Rupabumi Indonesia Skala 1:5.000).” In Conference on Geospatial Information Science and
Engineering “Menuju Pengelolaan Informasi Secara Spasial,” 1–12. Yogyakarta: Jurusan Teknik Geodesi Universitas Gadjah Mada.
Yu, Jung Hum, Xiaojing Li, and Linlin Ge. 2011. “Radargrammetric DEM Generation Using ENVISAT Simulation Image and Reprocessed Image.” International Geoscience and Remote Sensing Symposium (IGARSS), 2980–83. doi:10.1109/IGARSS.2011.6049842.