ANALYSING AGRICULTURAL DROUGHT VULNERABILITY AT SUB-DISTRICT
LEVEL THROUGH EXPOSURE, SENSITIVITY AND ADAPTIVE CAPACITY BASED
COMPOSITE INDEX
C.S. Murthya, B. Laxmanb, M.V. R. Sesha Saic, P.G.Diwakard
National Remote Sensing Centre, ISRO, Hyderabad, India, a corresponding author - [email protected], b [email protected], c [email protected], d [email protected]
Commission VIII
KEY WORDS: agricultural drought, composite index, NDVI, vulnerability, natural hazards
ABSTRACT:
Information on agricultural drought vulnerability status of different regions is extremely useful for implementation of long term drought management measures. A quantitative approach for measuring agricultural drought vulnerability at sub-district level was developed and implemented in the current study, which was carried-out in Andhra Pradesh state, India with the data of main cropping season i.e., kharif. The contributing indicators represent exposure, sensitivity and adaptive capacity components of vulnerability and were drawn from weather, soil, crop, irrigation and land holdings related data. After performing data normalisation and variance based weights generation, component wise composite indices were generated. Agricultural Drought Vulnerability Index (ADVI) was generated using the three component indices and beta distribution was fitted to it. Mandals (sub-district level administrative units) of the state were categorised into 5 classes – Less vulnerable, Moderately vulnerable, Vulnerable, Highly vulnerable and Very highly vulnerable. Districts dominant with vulnerable Mandals showed considerably larger variability of de-trended yields of principal crops compared to the other districts, thus validating the index based vulnerability status. Current status of agricultural drought vulnerability in the state, based on ADVI, indicated that vulnerable to very highly vulnerable group of Mandals represent 54% of total Mandals and about 55% of the agricultural area and 65% of the rainfed crop area. The variability in the agricultural drought vulnerability at disaggregated level was effectively captured by ADVI. The vulnerability status map is useful for diagnostic analysis and for formulating vulnerability reduction plans.
1.0 INTRODUCTION
Indian agriculture continues to be sensitive to drought conditions despite technological developments in weather analysis and crop management. Agricultural drought management is closely related to sustainable development and food security. Climate change, land use changes and natural resources degradation have aggravated the agricultural vulnerability to drought conditions in the country. Information on agricultural drought vulnerability levels of different areas is extremely useful for the implementation of long term drought management measures. Different areas are differentially exposed to drought and have different levels of vulnerability mainly due to skewed development processes of environment, socio-economic, infrastructure etc. Assessment of agricultural drought vulnerability is important from multiple perspectives - drought management, crop insurance, climate change etc.
Following the IPCC (2007) framework, agricultural drought vulnerability is defined as exposure, sensitivity and adaptive capacity of an agricultural area to the situation of inadequate soil moisture availability during the season. Crop areas are exposed to hazardous weather –low rainfall, high temperature etc. The sensitivity and coping ability of the agricultural area, when exposed to drought situation or potentially harmful crop stress situations determines the vulnerability of the area. Exposure, sensitivity and adaptive capacity together determine the agricultural drought vulnerability which is a relative term and can be represented in a predefined scale. The coping ability or adaptive capacity of agricultural area to agricultural drought
is determined by a number factors related to crop growing environment. Thus, agricultural drought vulnerability differs from place to place.
Since drought is a phenomenon interlinked with multiple processes, increasing emphasis in recent years is on the development and use of composite indices for vulnerability assessment. Early work on more comprehensive way of developing and using composite indices for agricultural drought assessment was by Wilhelmi and Wilhite (2002). They used four parameters related to climate, soil, land use and irrigation support and evolved a numerical weighing scheme to generate agricultural drought vulnerability index. Eriyagama et al. (2010), carried-out preliminary analysis of vulnerability mapping to study the impact of climate change on water resources and agriculture in Sri Lanka, by assigning weights to multiple parameters at district level. Mrutyunjay and Mamata (2011), analysed drought vulnerability, coping ability and residual risk in the selected blocks of Bolangir district, Odisha state, India, using a set of bio-physical and socio-economic indicators. The composite index was generated based on indexing method. Ravindranath et al. (2011), adopted index based approach for assessing agricultural vulnerability at district level in the NE region of India, using the secondary data. The weights for multiple parameters were derived by expert consultation and the weights were assumed to be equal across indicators. Xiaoqian et al. (2013), brought out a 3 dimensional model of drought vulnerability with 3 components namely exposure, sensitivity and adaptive capacity, in China.
Mapping agricultural drought vulnerability involves identification of areas or administrative units that are sensitive or fragile to agricultural drought. Agricultural drought vulnerability is determined by a number of factors related to weather, soil, water and crop. Studies reported on drought vulnerability mapping and analysis are based on one or two parameters like rainfall, land use, % irrigated area, crop yield etc. These studies have brought-out the strengths of individual parameters to assess drought vulnerability. Since agricultural drought vulnerability is determined by a number of parameters/indices, combination of different parameters/indices address the multi-dimensional nature of vulnerability. A composite index derived from multiple parameters provides a robust and scientific approach for mapping agricultural drought vulnerability. Further, all the components of vulnerability namely exposure, sensitivity and adaptive capacity need to be addressed to generate a robust vulnerability index. Most of the studies on drought vulnerability have been carried-out at macro level, whereas for developing effective drought management measures, vulnerability information is required at disaggregated level.
The specific objectives of the current study are; (1) to generate composite index of agricultural drought vulnerability based on exposure, sensitivity and adaptive capacity indices and (2) to study the current status of agricultural drought vulnerability at sub-district level.
2. Study area
The study was carried-out in Andhra Pradesh state, India. The state has tropical to sub-tropical climate and represents diverse crop growing environments. Kharif is the main cropping season and starts from June and ends in November. In kharif season, the normal cropped area is about 50 L ha. Rice, jowar, groundnut, cotton, maize etc. are the principal crops in kharif season. Drought is a frequent phenomenon in the state. In recent years, the state had experienced agricultural drought conditions leading to reduction in cropped area and crop yield of rainfed crops in 2002, 2006, 2011 and 2012 (Murthy et al. 2010, www.nrsc.gov.in). The state has 13 districts and the
administrative units within the districts are called “Mandals”.
On an average, each district has got about 50 Mandals. The present study was carried-out at Mandal level, covering 597 Mandals of 11 districts. Nellore district, the south coastal district and part of Chittoor district were excluded from the study, because these two areas are largely covered by different monsoon season and hence the cropping pattern/crop calendar is slightly different from rest of the districts.
3. Methodology
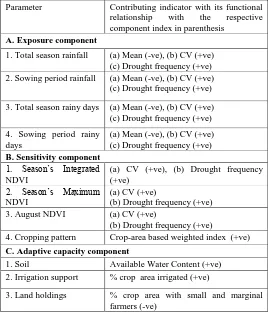
Construction and use of composite indices from multi-dimensional data for measuring spatial differentials in social and economic development issues have been widely practiced (Iyengar and Sudershan 1982; OECD 2008). In this study, agricultural drought vulnerability index was derived from the composite indices constructed for each of the three components of vulnerability – exposure, sensitivity and adaptive capacity. Different parameters and the corresponding contributing indicators under each component were presented in Table 1.
Table 1 Parameters and contributing indicators of exposure, sensitivity and adaptive capacity components
Parameter Contributing indicator with its functional relationship with the respective component index in parenthesis
4. Cropping pattern Crop-area based weighted index (+ve) C. Adaptive capacity component
1. Soil Available Water Content (+ve)
2. Irrigation support % crop area irrigated (+ve)
3. Land holdings % crop area with small and marginal farmers (-ve)
Exposure indicates the nature, extent, duration and frequency of drought conditions on the agricultural areas of a region. Meteorological drought is the primary cause of agricultural drought occurrence and its progression in the season over agricultural areas. Rainfall data during the south west monsoon season (June to September) during the recent 12 years (year 2001 to 2012), was analysed to generate different indicators of exposure. Along with rainfall, data on rainy days was also considered to account for the distribution of rainfall. The definition of rainy day is adopted from the standard practice prescribed by India Meteorological Department (IMD) which considers any day with greater than or equal to 2.5 mm of rainfall as a rainy day (www.imd.gov.in). Crop sowing period or early season drought is widely prevalent in the study area state due to uncertainties in the time of monsoon onset, rainfall amount and distribution. Therefore, rainfall and rainy days during July month, which is very crucial for crop sowing and hence determines the early-season drought intensity, was also considered as one of the parameters in the exposure component. Thus, there are 4 parameters – (1) total season rainfall, (2) total season rainy days, (3) sowing period rainfall and (4) sowing period rainy days, to represent the exposure component of the vulnerability model. Daily rainfall data from 1st June to 30th September, for the time series period 2001-2012, for all the Mandals of the state, was collected from Bureau of Economics and Statistics (BES), Government of Andhra Pradesh. Mandal wise mean and Coefficient of Variation (CV) of rainfall and rainy days were computed for the total season and sowing period. Drought frequency indicating the number of years under drought conditions during the 12-year period was computed for both the periods of the season separately. Less than 75% of normal rainfall was considered as drought for computing drought frequency. This criteria of rainfall has been recommended and practiced by IMD in India (www.imd.gov.in). Same criteria were extended to rainy days,
to generate drought frequency based on rainy days. Thus, based on rainfall and rainy days during total season and crop sowing month, 12 indicators of exposure, as shown in Table 1, were derived. Xiaoqian et al. (2013), used SPI alone to represent drought exposure. Ravindranath et al. (2011) used rainfall variability index as proxy to climate change exposure.
Sensitivity is the degree to which the crops are affected by moisture stress due to drought conditions. Sensitivity of crop growing environment to agricultural drought conditions is the strong determinant of vulnerability of the agricultural area. Sensitivity component, in this study, represented the parameters
related to cropping pattern, crops’ response to weather
conditions during the season. Use of remote sensing technology for assessing the response of agricultural crops to weather variations has been well recognised. Satellite derived vegetation indices, particularly NDVI, has been successfully used for monitoring crops, agricultural areas, stress detection etc. Satellite derived phonological metrics were used to evaluate the terrestrial ecosystems (Myneni et al. 1997, Lee et al. 2002, Sakamoto et al. 2005, Bradely et al. 2007). Wu et al. (2008) investigated the phenology over crop lands in China, using time series NDVI data sets and concluded that significant changes took place in the start of growing season in the past 20 years. Phenological observations measure the response of vegetation to meteorological and environmental factors. Phenological data series indicate the evidence of vulnerability.
In this study, Terra MODIS 500m NDVI monthly composites, generated under the NADAMS project of NRSC (www.nrsc.gov.in), were used. Monthly NDVI composites from August-October, representing active growing and peak vegetative phase of kharif season, for the time series period 2001-2012, were used to derive the indicators of sensitivity. Agricultural area mask, generated under the same project of NRSC, was used to result in agricultural area NDVI. Two
metrics namely Season’s Maximum NDVI (SMN) and Season’s
Integrated NDVI (SIN) were derived for each year. These two metrics adequately describe the biomass and vigour over the agricultural of the study area. SMN was derived by summation of 3 months NDVI. August represents early part of crop growth and remaining two months represent active and maximum crop growth periods. Therefore, the sum of three months NDVI captures the most part of the total growth of the crops. SMN represents the maximum NDVI of the three months. Using the images of SMN, SIN and Mandal shape files, Mandal wise averages of SMN and SIN were extracted for each year. The CV of these two metrics were computed and taken as indicators of sensitivity. Higher CV of SMN and SIN indicates more sensitivity of agricultural area to weather variations.
Drought frequency based on SMN and SIN was computed by generating Standardised SMN and SIN for each year. Based on standardised Vegetation Index concept of Peters et al. (2002), Z- scores of SMN and SIN distribution were used to estimate the probability of occurrence of SMN/SIN for a given Mandal, relative to the possible values of SMN/SIN. Through Standardisation, SMN/SIN deviations were normalised for mean and standard deviation, so that the deviations are comparable across space. Standardised SMN of <0.25, following Peters et al. (2002), for any year in the time series was regarded as agricultural drought and the number of such drought years was taken as drought frequency. More details on standardisation are available in Peters et al. (2002).
The third parameter in the sensitivity component was August NDVI, which is strongly related to early season agricultural drought conditions. During normal kharif crop season in the study area state, July month represents the peak crop sowing/planting period. Considering the spectral manifestation of agricultural areas – crop sown in normal time, sown late, left unsown – the NDVI of August month aptly captures the early season agricultural drought conditions. Murthy et al. (2011) used August NDVI, to analyses the spatio-temporal differences in the agricultural drought conditions during kharif 2002 and 2009, in India. The indicators of August NDVI i.e., CV and drought frequency were derived in the same way as that of SMN and SIN given above.
The fourth parameter in the sensitivity component is cropping pattern. The cropping pattern of the area, determine the sensitivity to drought conditions. For example, jowar crop is less sensitive to agricultural drought compared to groundnut crop for a given moisture stress condition. In this study, crop-wise drought sensitivity factors were derived and then cropping pattern based drought sensitivity of Mandal was determined through area weighted approach. CV in the de-trended time series crop yield was taken as a proxy to drought sensitivity. Higher the CV means more is the sensitivity of crop to weather affects (Boubacar, 2012). Since the yield data at Mandal level is not available, district wise data for all the major crops of the district collected from www.agricoop.gov.in, 1998-2012, were analysed. The CV values were computed for all the crops in each district, separately.
Area under different crops in a normal agricultural season (kharif 2010) in different Mandals of a district and the crop-wise CV values of the corresponding district were used to generate crop area weighted sensitivity factor for each Mandal.
Adaptive capacity is the inherent strength of the agricultural area to cope with the reduced soil moisture availability. It is generally determined by the static parameters of the system. Soil is an important link between weather and crops and strongly determines the occurrence of agricultural drought. Available Water Content (AWC) signifies water holding capacity of soils. Higher AWC means more amount of water can be accommodated in the soil column and hence higher adaptive capacity to drought conditions. Wilhelmi and Wilhite (2002) used AWC, as a drought vulnerability indicator in their study. AWC in the current study was computed from 1:250000 scale soil map, by using soil depth and soil texture information, under NADAMS project of NRSC (www.nrsc.gov.in). The soil map was originally prepared by National Bureau of Soil Survey and Land Use Planning of Government of India. Using the 1 km resolution AWC layer of the study area state, Mandal wise average AWC values were generated and used as an indicator of adaptive capacity. Irrigation support is an important parameter because irrigation water is supplemented by rainfall to meet the overall crop water needs. Secondary data on area under surface irrigation systems at Mandal level was collected from BES. Irrigated area expressed as % of crop area in kharif season was taken as an indicator in the study. Ravindranath et al. (2011), used % irrigated area to compute adaptive capacity to climate change. Socio-economic parameters have always been a part of parameters for vulnerability assessment of different ecosystems. Eriyagama et al. (2010), included population, poverty, infrastructure and GDP related parameters for assessing adaptive capacity to climate change impacts on water resources. In this study, % crop area with small and marginal farmers was taken as an indicator of adaptive capacity. It determines the
human ability to cope-up with agricultural drought situation. The assumption made here is that small and marginal farmers have less adaptive capacity to agricultural drought compared to large farmers.
The input indicators of the current vulnerability model include 12 indicators of Exposure component, 7 indicators of Sensitivity component and 3 indicators of Adaptive capacity component. The data matrix comprising 597 Mandals and 22 indicators was prepared for further analysis which includes data normalization, weights computation and index construction. The indicators of the model are in different units with different functional relationships respective component indices. In order to make these indicators free of their units and to standardize their values, data normalization was done using maximum-minimum approach. After normalization, all the indicators were ranging from 0–1, and having positive relationship concerned component index.
Assignment of weights to selected indicators is a key issue in the vulnerability assessment model (Brooks et al. 2005). Wilhelmi and Wilhite (2002) selected weights based on relative contribution of each factor to vulnerability. Li et al. (2006), used Principal Component Analysis to generate weights for the variables. Brooks et al. (2005), assigned equal weights to each indicator in their study on vulnerability and adaptive capacity assessment at national level. The method of simple averaging gives equal importance for all the variables /indicators which is not necessarily correct.
In this study, the method given by Iyengar and Sudarshan (1982) to construct a statistically sound composite index from multivariate data was used. Hiremath and Shiyani (2012) used this method for evaluating vulnerability to climate change.
It is assumed that there are M Mandals, K indicators and xij, i=1, 2,…. M; j= 1, 2, ---K are the normalized scores. The level or stage of vulnerability of ith Mandal is assumed to be a linear sum of the product of indicator value and respective weight.
The weight of an indicator is greater than zero and less than 1 and the sum of all weights equals 1. The weights are assumed to vary inversely as the variance over the Mandals in the respective indicators of vulnerability. Details of the weights generation technique are available at Iyengar and Sudarshan (1982), Hiremath and Shiyani (2012) and OECD (2008).
By assigning the weights through this approach, the large variation in any of the indicators/variables will not unduly dominate the contribution of the rest of the indicators and distort inter regional comparisons. The resulting index ranges between 0 and 1, indicating maximum and minimum intensity respectively. Using this method three composite indices namely Exposure Index (EI), Sensitivity Index (SI) and Adaptive Capacity Index (AI) were computed. Agricultural Drought Vulnerability Index (ADVI) was computed as under
ADVI = EI+SI-AI --- (1)
The ADVI and component indices reflect relative differences among the Mandals, rather representing specific conditions of a crop growing environment. Categorisation based on ADVI in to drought vulnerability classes was done by fitting a statistical distribution to ADVI. Beta distribution, which is generally skewed and takes values in the interval (0,1), was fitted to ADVI, as followed by Iyengar and Sudarshan (1982). The two
parameters of the distribution were estimated by maximum likelihood approach. The ADVI converted to Beta probabilities was divided in to five classes of vulnerability through linear intervals such that each interval has the same probability weight of 20 per cent. These fractile intervals were used to characterize the various stages of vulnerability - Less vulnerable, Moderately vulnerable, Vulnerable, Highly vulnerable and Very highly vulnerable
3.1. Validation of ADVI
In this study, the validation of ADVI map of Mandals was done by analyzing the time series crop yield data of the respective districts. Due to non-availability of crop yield data at Mandal level, district level yield data were analyzed. The Coefficient of Variation (CV) of de-trended yields of principal crops (CV of DYP) represents the yield variability from year to year attributable to changes in weather and crop growing environment. Thus, drought vulnerability and the CV of DYP are directly related.
The districts with a large proportion of Mandals under high vulnerability to agricultural drought showed very high yield variability (CV=30-50%), justifying their higher degree of vulnerability. In the districts dominated with less vulnerable Mandals, the yield variability was significantly less at 10-20%.
4.0 Results and discussion
The methodology for measuring agricultural drought vulnerability followed in this study is unique: large sample size of spatial units, exhaustive inputs, objective weights generation process and statistically treated index. With such strong constituents, the ADVI becomes robust and versatile to represent the current status of agricultural drought vulnerability in a reliable way.
Component indices of vulnerability - exposure, sensitivity and adaptive capacity and their distribution in the state (Fig.1-3 ) reveal interesting trends. Drought exposure is high in many of the Mandals of southern part compared to the other parts of the state. Exposure is determined by weather parameters and hence cannot be modified through interventions. The distribution of exposure index is skewed to southern part of the state.
Drought sensitivity is high in most of the Mandals of southern districts and in isolated pockets of many other districts. Sensitivity is closely related to cropping patterns, crop calendars being followed in the Mandals. Distribution of adaptive capacity index is relatively uniform compared to the other two indices. Increasing the adaptive capacity calls for localised strategies and plans to improve the crop water availability and farmers awareness on drought coping ability.
Figure 1 Distribution of Exposure index
Figure 2 Distribution of Sensitivity index
Figure 3 Distribution of Adaptive capacity index
Mandals with high Adaptive capacity are associated with irrigated command areas and delta areas. Scattered distribution of Mandals of less adaptive levels is a positive indication and calls for localized strategies and plans to improve the
infrastructure and farmers’ awareness of drought-coping ability. The Mandals with mid-level of adaptability are concentrated mostly in the un-irrigated areas or tail ends of irrigated command areas.
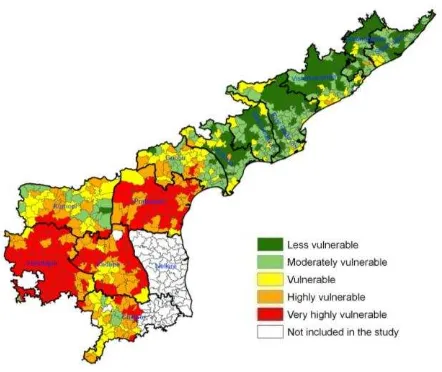
Agricultural drought vulnerability status derived from ADVI categorisation indicate that 119 Mandals are Less vulnerable, 155 Mandals are Moderately vulnerable, 107 Mandals are vulnerable, 98 Mandals are Highly vulnerable and 118 Mandals are Very highly vulnerable (Fig.4). Mandals with high and very high vulnerability are concentrated in southern part of the state i.e., Anantapur, Kadapa and Prakasam districts followed by Kurnool, Guntur and Chittoor districts.
The spatial distribution of agricultural drought vulnerability provides certain valuable insights into the current agricultural situation of the study area. In the northern districts of the state which are rich in soil fertility and irrigation availability with higher rainfall, most of the Mandals are categorized as less/moderately vulnerable. In the mid part of the state, there was a mix of vulnerable and highly vulnerable Mandals, due to the presence of both irrigated and rain-fed crop lands. This region receives slightly lesser rainfall compared to the northern region. The southern part of the state which is known for its low rainfall and less irrigation support contains more number of Mandals with moderate to high vulnerability to drought. Thus, the ADVI map has captured the major patterns of vulnerability, synchronizing with the variability of rainfall and irrigation in the state. The three southern districts of the state Anantpur, Kadapa and Prakasam which contain the largest proportion of very highly vulnerable Mandals in the state are known for their low rainfall and chronic drought occurrence. Anantpur district, dominant with coarse textured red soils, groundnut cultivation and very less irrigation support is prioritized for development under Drought Prone Area Program and Desert Development Program of the country (www.dolr.nic.in). This district is one of the poorly performing agricultural districts of the state with
low ground yields and high inter-farm variability (Rao and Raju 2005). Kadapa district is characterized by deep black soils and low rainfall. Farmers of this district wait for the accumulation of sufficient soil moisture in the season to commence crop sowing. Uncertain rainfall and frequently delayed crop season makes this district more vulnerable. Prakasam district with black soils, less rainfall and partly irrigated but unreliable water supply due to the disadvantage of tail end location is also known for its poor agricultural performance in the state.
Figure 4 Agricultural Drought Vulnerabilty Index
A closer examination of the vulnerability map and its component maps may provide more insights to the drought managers to target interventions effectively. Diagnostic analysis of vulnerable Mandals enables development of localized and cost effective drought proofing measures. Besides drought management, the vulnerability map also reflects the agricultural potential of the state.
5.0 Conclusion
The current study has adopted a holistic approach by using multiple indicators to address the multidimensional nature of agricultural drought vulnerability assessment. Generating the composite index with a combination of exposure, sensitivity and adaptive capacity indices is the uniqueness of the approach. The contributing indicators are physical and biological in nature and cover weather, soil, crop and anthropogenic aspects. The index was made statistically sound by fitting a probability distribution. Validation of vulnerability map with time series crop yield variability has established the reliability/robustness of categorisation. The composite index has captured major patterns of agricultural drought in the study area state. The sub-district level information on agricultural drought vulnerability status is useful to evolve vulnerability reduction plans such as structural and management measures related to irrigation, cropping pattern, crop calendars and farmers awareness.
The numerical model developed in the study, has a strong methodological foundation due to quantifiable nature of indicators and assignment of data driven weights. The two critical issues to bring improvements in the methodology are (1) selection of all possible and relevant indicators and (2) use of different multivariate statistical techniques or data mining tools, to derive more optimal weights to indicators.
Acknowledgements
We express our sincere gratitude to Dr. V.K. Dadhwal, Director, National Remote Sensing Centre for his constant encouragement and guidance. Sincere thanks to Director, Bureau of Economics and Statistics, Government of Andhra Pradesh, for providing the secondary data for the study.
References
Boubacar, I., 2012. The effects of drought on crop yields and yield variability: an economic assessment. International Journal of Economics and Finance, 4, pp. 51-60.
Bradley, B.A., Jacob, R.W., Hermance, J.F., 2007. A curve fitting procedure to derive inter-annual phonologies from the time-series of noisy satellite NDVI data, Remote Sensing of Environment, 106, pp. 565-569.
Brooks, N., Neil A.W., Mick, K.P., 2005. The determinant of vulnerability and adaptive capacity at the national level and the implications for adaptation, Global Environmental Change, 15, pp. 151-163.
Eriyagama, N., Smakhtin, V., Chandrapala, L., Fernando, K., 2010. Impacts of climate change on water resources and agriculture in Sri Lanka: A review and preliminary vulnerability mapping, IWMI Research Report No. 135, IWMI, Colombo
Hiremath, B. D., Shiyani, R.L., 2012. Evaluating regional vulnerability to climate change: A case of Saurashtra, Indian Journal of Agricultural Economics, 67, pp. 334-344.
IPCC, “Assessing key vulnerabilities and the risk from climate change”, Fourth Assessment Report, Geneva:2007
Iyengar, N.S., Sudarshan, P., 1982. A method of classifying regions from multivariate data, Economic and Political Weekly 18 December, pp. 2048-2052.
Lee, R., Yu, F., Price, K.P., 2002. Evaluating vegetation phenological patterns in inner Mangolia using NDVI time series analysis. International Journal of Remote sensing, 23, pp. 2505-2512.
Li, A., Angsheng, W., Shulin, L., Shunlin, L., Wancun, Z., 2006. Eco-environmental vulnerability evaluation in mountainous region using remote sensing and GIS-A case study in the upper reaches of Minjiang River, China. Ecological Modelling 192, pp. 175-187.
Mrutyunjaya, S., Mamata, S., 2011. Drought vulnerability, coping capacity and residual risk: Evidence from Bolangir
district in Odisha, India. Asian Journal of Environmental and Disaster Management, doi:10.3850/S179324011001027
Murthy, C.S., Abhishek, C., Sesha Sai, M.V.R., Roy, P.S., 2011, Spatio-temporal analysis of droughts 2009 and 2002. Current Science, 100, pp.1786-1788
Myneni, R.B., Keeling, C.D., Tucker, C.J., 1997. Increased plant growth in northern high latitudes from 1981-1991. Nature, 386, pp. 698-702
OECD, 2008. “Hand book on constructing composite indicators, Methodology and user guide”, www.oecd.org/publishing (10 August 2014).
Peters, J.A., Elizabeth, A.W., Lei J., Andres, V., Michael, H., Mark, D.S., 2002. Drought monitoring with NDVI-based Standardised Vegetation Index. Photogrammetric Engineering and Remote Sensing, 68, pp. 71-75.
Rao, I.V.Y.R., Raju, V.T., 2005. Scenario of Agriculture in Andhra Pradesh. Daya Publishing House, Delhi, India, ISBN 81-7035-349-1.
Ravindranath, N.H., Sandhya, R., Nitasha, S., Malini, N., Ranjit, G., Ananya, S.R., Sumedha, M., Rakesh, T., Anita, S., Madhishree, M., Niharika, K., Govindasamy, B., 2011. Climate change vulnerability profiles for North East India. Current Science 101, pp. 384-394.
Sakamoto, T., Yokozawa, M., Toritani, H., Shibyama, M., Ishitsuka, N., Ohno, H., 2005. A crop phenology detection method using time-series MODIS data. Remote Sensing of Environment 96, pp. 366-374
Wilhelmi, V. V., Wilhite, A.D., 2002. Assessing vulnerability to agricultural drought: A Nebraska Case Study. Natural Hazards 25, pp. 37-58
Wu, W., Shibasaki, R., Yang, P., Zhou, Q., Tang Huajun, 2008., Variations in cropland phenology in China from 1983 to 2002.The International Archives of the Photogrammetry, Remote Sensing and Spatial Information Sciences, vol. XXXVII, B7.
Xiaoqian, L., Wang, Y., Peng, J., Ademola, K.B., Yinh, H., 2013, Assessing vulnerability to drought based on exposure, sensitivity and adaptive capacity: A case study in middle inner Mangolia of China. China Geographical Sciences 23, pp. 13-25.