SOURCES OF ARTEFACTS IN
SYNTHETIC APERTURE RADAR INTERFEROMETRY
DATA SETS
K. Becek a, *, A. Borkowski b
a
Universiti Brunei Darussalam, Faculty of Arts and Social Sciences, Brunei Darussalam – [email protected]
b
Wroclaw University of Environmental and Life Sciences, Poland – [email protected]
Commission VII, WG VII/2
KEY WORDS: Geodesy, Estimation, Simplification, Landscape, DEM/DTM, Modelling
ABSTRACT:
In recent years, much attention has been devoted to digital elevation models (DEMs) produced using Synthetic Aperture Radar Interferometry (InSAR). This has been triggered by the relative novelty of the InSAR method and its world-famous product—the Shuttle Radar Topography Mission (SRTM) DEM. However, much less attention, if at all, has been paid to sources of artefacts in SRTM. In this work, we focus not on the missing pixels (null pixels) due to shadows or the layover effect, but rather on outliers that were undetected by the SRTM validation process. The aim of this study is to identify some of the causes of the elevation outliers in SRTM. Such knowledge may be helpful to mitigate similar problems in future InSAR DEMs, notably the ones currently being developed from data acquired by the TanDEM-X mission. We analysed many sections derived from SRTM. These cross-sections were extracted over the elevation test areas, which are available from the Global Elevation Data Testing Facility (GEDTF) whose database contains about 8,500 runways with known vertical profiles. Whenever a significant discrepancy between the known runway profile and the SRTM cross-section was detected, a visual interpretation of the high-resolution satellite image was carried out to identify the objects causing the irregularities. A distance and a bearing from the outlier to the object were recorded. Moreover, we considered the SRTM look direction parameter. A comprehensive analysis of the acquired data allows us to establish that large metallic structures, such as hangars or car parking lots, are causing the outliers. Water areas or plain wet terrains may also cause an InSAR outlier. The look direction and the depression angle of the InSAR system in relation to the suspected objects influence the magnitude of the outliers. We hope that these findings will be helpful in designing the error detection routines of future InSAR or, in fact, any microwave aerial- or space-based survey. The presence of outliers in SRTM was first reported in Becek, K. (2008). Investigating error structure of shuttle radar topography mission elevation data product, Geophys. Res. Lett., 35, L15403.
* Corresponding author.
1. INTRODUCTION
A robust and fully automatic DEM extraction method that would deliver elevations contaminated with only random errors of known statistical characteristics has yet to be developed. This is valid for both stereoscopy-based and InSAR-based methods, but less so for the LiDAR method. A possible timeframe for that to happen is impossible to estimate, assuming that it will happen at all. Meanwhile, DEMs such as ASTER GDEM (Advanced Spaceborne Thermal Emission and Reflection radiometer) and SRTM (Shuttle Radar Topography Mission) are provided with a certain number of pixels whose elevations deviate significantly from true elevations, or void or ―no data‖ pixels. Void pixels may be easily isolated, and an appropriate mitigation procedure taken. These voids are formed because of lack of correlation between corresponding parts of a stereopair, or, in the case of InSAR, shadowing effect. A far more difficult case is the detection and correction of outliers, e.g. pixels having wrong elevations. Despite deployment of sophisticated algorithms designed to trap outliers, the above-mentioned DEMs still contain erroneous pixels. As far as we know, there are no published attempts addressing the issue of outliers in the automatically derived DEMs. Rather, researchers are focused on assessments of systematic and/or random errors in DEMs. In this contribution we present our findings regarding
outliers in SRTM. The major aim of this work is to provide circumstantial evidence that the metallic structures and large and smooth surfaces are the cause of outliers in the SRTM. The objectives leading to this aim are:
a) to analyse SRTM data over large anthropogenic structures, in this case airports, and
b) to link the location of the outliers to the look angle and look direction of the SRTM data takes and the airports‘ infrastructure.
The Global Elevation Data Testing Facility (GEDTF) has been used to identify the location of airports and the required reference elevation data. Our findings recommend that the original interferometry data sets be audited in an attempt to quantify the mechanism responsible for the creation of the outliers and working out a new interferometry data processing procedure to suppress this type of error in InSAR data products.
2. METHOD AND DATA
2.1 Error Structure of DEM
After Becek (2008), we adopt the following error structure of the SRTM data:
2
the target-induced and the instrumental component of
SRTM2 - the SRTM (elevation) error variation. The target-induced errorvariation -
T2 may be estimated using the following formulaThe third component,
E2- other errors variance may be caused by factors including type of surface, look angle and look direction (ibid). In some cases, these factors may cause a significant variation in radar brightness (Rodríguez, et al., 2005), which in turn leads to an erroneous elevation and even data voids. It the following we focus our attention on this component of the total SRTM error.2.2 Method
A search for suitable objects to investigate the major aim of this research has resulted in the selection of large anthropogenic structures, which typically are big airports. Another requirement for the test sites was that they were topographically indifferent. Again, the airport sites are, in the majority of cases, relatively flat, at least in a certain radius from a centroid of the site. In order to maintain the assumed flatness of the site, the diameter of the buffer should be smaller than the length of the runway(s), which are in the range of 3,000 m at big airports. The following steps have been performed to achieve the aim and objectives of the investigations:
1. A set of large airports was selected (further referred to as AOI [airports of interest]); the word ‗international‘ in the airport‘s name was used as a qualitative indicator of the
6. Pixels have been classified into three groups: voids, pixels having values within a range allowed by statistical considerations and other pixels considered as outliers. 7. For each set of pixels, a semivariogram on the disparities
in elevation between the reference elevation and the pixel value has been calculated.
The semivariograms were related to the look angles and look directions (see the following section for definitions of these variables) of data takes of the SRTM mission.
2.3 Data
In this study we have used the following data sources:
1. The Global Elevation Data Testing Facility (GEDTF, 2011);
2. The Aeronautical Information Package (API, 2011); 3. The SRTM Coverage Plotting Tool (JPL, 2008); and 4. The SRTM downloading facility (NASA, 2001).
Source 1) was used to extract location data and the physical characteristics of the runways among the airports of interest. Source 2) was used to extract the reference data on each airport‘s infrastructure, including the coordinates of runways and the airport‘s reference elevation. Source 3) was used to February 2000. The mission acquired the Synthetic Aperture Radar (SAR) data suitable for the interferometric processing and development of the digital elevation model of the Earth‘s surface. This mission was a collective effort of NASA and German/Italian space agencies. The acquisition of data had been carried out using the C-band (5.6 cm) and X-band (3.1 cm) microwaves. Hence, two distinct DEM models have been produced. In this project, we use the C-band SRTM DEM, which has the pixel size of 3 arc-seconds. This resolution was achieved by resampling of the original 1-arc-second DEM. Both DEMs over the United States are available for download free of charge (NASA, 2001).
3. RESULTS AND DISCUSSION
For the purpose of the study, a set of 64 major U.S. airports has been selected (API, 2011). The available data on airports in this source (ibid) include coordinates and the elevation of the airport‘s reference point, which constitutes an approximate geometric centre of the airport‘s area. A georeferenced chart of each airport is a part of the source (ibid). The coordinates are provided in the WGS84 datum. The elevations are provided in feet above mean sea level. A circular reference buffer (RB) with a radius of 1.5 km centred on the airport‘s reference point has been constructed for all chosen airports of interest (AOI). The RB covers mostly the elements of the airport‘s infrastructure including runway(s), terminal, hangars, taxiways, tarmac, and aprons. It is important to note that the topography of the area where an airport is constructed must be flat. Obviously, this is the case for the terrain located within the RB. Using RB, the three-arc-second SRTM pixels were extracted from the SRTM (NASA, 2001). There were approximately 824 SRTM pixels in each buffer. The total number of pixels extracted for all RBs was 52,753. The initial assessment has identified a number of void pixels (no data). A summary of the void pixels follows:
1. No of void pixels: 970 (~1.8% of all pixels);
2. No of airports with void pixels: 22 (~35% of all airports); International Archives of the Photogrammetry, Remote Sensing and Spatial Information Sciences, Volume XXXIX-B7, 2012
3. Average No of void pixels/airport: 44 (~5% of pixels in RB);
4. The highest No of voids: 255 (~31% of pixels in RB) -
(Newark Liberty International Airport).
The items in the above list should be compared with an average number of void pixels in the 3-arc-second SRTM (version 2), which is on the level of approximately 0.005%.
For the subsequent analysis, only non-void pixels were considered (51,793). Further, pixels representing the water bodies in the vicinity of airports were also excluded from analysis. Consequently, 49,604 pixels were available for further consideration.
An initial validation of the SRTM data has been performed by comparing the reference airport‘s elevation with the SRTM elevation within RB. Figure 1 shows a histogram of the disparities in elevation between the airport‘s reference elevation and the SRTM elevation. airport‘s reference elevation and the SRTM elevations within the 1.5 km buffer centred on the airport‘s reference point for 64 major U.S. airports. The mean difference is -6.0 m (the SRTM mean elevation is higher than the reference elevation). The standard deviation is ±9.2 m. relatively small number of pixels, because, after all, an airport is an unobstructed space that comprises much more than the space taken up by the terminal building and other structures. In order to identify artefacts, the threefold of standard deviation criterion was used. However, to address the above-described ‗contamination‘ of the SRTM pixels with the elevated structures, an asymmetric criterion has been adopted and can be expressed as follows:
I I m m
m5
3
(3)where m is the difference between airport‘s reference elevation and SRTM pixels (-6.0 m), and I is the instrumental error
component of the SRTM elevations, which was estimated at ± 1.55 m (see Section 2.1). This error covers the instrumental component only, because the target-induced component is 0 due to the fact that the terrain within the RB is by assumption flat (slope s in Equation 2 is 0).
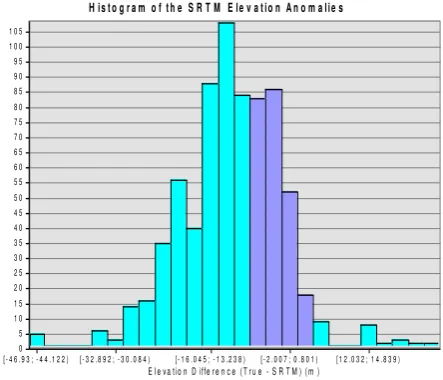
The SRTM elevations outside the range defined by Equation 3 were tagged as anomalies. There were 21,142 outliers, which constitute about 42.6% of all non-void SRTM pixels. The number of outliers ranged between 1 (Niagara Falls) and 802 (Pittsburgh International Airport). Examples of histograms of the SRTM Elevation Anomalies for Atlanta and Pittsburgh airports are shown in Figures 2 and 3. A range of elevation differences within the limits defined by Equation 3 is shown using darker bars. Clearly, the majority of the SRTM elevations within both airports‘ areas are anomalies. A similar conclusion is valid for the majority of the investigated airports.
H is t o g r a m o f t h e S R T M E le v a t io n A n o m a lie s International Airport. The elevation anomalies are represented by lighter bars. A range of ‗correct‘ elevations is represented by darker bars. There were two data takes for this airport.
Histogram of the SRTM Elevation Anomalies
Pittsburgh International Airport
Elevation Differences (True - SRTM) (m)
[-48.915; -47.094) [-37.986; -36.165) [-25.236; -23.415) [-12.486; -10.665) [-1.558; 0.264) 105
Figure 3. Histogram of the SRTM elevation for the Pittsburgh International Airport. The elevation anomalies are represented by lighter bars. A range of ‗correct‘ elevations is represented by darker bars. There were four data takes for this airport.
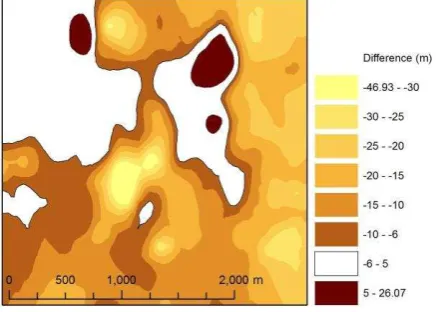
Map of the SRTM elevation anomalies for the Atlanta and Pittsburgh airports are shown in Figures 4 and 5. These maps uncover a very rough and rich ‗topography‘ of the flat surfaces of the airports. A detailed visual comparison of these maps with the outline of the airport‘s infrastructure has concluded that some of the anomalies are due to the presence of elevated objects such as terminal buildings or similar.
Figure 4. Atlanta International Airport: the map of the SRTM elevation anomalies. The hollow areas represent differences in elevation within a range of statistically acceptable disparities.
Figure 5. Pittsburgh International Airport: the map of the SRTM elevation anomalies. The hollow areas represent differences in elevation within a range of statistically acceptable disparities.
Table 1 shows the percentage of outliers for the investigated airports. In general, smaller airports are less biased by the elevation anomalies. Visual inspection of satellite images of airports with the lower percentage of anomalies confirms a significantly lower number of concrete surfaces, buildings, or metal objects.
City Airport code Outliers (%)
Pittsburgh KPIT 97.2
Milwaukee KMKE 96.0
Tucson KTUS 95.1
Las Vegas KLAS 95.1
St Louis KSTL 94.9
Memphis KMEM 91.9
Denver KDEN 91.1
Seattle KSEA 84.4
Pueblo KPUB 80.7
Washington KIAD 79.5
Nashville KBNA 78.3
Covington KCVG 70.8
Everett KPAE 70.5
El Paso KELP 67.0
Atlanta KATL 66.2
Christiansted TISX 64.6
Kansas City KMCI 64.0
Ontario KONT 64.0
Raleigh/Durham KRDU 63.8
San Antonio KSAT 63.1
Bangor KBGR 62.1
Charlotte KCLT 60.3
Palmdale KPMD 57.7
Phoenix KPHX 54.4
Spokane KGEG 51.3
Fort Lauderdale KFLL 51.0
Philadelphia KPHL 51.0
Miami KMIA 49.0
Chicago KORD 46.1
Minneapolis KMSP 45.0
San Jose KSJC 38.9
Dallas/Fort Worth KDFW 38.5
Indianapolis KIND 34.9
Tampa KTPA 32.3
Laredo KLRD 29.9
Pago Pago NSTU 29.1
Hilo PHTO 27.3
Baltimore KBWI 24.4
Newark KEWR 23.0
West Palm Beach KPBI 21.1
San Diego KSAN 18.8
Mayaguez TJMZ 18.8
Los Angeles KLAX 18.4
San Francisco KSFO 17.1
Orlando KMCO 16.7
Houston KIAH 16.5
Oakland KOAK 13.2
Detroit KDTW 12.6
Windsor Locks KBDL 12.5
Honolulu PHNL 12.0
New York KJFK 11.6
Salt Lake City KSLC 11.4
Syracuse KSYR 10.5
Columbus KCMH 9.3
Fort Myers KRSW 8.9
Fresno KFAT 8.5
Portland KPDX 7.2
San Juan TJSJ 6.4
Stockton KSCK 6.3
Reno KRNO 5.9
Wichita KICT 5.9
New Orleans KMSY 5.0
Boston KBOS 4.5
Niagara Falls KIAG 0.1
Table 1. Percentage of outliers in the SRTM data for the investigated airports.
In the final step of the investigations, a semivariogram of the elevation anomalies was calculated for every AOI. This was done using the Geostatistical Analyst Toolbox, a part of the ArcGIS 9.3 GIS software package. Using this toolbox, the magnitude of anisotropy was calculated for each airport. The value of anisotropy was than mapped against the average value of look angle. It was found that both variables are uncorrelated. Similar results have been obtained for the look direction. A most likely reason is that the majority of the SRTM elevations have been obtained through averaging of elevations calculated from a few data takes. This probably caused cancellations of the directional characteristics of the elevation anomalies.
4. CONCLUSIONS
The main aim of this project was to develop circumstantial evidence linking the presence of outliers in the SRTM data sets with the presence of anthropogenic structures. We have chosen airports as objects of interest because they usually contain large and well-defined anthropogenic structures. But the presented conclusions may be also applicable to other similar objects, including large car parks, tall buildings, large metallic sheds, and others. This study allows us to infer the following conclusions:
1. There is tangible evidence that large anthropogenic structures cause elevation anomalies in the SRTM data. 2. Attempts to relate elevation anomalies to both look angle
and look direction did not provide conclusive evidence of a relationship between the independent variables (LA and LD) and the dependent variable (the anomalies). This is most probably caused by the mitigation strategy deployed by the SRTM system (averaging elevations from a few data takes).
3. A comprehensive study of the original complex radar data takes used to develop interferograms over the AOIs is recommended. Such a study should be aimed at identifying a mathematical model explaining the mechanism causing the undesired effects, and propose a modification of the InSAR data processing chain over areas suspected to be causing the artefacts in the InSAR-derived DEMs.
5. REFERENCES
API, 2011. Aeronautical Information Publication. United States of America. 21st Ed. Dep. of Transportation Federal Aviation Administration.
Becek, K., 2008. Investigating error structure of shuttle radar topography mission elevation data product. Geophys. Res. Lett., 35, L15403, doi:10.1029/2008GL034592.
GEDTF, 2010. Global Elevation Data Testing Facility. http://gedtf.org (29 Dec. 2011).
JPL, 2008. SRTM Coverage Plotting Tool. http://space.jpl.nasa.gov/cgi-bin/wtdb (29 Dec. 2011).
NASA, 2001. Shuttle Radar Topography Mission. The Mission to Map the World. http://www2.jpl.nasa.gov/srtm/ (29 Dec. 2011).
Rodríguez, E., Morris, C. S., Belz, J. E., Chapin, E. C., Martin, J. M., Daffer, W. and Hensley, S., 2005. An assessment of the SRTM topographic products. Tech. Rep. JPL D-31639, 143 pp., Jet Propul. Lab., Pasadena, Calif.