P T SA R ATO G A I N V ESTAMA S E DAYA T B K .
C H A P T E R
1
CONTENTS
• Proile 2
• Financial Highlights 8
• 2015 in Pictures 10
1. Reports 12
President Commissioner’s Letter 13
Letter from Shareholder 15
Report of the Board of Directors 16
2. Management Discussion & Analysis 20
3. Investee Company Highlights 30
4. Responsible Investing - People Community and Environment 36
5. Corporate Governance including Risk Management 42
6. Corporate Data 56
Statement of Responsibility by the Members of BOC & BOD 68
Consolidated Financial Statements 69
Cross Reference of Bapepam-LK No. X.K.6 184
Consolidated Financial Statements 00
Cross Reference of Bapepam-LK No. X.K.6
This annual report contains “forward-looking” statements that relate to future events, which are, by their own nature, subject to signiicant risks and uncertainties. All statements other than statements of historical fact contained in this report, including, without limitation, those regarding PT Saratoga Investama Sedaya, Tbk. (“Saratoga” or “Company”)’s future inancial position and results of operations, strategy, plans, objectives, goals and targets, future developments in the markets where Saratoga participates or is seeking to participate, and any statements preceded by, followed by or that include the words “believe,” “expect,” “aim,” “intend,” “will,” “plan,” “look forward to,” “may,” “project,” “estimate,” “anticipate,” “predict,” “seek,” “should” or words of similar meaning, are forward-looking statements.
The future events referred to in these forward-looking statements involve known and unknown risks, uncertainties and a variety of other factors, many of which are beyond the control of Saratoga, which may cause the actual results, performance or achievements to be materially diferent from those expressed or implied by the forward-looking statements. These factors include in particular, but not limited to, the matters described in Chapter 5: Corporate Governance of our Annual Report. These factors include in particular but are not limited to changes in general, national or regional economic and political conditions, changes in foreign exchange rates, changes in the prices and supply and demand on the commodity markets, changes in the size and nature of the Company’s competition, changes in legislation or regulations and accounting principles, policies and guidelines and changes in the assumptions used in making such forward looking statements.
PT Saratoga Investama Sedaya Tbk.
DISCLAIMER
Further information about risks and uncertainties afecting Saratoga is included throughout our interim inancial statements and disclosures which are available on the Company’s website www.saratoga-investama.com. Should one or more of these risks or uncertainties materialize, or should underlying assumptions prove incorrect; actual results, performance or achievements of Saratoga may vary materially from those described in the relevant forward-looking statement as being expected, anticipated, intended, planned, believed, sought, estimated or projected. Saratoga neither intends, nor assumes any obligation, to update or revise these forward-looking statements in light of developments which difer from those anticipated.
Due to rounding, numbers presented throughout this annual report and other documents may not add up precisely to the totals provided and percentages may not precisely relect the absolute igures.
ACTIVE
INVESTING
P T SA R ATO G A I N V ESTAMA S E DAYA T B K . What do We mean by active investing?
Market conditions in 2015 proved a test for our philosophy to be an active investor. True, sentiment across world and regional equity markets impacted asset values. However, looking back we believe the results for the year demonstrate we have stood up well to this test.
We were very active in 2015. Indonesia’s government is prioritising investment
in infrastructure to meet massive latent consumer demand for energy and mobility. We have taken the opportunity to invest in electricity generation and in oil and gas exploration, at a time of multi year lows in fossil fuel prices.
We stayed active but disciplined; we looked at over 100 companies during
the year before selecting just two, after exacting analysis. That reputation for discipline was also clear in our investment in Lintas Marga Sedaya, owner of Indonesia’s longest toll road which was completed earlier than planned.
We delivered value: unlocking IDR1 trillion in value from Merdeka Copper
Gold, the irst pre-producing mining company to be listed on the IDX. Another of our listed gold companies, Sumatra Copper Gold, commenced production two months ahead of schedule and the timing of both these developments has been propitious, as gold prices have seen a steady resurgence.
We diversified our funding base and raised new money on very competitive terms – which we believe says a lot about our reputation for monetizing and funding our investments.
Cash generation is another active element in our investment equation: the
number of investees paying dividends increased in 2015, and we use this cash to manage our inancing commitments.
We stayed active in advising our investee companies on cost and inventory management, reviewing timing of expansion plans, in banking relationships and providing inancial management expertise.
We continue to invest in human capital, placing our skilled managers where they can do most good. We sustain regular group events for our investees; our annual CXO Network forum brings senior managers together to exchange ideas. And our CSR team launched an empowerment for women program in 2015.
Saratoga always has an eye on the future. Our single largest investment is in telecommunications infrastucture, which will propel the digital economy, creating new businesses that many of us cannot imagine today.
NA
V
PER SHARE (IDR)
INVESTMENT
TRACk RECORD
2002-2004 2005 2006 2007-2008 2009 2010
PT Adaro Energy Tbk. Natural Resources
Coal & Energy PT Lintas Marga
Sedaya Infrastructure
Toll Road
PT Provident Agro Tbk. Natural Resources Palm Oil Plantation PT Adaro
Indonesia Natural Resources Coal & Energy
PT Banyan Mas Infrastructure
Telco Tower
PT Tenaga Listrik Gorontalo Infrastructure Power Generation
PT Adaro Indonesia Natural Resources
Coal & Energy
PT Tower Bersama Infrastructure Tbk.
(formerly PT Banyan Mas)
Infrastructure Telco Tower
PT Agro Maju Raya Natural Resources Palm Plantation
PT Mitra Pinansthika Mustika Tbk.
Consumer Consumer Products
and Services
PT Etika karya Usaha Consumer
Property
S
ARA
T
OG
A INVESTMENT
A
C
TIVITy
LISTING
DIVESTMENT
PT Adaro Energy Tbk. PT Tower Bersama Infrastructure Tbk. 539
3,560
7,157
2
2011 2012 2013 2014 2015
march 2016
Interra Resources Limited Natural Resources
Oil & Gas
Seroja Investment Limited Infrastructure Freight Chartering
Sihayo Gold Limited Natural Resources
Gold
Sumatra Copper and Gold plc Natural Resources
Polymetallic
PT Gilang Agung Persada Consumer
Lifestyle
PT Trimitra karya Jaya (holding of Merdeka Copper Gold) Natural Resources
Gold Finders Resources
Limited Natural Resources
Polymetallic
PT Nusa Raya Cipta Tbk. Infrastructure
Construction
PT Mitra Pinansthika Mustika Tbk.
Consumer Automotive PT Medco Power
Indonesia Infrastructure Power Generation
PT Tri Wahana Universal Infrastructure
Oil Reinery
PT Agra Energi Indonesia Natural Resources
Oil & Gas
PT Paiton Energy Infrastructure Power Generation
PT Provident Agro Tbk.
PT Mitra Pinasthika
Mustika Tbk. PT Merdeka Copper
Gold Tbk.
5,266 6,108
7,462
6,557
8,174
4,885
Since we established Saratoga, we have stayed active by investing throughout cycles to sustain growth over the long term.
The trend in 2015, heavily inluenced by short-term sentiment on commodity prices, presented some interesting opportunities to make several follow-on and new investments as well as realize value from the listing of PT Merdeka Copper Gold Tbk.
Also in 2015, we stayed true to our mantra ‘Invest-Grow-Monetise’ through the issue of the USD100 million exchangeable bond thereby monetizing and funding our investments. Post reporting date we also divested our interests in shipping charter business PT Pulau Seroja Jaya for a 48% Internal Rate of Return.
Saratoga's NAV per share (adjusted for capital raising) CAGR of 31.7% for the past eight years has outperformed the JCI CAGR of 16.5%.
Sold stake in an
investee company USD100 million Issued EB of
Divested Pulau Seroja Jaya for IDR98,6 bio, IRR of 48% PT Saratoga
Investama Sedaya Tbk.
Sold stake in an investee company
Who We are
PT Saratoga Investama Sedaya Tbk. (ticker code: SRTG) is a
world-class active investment company in Indonesia with a
unique track record of creating value for our stakeholders and
the nation. Owning our shares provides access not only to key
strategic growth sectors but a blend of blue chip sector
lead-ers, promising early stage and growth companies, that
togeth-er represent considtogeth-erable potential in value gentogeth-eration.
What We do
invest
With a passion for excellence, we actively target
investment opportunities early on and in special situations
where signiicant value can be added.
groW
We are highly active in supporting our investments,
leveraging our expertise in investment management, in deep
sector knowledge and wide ranging access to debt and equity
capital markets, locally and internationally.
monetize
We actively manage our investments by unlocking
value of our investee companies through equity capital
mar-kets and strategic sales.
vision
A world-class active investment
company in Indonesia that excels
on the back of strong corporate
characters to create value for our
stakeholders and the nation
mission
To be the partner of choice for
investors to participate in the
dynamic growth of Indonesia
core values
Work Hard
Work Smart
Work Thoroughly
Work Whole-heartedly
corporate
characters
Integrity
Passion & Energy
Competence & Capability
SARATOGA,
INDONESIA’S ACTIVE
INVESTMENT COMPANy
4
587
2015:
AT A GLANCE
2013
2014
2015
active investing
Invested IDR4 trillion in the past three years IDR649 billion invested in 2015
2823
649
OPPORTUNITIES
PRELIMINARy ASSESSMENTS
DESkTOP DILIGENCE
TERM SHEET
NEW INVESTMENT
100+
68
15
5
2
139
72
15
5
2
101
54
39
8
2
disciplined execution
Examined over 340 opportunities in the past three years and executed 2-3 new investments annually
value generation
Generated value for our shareholders and achieved IDR923 billion in proit attributable to shareholders in 2015, in 2015, an increase of 48% year on year
246
625
923
diversified funding
In addition to bank loans and equity, we have established a proile in both IDR and USD debt capital markets
Listed on the IDX,
received USD150 million
proceeds
Issued a 3-year IDR725 billion Medium Term
Notes
Issued a 5-year USD100 million
Exchangeable Bond
dividend income
Steady diversiication of dividend income across all invested sectors
145 72 217
129 136 5 270
174 5,2 74 15 268
Adaro Tower Bersama
Adaro Tower Bersama Nusa Raya Cipta
Adaro Nusa Raya Cipta TWU
MPM
SARATOGA,
INDONESIA’S ACTIVE
INVESTMENT COMPANy
OUR ACTIVE INVESTMENT METHODOLOGy
We are guided by three clear concepts, namely Platforms, Partnerships and
Value Creation.
platforms
– we view each investment strategically, as a platform for
organic growth and future bolt on acquisitions within the entire value chain.
partnerships
- we work closely with existing business owners whose
role is critical in providing continuity and performance. Working with
global professional investors, our role is deined as a vital local partner,
providing extensive knowledge of the market and regulatory environment.
We embrace specialist expertise that can equip our investees with superior
knowledge and technology for competitive advantage.
value creation
– we ofer capital support, operational input, inancial
advisory and access to signiicant business expertise and commercial
acumen, across the Saratoga group. Our portfolio provides shareholders
with a prudent balance of risk management and reward.
OUR INVESTMENT FRAMEWORk
Our investment framework is deined by the substantial development
opportunities in Natural Resources, in Infrastructure and in Consumer
product and services markets – the three key pillars supporting Indonesia’s
economic growth.
Our portfolio is spread across:
• early stage companies with signiicant upside;
• growth companies entering their mature, highly cash generative phase;
and
• listed blue chip companies with well-established market positions,
ofering long term growth and capital appreciation.
6
EARLy STAGE COMPANIES
AGRO MAJU RAYA SIhAYO GOLD LIMITED SUMATRA COPPER & GOLD FINDERS RESOURCES AGRA ENERGI INDONESIA
GROWTH COMPANIES
MERDEkA COPPER GOLD PROvIDENT AGRO INTERRA RESOURCES
LISTED BLUE CHIPS COMPANIES
ADARO ENERGY
natural resources
35%
GROWTH COMPANIES
ETIkA kARYA USAhA GILANG AGUNG PERSADA MITRA PINASThIkA MUSTIkA
consumer
7%
LIS
TE D B
LU
E C
HIP CO
MPA
NIE
S
GR OW
TH CO
MP
ANIE
S
EA RLY
STAGE COMPANIES
EARLy STAGE COMPANIES
TENAGA LISTRIk GORONTALO
GROWTH COMPANIES
LINTAS MARGA SEDAYA MEDCO POWER INDONESIA TRI WAhANA UNIvERSAL PAITON ENERGY NUSA RAYA CIPTA SEROJA INvESTMENT SINAR MENTARI PRIMA PULAU SEROJA JAYA*
LISTED BLUE CHIPS COMPANIES
TOWER BERSAMA INFRASTRUCTURE
infrastructure
59%
THE SARATOGA
PORTFOLIO MATRIX
% of portfolio's sum of the parts
3%
33%
65%
: Listed Company
*Pulau Seroja Jaya was later divested in February 2016
31 December
FINANCIAL HIGHLIGHTS
2015 4,282 3,318 964 (300) 664 1,013 1,676 1,452 736 923 194 340 2014* 6,124 5,385 739 (224) 515 505 1,019 886 783 625 515 230 2013* 3,659 3,286 373 (197) 176 (114) 62 20 (489) (82) (617) (32) 2014* 538 232 38 1,866 1,859 10,138 13,975 15,841 434 808 3,912 3,960 4,768 10,508 564 11,072 15,841 Consolidated Statement of Financial PositionIDR billion
ASSET Current asset
Cash and cash equivalents Available- for-sale inancial assets Restricted cash
Total Current Assets
Non-Current Assets
Available- for-sale inancial assets Investment in equity-accounted investees
Total Non-Current Assets TOTAL ASSETS
liabilities current liabilities Borrowing
Total Current Liabilities
non-current liabilities Borrowing (include MTN and EB) Total Non-Current Liabilities TOTAL LIABILITIES
eQuity
Net equity attributable to owners of the Company
Non-controlling interest TOTAL EQUITY
TOTAL LIABILITIES AND EQUITY
Description
Consolidated Statement of Comprehensive Income
IDR billion
Net Revenues Cost of Revenues Gross Proit Operating expenses Operating Proit Other income (expenses) Proit Before Income Tax
PROFIT FOR THE yEAR
TOTAL COMPREHENSIVE INCOME (LOSS) FOR THE yEAR
• Proit attributable to: Owners of the Company
• Total comprehensive income (loss) attributable to: Owners of the Company
EARNING PER ShARE BASIC
2015 512 (516) 46 401 2014* 233 (218) 116 538 2013* (448) (2,295) 2,679 406 Consolidated Statement of Cash Flow
IDR billion
Net cash from (used in) operating activities
Net cash used in investing activities Net cash from inancing activities Cash and cash equivalent at end of year
Description 31 December
2013* 406 231 34 1,519 2,102 10,617 14,362 15,881 474 2,086 3,417 3,456 5,542 10,082 257 10,339 15,881 31 December 2015 401 31 318 1,570 2,839 10,518 15,132 16,701 705 1,035 4,117 4,186 5,221 10,532 949 11,481 16,701 Description 8
2013*
N/A** N/A** N/A** N/A** N/A**
N/A** N/A** N/A**
0.73 0.35 0.54 0.25 0.39
10 5 1 (13)
0
(3)
0
(5) 2015
(30) 30 29 64 (6)
5 9 4
1.52 0.31 0.45 0.29 0.46
23 16 34 17
9
5
13
7
2014*
67 98 192 4,294 (260)
(0) (14) 7
2.31 0.30 0.43 0.27 0.41
12 8 14 13
6
5
8
7 GROWTH RATIOS (%)
Net revenue Gross Proit Operating proit Proit for the year
Total comprehensive income (loss) for the year
Total assets Total liabilities Net equity
FINANCIAL RATIOS (times) Current assets / current liabilities Total liabilities / total assets Total liabilities / total equity Total debt / total assets Total debt / net equity
OPERATING RATIOS (%) Gross proit / net revenue Operating proit / net revenue Proit for the year / net revenue Total comprehensive income for the year / net revenue
Total proit for the year / average total assets
Total comprehensive income for the year / average total assets Total proit for the year / average net equity
Total comprehensive income for the year / average net equity
Consolidated Cash & Restricted Cash IDR billion
31 December
Ratios percentage or times
Description
2013 2014 2015
440 576
719
Consolidated Assets IDR billion
2013 2014 2015
15,881 15,841
16,701
Consolidated Debt IDR billion
2013 2014 2015
2,715
4,346 4,822
Proit Attributable to Shareholders IDR billion
2013 2014 2015
(82)
625
923
369 333
588
71 243
131
1,177 3,892
3,406 940
282
4,540 Saratoga Parent Level
TWU & SMP
Saratoga Parent Level TWU & SMP
* Restated
** Not available due to restatement
26 February 2015
Saratoga received a Warta Ekonomi Award Indonesian Fastest Growing Company in 2014
29 April 2015
Saratoga’s CSR launched Women Empowerment program
“Perempuan Hebat Perempuan Mandiri”
12 May 2015
PT Merdeka Copper Gold Tbk. Due Diligence Meeting & Public Expose
10 June 2015
Annual and Extraordinary General Meeting of Shareholders Annual Public Expose 2015
13 June 2015
The Inauguration of Cikopo – Palimanan Toll Road by President of Republic of Indonesia, Mr. Joko Widodo. The 116.75kM toll-road, located in West Java, is the longest toll road ever built in Indonesia.
13 July 2015
Jointly established PT Agra Energi Indonesia, an early-early stage oil and gas exploration company
Agr
2015 IN PICTURES
10
19 June 2015
PT Merdeka Copper Gold Tbk. Public Listing on IDX
19 August 2015
The Acquisition of PT Batu hitam Perkasa
BhP holds ive percent of shares in PT Paiton Energy, an electricity-generation company, owns and operates a coal steam generator located at the Paiton Power Plant in East Java 6 August 2015
Saratoga's 4th Annual CXO Network 2015 An annual gathering of Senior Management personnel of Saratoga and investee companies to interact and share knowledge to one another
11 – 13 September 2015 Saratoga Fun Day 2015
An annual fun trip for Saratoga’s employees which in 2015 took place in Singapore
6 November 2015 Saratoga Golf Day 2015
An annual golf tournament specially designs for our investors, bankers, partners, associates and advisors to share lighter moments in a fresh and friendly environment
16 November 2015
Saratoga received an award from Financial Services Authority (OJk) with Indonesian Institute for Corporate Directorship (IICD) as The Best Right Shareholders and one of the Top 50 Public Listed Companies
17 December 2015
The Inauguration of William Soeryadjaya Bridge on Cikopo – Palimanan Toll Road by vice President of Republic of Indonesia, Mr. Jusuf kalla
REPORTS
1
C H A P T E R
In this chapter, Founding Shareholder and President Commissioner,
Edwin Soeryadjaya highlights Saratoga’s successes as an active but
prudent investor while markets showed duress in 2015.
Sandiaga Uno, having stepped down as President Director at the last
Shareholder’s meeting, provides some thoughts not as a valedictory
message as he pursues a role in public service, but as an ongoing
shareholder, actively invested for the long term.
Dear Shareholders,
Staying focused
These are extraordinary times, and I feel fortunate that we have an extraordinary team at Saratoga, not just in managing change and volatility during the past 12 months but in demonstrating their ability to capitalize on signiicant opportunities.
Financial performance
Given weaker sentiment, investment outlows and the depreciation of the Rupiah, the net asset value of the portfolio had declined from IdR22 trillion to IdR14 trillion, at the close of 2015. however, I am pleased to report positive news on the inancial performance of Saratoga over the past 12 months. The company generated 48% earnings growth, captured value through the listing of our investee Merdeka Copper Gold and broadened the company’s sources of funds using an exchangeable bond. Two new investments in operating companies were agreed and implemented.
Active but prudent investing
Saratoga has adequate liquidity to ensure we are able to capture investment opportunities as they arise. we continue to monitor our levels of leverage and will consider selective divestments if the terms are suiciently attractive. Just such a case has materialized post-reporting date, through the sale of our interest in the PT Pulau Seroja Jaya.
I have referred in the past to our track record as a long-term investor. From the origins of Saratoga we have established two imperatives, irstly, to be thorough in knowing our shareholder partners and their ability. And secondly the discipline and close attention we pay to the inherent risks involved in every business in which we invest. I hope that in reading this report a better appreciation of Saratoga and our philosophy comes through. Saratoga closed the year with a well spread portfolio of investments in 22 companies, 11 of them listed. Our diversity and depth provides private shareholders with a unique portfolio proposition: to participate in the signiicant growth potential across the natural resources, infrastructure and consumer sectors over the medium term. Of equal importance, we provide opportunities via our investment network, to gain access to private companies in early stage and highly prospective businesses, where substantial value has yet to be realized.
Corporate Governance
during the year the Board of Commissioners met on ive occasions and jointly three times with the Board of directors to examine and review the company’s performance in accordance with the annual and medium term business plans and we are satisied with their performance. The Board of Commissioners also reviewed the work of the Audit Committee and Nomination and Remuneration Committee and a full account of the work of the governance committees is included in this report.
There was one change to the Board of directors, with Michael w.P. Soeryadjaya being appointed as the President director as my long time business partner and fellow shareholder, Sandiaga Uno, takes up key duties in the public sector. I take this opportunity to thank Sandiaga for his considerable contribution, his leadership and wise counsel in building Saratoga to one of Indonesia’s most successful investment companies. Sandiaga has resigned from all active involvement in day-to-day management, while he will remain fully invested as a major shareholder.
PRESIDENT COMMISSIONER’S LETTER
People
One of our highest priorities as an active investor is people – both within Saratoga itself and our investee companies. It has been encouraging to see the extent of investment in capacity building and the development of leadership and skills across the group. Saratoga’s annual CXO network was once again a valuable opportunity for investees to share ideas and build synergy among leaders within the group. And I am delighted to note the level and range of responsible community, social and environmental activities undertaken over the year.
Outlook for 2016
The Board of Commissioners remains cautious but positive about the future. Our conidence is founded on our knowledge of Indonesia’s natural strengths in the resources and consumer base, coupled with our extensive network. We believe this positions us as capable investment partners, providing strong inancial and management support. Our sentiments are shared; the World Bank predicts a ‘new normal’ of lower global growth and has forecast above 6% GDP growth for this region - a respectable level of expansion by any measure. Indonesia at current asset values, with low private sector debt, easing credit conditions and massive domestic consumer markets – quite apart from the enviable resource base - ofers as compelling a prospect as ever. Let Saratoga be your investment partner for 2016.
On behalf of the Board of Commissioners, I extend our thanks to the Board of directors and convey our appreciation for the eforts made by the many who work diligently within our invested companies, to our own team at Saratoga for their hard work during a challenging year and to our shareholders and stakeholders. we look forward to the year ahead.
For and on behalf of the Board of Commissioners,
Edwin Soeryadjaya, President Commissioner
The Board of Commissioners remains
cautious but positive about the future. Our
conidence is founded on our knowledge
of Indonesia’s natural strengths in the
resources and consumer base, coupled with
our extensive network.
Indonesia at current asset values, with low
private sector debt, easing credit conditions
and massive domestic consumer markets –
quite apart from the enviable resource base
- ofers as compelling a prospect as ever. Let
Saratoga be your investment partner for 2016.
14
Sandiaga Uno completed his term as President Director in June 2015, to pursue a new role, in support of Indonesia’s economic development.
As a shareholder, I have been blessed for more than 15 years to be part of Saratoga,
in sharing a vision with Edwin Soeryadjaya and in being able to realize outstanding
growth and value in this company, a irst for Indonesia.
Our progress over this time has been considerable and I have come to realize
this is entirely because of the prospects, diversity and potential of the Indonesian
economy. We always saw Saratoga as an asset contributing positively
to the development of our nation through entrepreneurial endeavor.
As entrepreneurs we’ve created over 40,000 jobs and livelihoods,
supporting economic transformation by investing in the development
of vital sectors in natural resources, in infrastructure development
and the widening of consumer choice. I believe we have been able to
spread inspiration and innovation in the process. My experience in this
transformation has led to a greater involvement in policy formulation
and implementation at the national level, via the Indonesian Chamber
of Commerce and Industry, a lengthy tenure in the National Economic
Council and ultimately as a spokesperson in the last presidential
election campaign in 2014.
The chance to positively inluence thousands of people via Saratoga’s operations has
sparked a realization that there are opportunities to make a diference to the lives of
millions of other Indonesians. And so I took the decision last June to embark on a new
role to serve my country in the formulation of advice and implementation of policies and
platforms at national level, to facilitate greater participation in the economic growth, to
promote local and inclusive growth with equity.
In taking this period of absence, I have resigned from active duty in all aspects of the
group but I will stay invested. In order to avoid any conlict of interest, I will play no
role in day-to-day management decisions, in line with the strict governance code that
has proved so efective at Saratoga.
I leave the business in very capable hands and appreciate my colleagues for their
acceptance and trust in my decision. I am extremely honored to be associated with
the Saratoga group and look forward to witnessing further success in the years to
come. I also look ahead with anticipation towards Indonesia’s future as a modern
democracy, providing welfare and justice for its citizens and the fulillment of national
aspirations for a place among the top ten largest economies worldwide.
sandiaga s. uno
LETTER FROM
SHAREHOLDER
Dear Shareholder,
saratoga stayed focused in 2015.
Equity valuations at the end of 2015 relected a
general downturn in global markets, the underlying economic slowdown regionally
and Indonesia’s exposure to commodity prices in particular.
While recognizing and adapting to these conditions, our Board did not share
in the negative sentiment. We prefer to retain all our major positions, as core to
our strategy. In any downturn there are always valuable opportunities to consider
and we took several during the year which we believe ofer considerable upside.
There comes a point of positive change in every cycle. Emerging from a challenging
year, we are indeed seeing some signs of recovery in selected sectors.
Looking back at 2015, we can record a number of positive achievements
and sound progress among our investee companies.
Here’s why we remain upbeat. We unlocked considerable value of over
IDR1 trillion through the listing of Merdeka Copper Gold and celebrated
irst gold production at Sumatra Copper & Gold. We completed a vital
toll road, part of the Trans Java highway, opening up West Java and
enormous commercial and local trade potential. Our highly successful
USD100 million Exchangeable Bond issue provided us with cost efective
capital and underlined our ability as an active investor to monetize and
fund our investments. We made new investments in oil & gas exploration
and electrical power generation, aligned with the government's efort to expedite
infrastructure development.
Saratoga has stayed focused on the natural resources, infrastructure and
consumer product and services sectors where we see considerable potential, and
where we have extensive knowledge and experience.
NATURAL RESOURCES
INFRASTRUCTURE
CONSUMER
% of Portfolio's Sum of the Parts Michael W.P. Soeryadjaya, President Director, provides an overview of the Saratoga portfolio and underlines the value of a consistent approach during investment cycles
REPORT OF
THE BOARD OF
DIRECTORS
35%
59%
7% early stage companies
Agro Maju Raya
Sihayo Gold
Sumatra Copper & Gold
Finders Resources
Agra Energi Indonesia
Tenaga Listrik Gorontalo
3%
growth companies
Merdeka Copper Gold
Provident Agro
Interra Resources
Lintas Marga Sedaya
Medco Power Indonesia
Tri Wahana Universal
Paiton Energy
Nusa Raya Cipta
Seroja Investment
Sinar Mentari Prima
Pulau Seroja Jaya
Etika karya Usaha
Gilang Agung Persada
Mitra Pinasthika Mustika
33%
listed blue chips companies
Adaro Energy
Tower Bersama Infrastructure
65%
16
Saratoga’s strategy
We have been consistent in our business model, to invest in early stage, growth and listed blue chip companies, to identify platforms for organic growth and to remain active in supporting our partners. We prefer to take a longer view, looking for appropriate additions and synergies for stimulating new growth potential while remaining alert to potential exit opportunities.
Two key investment themes underline our consistent approach First, retaining our sectoral approach
Natural resources, infrastructure and the consumer products & services are the realities of Indonesia today, the nation’s comparative advantages, and the focus of progress being made in economic policy. Government spending including disbursements on infrastructure gained momentum in the second half of the year and made a signiicant contribution to national GDP as shown in the table below.
G O V E R N M E N T I N F R A S T R U C T U R E I N V E S T M E N T A N D S T E A DY C O N S U M E R S P E N D I N G U N D E R P I N N E D S E C O N D H A L F G D P G R O W T H
expenditure (yoy, %) 2014 2015 Q1 ‘15 Q2 ’15 Q3 ‘15 Q4 ‘15
Household expenditure 5.1 5.0 5.0 5.0 5.0 5.0
Government expenditure 2.0 5.4 2.9 2.6 7.1 7.3
Investment 4.1 5.1 4.6 3.9 4.8 6.9
Exports 1.0 -2.0 -0.6 -0.01 -0.6 -6.4
GDP growth 5.02 4.79 4.71 4.67 4.73 5.04
Source: Indonesia Central Bureau of Statistics
We committed to follow-on investments in our toll road operator and a new interest in Paiton Energy via Batu hitam Perkasa. The stable earnings base in supplying electrical power needs ofers substantial rewards and is fully aligned with Government policy to ramp up the national power supply.
while expansion among telecommunications operator-customers eased in 2015, Tower Bersama continued to invest in organic growth. Indonesia’s weakness in physical infrastructure thus far, actually underscores the value of our vast tower network of over 12,000 locations providing vital connectivity to sustain commerce across the archipelago. Increased use of smart phones, now increasingly afordable in tandem with e-commerce will underpin growth in the years ahead.
In copper and gold resources, our invested companies are entering a phase of signiicant value generation. Gold’s rising appeal is not solely driven by turbulence in inancial markets, as central bank reserve purchases climbed 25% in 2015, but in physical demand across the Asian region. Indonesia is one of the six largest gold producers worldwide and Saratoga's investments in gold and copper include four publicly listed companies. The Merdeka owned asset alone will generate signiicant gold production starting 2017 for nine years, before commencing a second stage development, of the 11th largest copper resource in the world: time enough for a
market recovery for undervalued copper.
Second, the importance of investing in sectors with high growth potential and early stage companies
despite weaker sentiment, consumer spending was relatively stable in 2015. MPM consumer automotive business outperformed the competition, weathering the downturn in demand and expanding our share of the large East Java market in motorcycle sales. In only our second year as a nationwide Nissan dealer, sales of passenger cars were boosted by an impressive 175% indicating there are always opportunities for those willing to capture them.
we remain positive on Indonesia’s demographic bonus and middle class expansion, to drive future demand. Rising disposable incomes, a low debt to GdP ratio, successive interest rate cuts and benign inlation point to substantial upside. we see good prospects for lifestyle retailing, for consumer auto and inancial services, in mobile data usage and in ‘new’ sectors such as cold storage. Saratoga is invested in all of these.
demographic growth in Indonesia is fast outpacing the expansion of land under food cultivation with millions of new mouths to feed in the coming years. Our investments in palm oil represent about 11% of the total portfolio and are on the cusp of new growth, the average age proile of palms just entering the most productive phase from 8 to around 20 years. This improvement to yield is coinciding with a recovery in CPO prices that appears sustainable, after a protracted downturn, coupled with El Nino drought conditions in 2015. Consequently, inventories are low while demand in food, oleochemicals and personal products continues to expand.
REPORT OF THE BOARD OF DIRECTORS
OUTLOOk
In 2015, the investment committee reviewed and considered a wide range of potential new opportunities, with two new investments in operating companies meeting the right criteria. In total, we made IDR304 billion in new investments and IDR339 billion follow-on investments in 2015 to strengthen and support existing investee companies.
New investments
In July we completed the joint establishment of PT Agra Energi Indonesia, an early-stage oil and gas exploration company with a management team highly experienced in deep water drilling. As oil majors are focused on global cutbacks and divesting Indonesian assets, we see strong potential as a local player in this sector. We continued to ind ways to evaluate and access early growth companies, which has been our focus since the early days of Saratoga and the source of many successes to date.
In August, we took a further positive step towards our aim to participate fully in energy generation as a natural extension of Adaro, our ‘pit to power’ integrated mining business, by acquiring equity in Batu hitam Perkasa and ownership in Paiton Energy, one of Indonesia’s largest IPPs.
Towards year-end we entered into an agreement to take an interest in one of the leading players in cold storage and refrigerated trucking services known as Mulia Bosco Logistik. Subsequent to balance sheet date we completed the investment. Mulia Bosco Logistik serves a large number of blue chip clients in frozen consumer goods brands, a sector we view as having substantial growth potential as modern retail continues to
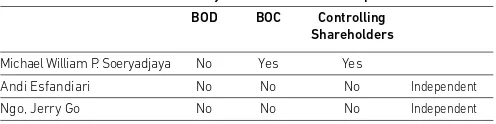
Andi Esfandiari, Portfolio Director, provides a review of key developments in the portfolio
expand. The company has a competitive edge in excellent representation and a large vehicle leet serving a growing number of cities - generating considerable loyalty and hence regular contract renewals. we like the scalability and the highly committed service standards – something we have already developed in MPM, among our other consumer businesses.
Identifying synergistic opportunities
we continued to explore cross platform opportunities both within individual investee operations, for example, the MPM consumer automotive group, and to other Saratoga invested companies. Ofering Insurance services to group companies has been a key growth area. By diversifying and expanding inancing sources, overall funding costs can be lowered, and a larger balance sheet improves MPM’s ability to trade with a broader range of clients.
where appropriate, in addition to capital support, the Saratoga group’s inancial expertise is available to our investees to assist them to obtain competitive terms for inancing growth. Following its successful IPO, with shareholder backing, Merdeka’s management has successfully arranged medium term inancing to complete mine development and commence production with cash low generation in 2017.
While recognizing th
e efects of the recent
cyclical downturn, we continue to focus on
the opportunities that Indonesia’s strong
fundamentals ofer. We will remain consistent
in selecting only those investments that suit
our strengths and areas of expertise. And we
will stay focused on developing the existing
portfolio, demonstrating our willingness to
pursue long term investment horizons where
we see long term upside.
18
The economic backdrop
Indonesian GDP growth moderated to a six year low at 4.79% compared to 5.02% in the previous year. A series of policy packages were announced throughout the year to encourage investment and revitalize domestic industry, once budget approvals were in place, increased
spending on infrastructure helped the beginnings of recovery in the economy over the second half. Tax revenue shortfalls and an expanding iscal deicit remain areas of concern.
Current trends in selected commodities indicate a number of instances of prices having bottomed out. Low oil prices remain a double-edged sword, a welcome saving to small and medium enterprise, while dampening plans to invest in reserve development and production. Meanwhile, the Government continues to conirm intentions for the expansion of alternative and renewable forms of energy. Job creation as ever remains vital. Any meaningful recovery will depend on sustaining investments in infrastructure and productivity capacity that will in turn support consumer demand which represents over half of the economy. The availability and afordability of household debt and mortgage inance to address the shortfall of 15 million homes and the ability of the banks to deliver attractive credit terms are other key factors, with consensus estimates for 2016 suggest economic growth at or above 5% to be likely.
Jerry Ngo, Finance Director, provides an update on the economy, earnings, and the inancial position
Overview of the 2015 results
Saratoga delivered strong earnings growth in 2015 against the prevailing economic headwinds. Net proit for the year grew 48% to IdR923 billion with earnings due to shareholders rising from IdR230 to IdR340 per share.
key among a number of positive factors in our inancial performance was the unlocking of value of IdR1.03 trillion in newly listed Merdeka Copper Gold, improved spreads in our consolidated oil reining business boosted gross proit by 30% to IdR964 billion and other income from investee companies proits amounted to IdR477 billion within total net other income of IdR1.01 trillion.
despite tougher trading conditions, cost discipline helped preserve core earnings in investees and an increased number of investees contributed to dividend income, indicating the maturity of the portfolio. A gain was made of IdR269 billion on the fair value of the Exchangeable Bond. Consolidated interest expenses were 33% higher at IdR370 billion relating to the medium term Rupiah note facility and foreign exchange costs of IdR211 billion were incurred in relation with USd denominated debt. Total consolidated debt increased to IdR5.2 trillion providing adequate liquidity for our forseeable requirements, with manageable debt service.
Opportunities will continue to be forthcoming, and we are well prepared. That we have reviewed over 300 potential projects in the last three years is clearly indicative of our recognized proile as an active investor and a discerning one, capable of assisting projects and providing efective solutions in inancing and value creation, divesting from time to time when we believe we have achieved our objectives for growth and value.
Over the past two years so we have been successful in diversifying our sources of funds and in doing so have obtained attractive terms for our immediate needs and will not be taking on further debt for the time being.
As an investment irm Saratoga does not follow the conventions of an operating company, yet our status as a listed entity obliges us to report as such. In an efort to provide all shareholders and the public with a clearer, more transparent approach to presenting our inancial report we have commenced exploratory discussions with the regulatory authorities to adopt the principles of fair value accounting, which we feel will provide a more appropriate statement of our performance on an ongoing basis. we will keep all shareholders updated on this development.
MANAGEMENT DISCUSSION
AND ANALySIS
2
C H A P T E R
In this chapter our commentary covers all
aspects of o
ur inancial performance for the year.
The year 2015 saw us realize considerable value
in listing one of our mining companies, increased
proitability through our unique investments,
commence cashlow from our toll investments
and broaden our dividend sources.
The Management Discussion and Analysis chapter should
be read in conjunction with the company’s consolidated
inancial statements which form an integral part of this
annual report.
As an active investment company, Saratoga measures
its performance in terms of Net Asset value, in the share
of investee proits and in dividend income received.
In order to comply with prevailing Financial
Accounting Standards, Saratoga’s consolidated inancial
statements are presented under three methods:
•
Consolidation – where we hold more than 20% of the
shares and have management control in the relevant
company.
•
Investments in Associates – where our share is equal
to or above 20% but without management control and
we apply the equity method
•
Available For Sale – where our share is less than 20%
and we apply the cost method. For listed companies
in this category, we determine value by marking to
market; for non-listed companies we use book value.
Saratoga’s inancial reports are currently presented
in a similar way to those of conglomerate companies. Out
of the 22 operating companies, Saratoga consolidated
two investee companies: PT Tri Wahana Universal, the
oil reinery company, and PT Sinar Mentari Prima, the
shipping company, in which we hold more than 20%
shares and have management control.
Throughout the MD&A chapter, we discuss and
analyze both consolidated results and whenever relevant,
the results of Saratoga-parent level. We deine
Sarato-ga-parent level here to include Saratoga parent entity and
fully-owned holding subsidiaries (non-operational) with
direct ownership (refer to Financial Note 1E, Exhibit E/3).
This deinition is not to be confused with
Sarato-ga-parent entity only as presented in the Financial Reports
Exhibit F/1 – F/6 in accordance with prevailing Financial
Accounting Standards, in which case the deinition
consists of Saratoga parent entity only, excluding all
subsidiaries.
N E T A S S E T VA LU AT I O N A S P E R 3 1 D E C E M B E R 2 0 1 5
INVESTMENTS
NATURAL RESOURCES
PT Adaro Energy Tbk IDR 16.38% 491 2,572 16.38% 1,049 5,500 (2,927) (53%)
PT Provident Agro Tbk. IDR 44.16% 505 1,588 44.16% 494 1,553 36 2%
Sumatra Copper & Gold plc AUD 28.16% 0.04 86 27.35% 0.04 67 19 28%
Sihayo Gold Limited AUD 18.14% 0.01 28 18.14% 0.01 22 6 28%
Finders Resources Limited AUD 7.11% 0.13 60 6.85% 0.14 67 (8) (12%)
Interra Resources Limited SGD 15.67% 0.09 68 17.79% 0.16 122 (54) (44%)
PT Merdeka Copper Gold Tbk. IDR 18.89% 2,005 1,352 20.56% Book value 275 1,077 391%
PT Agro Maju Raya IDR 25.00% Book value 158 25.00% Book value 287 (129) (45%)
PT Agra Energi Indonesia IDR 35.53% Book value 68 0.00% - - -
-INFRASTRUCTURE
PT Tower Bersama Infrastructure Tbk. IDR 30.22% 5,911 8,581 30.03% 9,641 13,911 (5,330) (38%)
PT Nusa Raya Cipta Tbk. IDR 6.97% 604 105 7.01% 1,159 202 (97) (48%)
Seroja Investment Limited SGD 23.26% 0.06 49 23.26% 0.073 63 (13) (21%)
PT Tri Wahana Universal IDR 35.00% Book value 512 35.00% Book value 343 170 50%
PT Medco Power Indonesia IDR 12.30% Book value 314 12.30% Book value 246 68 28%
PT Tenaga Listrik Gorontalo IDR 46.25% Book value 77 46.25% Book value 91 (14) (15%)
PT Lintas Marga Sedaya IDR 18.00% Book value 336 18.00% Book value 321 15 5%
PT Pulau Seroja Jaya IDR 9.61% Book value 27 9.61% Book value 27 - 0%
PT Sinar Mentari Prima IDR 50.00% Book value 119 50.00% Book value 90 29 32%
PT Batu hitam Perkasa IDR 16.67% Book value 28 0.00% - - -
-CONSUMER
PT Mitra Pinasthika Mustika Tbk. IDR 47.62% 468 994 47.62% 790 1,680 (685) (41%)
PT Etika karya Usaha IDR 29.40% Book value 91 29.40% Book value 94 (3) (3%)
PT Gilang Agung Persada IDR 4.17% Book value 63 4.17% Book value 63 - 0%
Others IDR 258 225 33 15%
sum of investee companies 17,536 25,249 (7,713) (31%)
- Debt 4,540 3,406 1,465
+ Cash 588 333 255
net asset value 13,583 22,176 (8,923) (39%)
net asset value per share (idr) 5,007 8,174 (3,167) (39%)
M a rk e t P ri c e C ur re n c y 2 w k s V W A P M a rk e t P ri c e V alu a ti o n (ID R b ill io n ) CURRENT 31 December 2015
BI MID RATE PER 31 DECEMBER 2015
USDIDR 13,795
AUDIDR 10,064
SGDIDR 9,751
BI MID RATE PER 31 DECEMBER 2014
USDIDR 12,440
AUDIDR 10,218
SGDIDR 9,422
DISCLAIMER: The information contained in this document is intended solely for the use of our internal reference. We used conservative method to do the above calculation. There might be some diference of calculation against the market value. we make no representations or warranties, express or implied, with respect to the information herein.
R E V I E W O F I N V E S T M E N T A C T I V I T I E S
No. Company IDR billion
NEW INVESTMENTS 304.05
FOLLOW ON INVESTMENTS 338.75
1. Sumatra Copper & Gold plc 21.34
2. PT Lintas Marga Sedaya 41.44
3. PT Merdeka Copper Gold Tbk. 142.41
4. Sihayo Gold Limited 0.40
5. PT Medco Power Indonesia 0.57
6. PT Agro Maju Raya 67.50
7. PT Tower Bersama Infrastructure Tbk. 65.08
TREASURy STOCk 5.91
TOTAL DEPLOyMENT 648.70
C h a n g e (ID R b ill io n ) C ha n g e (%) E f e c ti v e O w n e rs h ip 2 w k s V W A P M a rk e t P ri c e V alu a ti o n (ID R b ill io n ) E f e c ti v e O w n e rs h ip
PREVIOUS yEAR END
31 december 2014 c h a p t e r 2 m a n a g e m e n t d i s c u s s i o n & a n a l y s i s
C O N S O L I D AT E D S TAT E M E N T O F C O M P R E H E N S I V E I N C O M E IDR Billion
Description 2015 2014* Increase
(decrease) %
Net Revenue 4,282 6,124 (30%)
Cost of Revenue (3,318) (5,385) (38%)
Gross Proit 964 739 30%
Operating expenses (300) (224) 34%
Operating proit 664 515 29%
Other income 1,013 504 101%
Proit before tax 1,677 1,019 64%
Income tax expense (225) (133) 69%
Proit for the year 1,452 886 64%
Other comprehensive income (716) (103) 596%
Total comprehensive income 736 783 (6%)
Proit attributable to:
Owner of the Company 924 625 48%
Non-controlling interest 528 261 102%
1,452 886 64%
Total comprehensive income for the year attributable to:
Owner of the Company 194 514 (62%)
Non-controlling interest 542 269 101%
736 783 (6%)
Revenues, COGS and Gross proit
Our revenues are derived from the consolidated operating entities of PT Tri Wahana Universal (TWU), an oil reinery company responsible for 97.5% of the 2015 consolidated revenue and the remaining from PT Sinar Mentari Prima (SMP), a company
engaged in loating storage and oloading vessels.
In 2015, we posted revenue of IdR 4.3 trillion, a decrease of 30% from previous year. The breakdown of the revenue is presented below:
C O N S O L I D AT E D R E V E N U E IDR Billion
description 2015 2014 Change
Oil reinery 4,176 6,034 (31)%
Floating storage oloading vessel 98 88 12%
Others 8 2 337%
Total 4,282 6,124 (30)%
The decline in consolidated revenue relected the downward movement of oil prices from USd56.4 / barrel at the beginning of the year to USd37.3 / barrel by the end of 2015. however, the improvement in the spread between market references used for the purchase price and those for the company’s sale price contributed a 30% gain in gross proit, despite the downtrend in oil prices.
The purchase price of supplies to TwU was based on local crude prices on a monthly basis, while TwU reined product sales prices were determined every two weeks based on the Mean of Platts Singapore (MOPS) Gasoil 0.25% for high Speed diesel and MOPS hSFO 180 CST for vacuum Tower Bottom.
2 Jan 13 2 Mar 13 2 Ma
y 13
2 Jul 13 2 Sep 13 2 No
v 13
2 Jan 14 2 Mar 14 2 Ma
y 14
2 Jul 14 2 Sep 14 2 No
v 14
2 Jan 15 2 Mar 15 2 Ma
y 14
2 Jul 15 2 Sep 15 2 No
v 15
MARKET PRICE
Gasoil 0.25%s (USD/bbl) ICP Ardjuna (USD/bbl) NHSFO 18CST (USD/bbl)
Source: Platts
140.000
120.000
100.000
80.000
60.000
40.000
20.000
* Restated
T W U S A L E S A N D G R O S S P R O F I T IDR Billion
2015 2014* Change
Sales 4,176 6,034 (31)%
COGS 3,261 5,307 (39)%
Gross proit 915 727 26%
Gross proit margin 22% 12% 83%
In 2015, TWU achieved record production 9% higher at an average of 15,248 bopd in 2015, compared to 13,978 bopd in the previous year.
T W U R E F I N E RY P R O D U C T I O N V O LU M E kiloliter
Products 2015 2014 Change
high Speed Diesel 589,892 545,901 8%
vacuum Tower Bottom 274,101 237,130 16%
Straight Run Gasoline 8,111 10,127 (20)%
Total 872,104 793,158 10%
Operating expenses
The 2015 consolidated operating expenses, incurred by TWU, SMP and Saratoga-parent only, amounted to IDR300 billion, an increase of 34% compared to previous year. The increase was mainly contributed to the following expenses:
• Trucking expenses in relation to our reinery business, due to a change in transportation arrangement with the buyers amounting to IDR29 billion.
• Research and development costs for the 2nd phase to expand
production capacity and eiciency amounted to IdR12 billion.
• Professional fees incurred in Saratoga-parent level for an
extension on the tenor on undrawn borrowing facility and write-of on discontinued project cost amounting to IdR11 billion
• Tax expense in relation to Saratoga – parent level utilizing the 2015 Tax Sunset Policy on withholding tax on employee shares allocation during initial public ofering and new accounting treatment on withholding tax amounting to IdR12 billion. Saratoga-parent entity’s operating cost is driven by employee salary and bonus cost of IdR65 billion or 48 basis point of NAv and consultant costs of IdR18 billion or 13 basis point of NAv. The legal and consultant costs resulted from establishing funding facility and performing due diligences in exploring opportunities and acquiring new investments.
In 2015, we received 101 opportunities, of which 54 went into preliminary assessments, 39 into due diligence and 8 went into term sheet process. we ended the year by investing in 2 new operating companies.
Other operating income – net
OT H E R O P E R AT I N G I N C O M E IDR Billion
Description 2015 2014* Increase
(decrease)
%
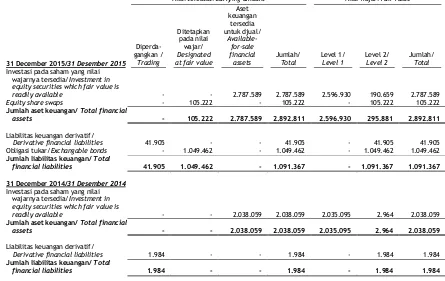
Gain from dilution efect in investment 1,031 - 100%
Net share of proit of equity-accounted investees 477 764 (38%)
dividend, interest and investment income 76 188 (60%)
Gain on fair value of exchangeable bonds 269 - 100%
Loss on fair value equity swap (78) - 100%
Net loss on exchange rate diferences (211) (53) 295%
Interest expenses (370) (279) 33%
Net (loss) gain on derivative inancial instruments (48) 2 (2,805%)
Impairment loss from available-for-sale inancial assets (86) (102) (16%)
Other expense - net (49) (15) 235%
Other operating income - net is mostly driven by Saratoga-parent level income from investment activities and cost on funding activities. In 2015, we booked IdR 1,013 billion in other operating income-net, which increased 101% compared to previous year.
highlights on operating income - net in 2015:
• we booked a total of IdR1,031 billion of income through a
listing of our investee company, PT Merdeka Copper Gold Tbk. (MdkA) on the IdX in June 2015. The MdkA market value is recorded directly as income post IPO due to a change of ownership in MdkA. Saratoga invested in MdkA through PT Trimitra karya Jaya (TkJ) with an efective ownership prior to the listing of 25.7% and 16.5% after the listing. This placed the investment below the 20% threshold, and in accordance to SFAS (PSAk) No. 55 "Financial Instrument", Saratoga post fair value of its investment, being market value in the case of a listed company as its new deemed acquisition cost.
• we booked IdR269 billion on the fair value of the Exchangeable Bond (EB). The EB contains optionality value which was considered as embedded derivatives. Therefore, the Company designated it as inancial liabilities measured at fair value through proit or loss on initial recognition. The fair value of the EB as of 31 december 2015 was 76 bps.
• Consolidated interest expense of IdR370 billion was mainly
driven by the increase in our US dollar denominated borrowing, and higher interest expenses relating to the Medium Term Notes. Additionally, there were higher transaction costs from extension of the period for undrawn borrowings, plus a one-of upfront fee relating to the issuance of the EB.
• Net share of proit from associates declined to IdR477 billion impacted by continuing weakness in commodity prices and the general slowdown in the economy and consumer conidence in 2015.
• Foreign exchange diferences of IdR211 billion were incurred
relating to US dollar borrowing as the IdR weakened by 10% against the US dollar. Saratoga’s exposure is partially hedged through US dollar denominated earnings by various investees. hedging costs proved too high with limited hedging options available to cover longer-term exposures. we regularly acquire US dollars through the spot market and direct purchases from investee companies.
*Restated
c h a p t e r 2 m a n a g e m e n t d i s c u s s i o n & a n a l y s i s
DISCLOSURES ON KEY RESULT FOR NET SHARE PROFIT FROM ASSOCIATES
Investee Company Ownership Income from
associate
PT Mitra Pinasthika Mustika Tbk. 47.62% 47.62% 137 224 (88)
PT Etika karya Usaha 49.00% 49.00% (3) 15 (18)
SUB TOTAL - CONSUMER PRODUCT 134 239 (105)
PT Tower Bersama Infrastructure Tbk. 30.27% 30.08% 431 214 217
PT Saratoga Infrastruktur 50.00% 50.00% 1 (0) 1
PT Saratoga Power 24.11% 24.11% 12 12 0
PT Bangun Daya Perkasa 50.00% 50.00% 4 (5) 9
Seroja Investment Limited 23.26% 23.26% - 6 (6)
PT Baskhara Utama Sedaya 26.05% 25.64% (32) 51 (83)
SUB TOTAL - INFRASTRUCTURE 416 278 138
PT Adaro Strategic Capital 25.00% 25.00% 168 159 9
PT Adaro Strategic Lestari 29.79% 29.79% 67 64 3
PT Agro Maju Raya 25.00% 25.00% (94) (43) (51)
PT Provident Agro Tbk. 44.16% 44.16% (23) 74 (97)
PT hamparan Sawit Nusantara 25.00% 25.00% 0 0 0
PT Merdeka Copper Gold Tbk. 18.89% 25.70% (18) (11) (7)
PT Agra Energi Indonesia 35.53% - (3) - (3)
Sumatra Copper & Gold plc 28.16% 27.35% (170) 4 (174)
SUB TOTAL - NATURAL RESOURCES (73) 247 (320)
GRAND TOTAL 477 764 (287)
key drivers behind the 2015 results as follows:
• In the Consumer sector, PT Mitra Pinasthika Mustika Tbk. delivered a lower net share proit from IDR487 billion to IDR285 billion due to the slowdown in market demand and higher costs relating to expansion of the Nissan dealership, plus further impairments for the inancial services arm. • In the Infrastructure sector, PT Tower Bersama Infrastructure
Tbk. delivered a net proit of IDR1.4 trillion, compare with IDR700 billion in 2014, restated in accordance with the implementation of SFAS No. 46 – Deferred Tax. The underlying business remained solid as demonstrated by a 7% increase in EBITDA of IDR2.9 trillion, translating to an EBITDA margin of 85%. Tower Bersama strategically focused on expansion in 2015 through organic growth.
• In the Natural Resources sector, PT Adaro Energy Tbk. delivered a lower net share proit of USD152 million in 2015 compared to USD178 million in 2014, relecting the continued weakness of coal prices. Adaro successfully lowered coal cash costs by 16% to USd27.98 per tonne which resulted in a strong operational EBITdA margin of 27%, among the highest of Indonesian thermal coal producers. The operational EBITdA of USd730 million and core earnings of USd293 million relect Adaro’s fundamental earning power. PT Provident Agro Tbk. incurred losses, impacted by a decline of 18% in CPO selling price driven by global market conditions. Nonetheless the company was able to boost volume by 17% as its palm plantations matured into the optimally productive age range of above 7 to 18 years. As a result, for the second year in a row Provident Agro maintained a positive EBITdA, of IdR244 billion in 2015.
CONSOLIDATED STATEMENTS OF FINANCIAL POSITION
C O N S O L I D AT E D A S S E T S IDR Billion
Description 2015 2014 Increase
(decrease) %
CURRENT ASSETS
Cash and Cash Equivalents 401 538 (26%)
Trade Receivable from third parties 305 621 (51%)
Non-trade receivables:
Related parties 78 62 26%
Third parties 42 5 724%
Available-for-sale inancial assets - current 30 232 (87%)
Inventories 190 91 109%
Prepaid Taxes 6 6 (6%)
Advance and Prepaid Expenset 56 130 (57%)
Restricted cash 318 38 746%
Non-current asset held for sale 139 139 0%
Other current assets 4 4 21%
total current assets 1,569 1,866 (16%)
NON-CURRENT ASSETS
Non-trade receivables:
Related parties 117 23 403%
Third parties 32 100 (68%)
Available-for-sale inancial assets 2,839 1,860 53%
Investments in equity-accounted investees 10,518 10,138 4%
Advances for investments in shares 111 431 (74%)
Financial assets measured at fair value
through proit and loss 105 -
-Investment properties 115 113 2%
Fixed assets - net 1,189 1,151 3%
Intangible assets 2 2 (22%)
deferred tax assets 3 3 11%
Goodwill 101 153 (34%)
Other non-current assets - 1 (100%)
Total Non-current Assets 15,132 13,975 8%
total assets 16,701 15,841 5%
As of 31 december 2015, Consolidated Assets increased by 5% from IdR15,841 billion in 2014 to IdR16,701 billion. The growth mainly derived from the increase in Available for Sale Financial Assets and Investment in Associates was driven by the realization of investment value through Initial Public Ofering of PT Merdeka Copper Gold Tbk.
2015 2014 varianc
e
2015 2014
IDR Billion
Cash and Cash Equivalents & Restricted Cash
The consolidated cash and cash equivalents consisted of cash in hand and in banks (third parties) both in IDR and foreign currencies (USD, AUD and SGD). Cash and cash equivalents decreasedfrom IDR538 billion to IDR401 billion, due to the transfer of Cash to Restricted Cash to fulill borrowing covenants during the decline in equity market. Restricted Cash increased from IDR 38 billion to IDR318 billion accordingly. Consolidated cash and cash equivalents and restricted cash increased from IDR576 billion in 2014 to IDR 719 billion in 2015.
For Saratoga-parent only, cash and cash equivalents and restricted cash increased from IDR333 billion in 2014 to IDR588 billion in 2015.
Trade Receivables from Third Parties
Trade receivables mainly consisted of receivables from our reinery business. Trade receivables as of end 2015 decreased by 51% from IDR621 billion to IDR305 billion, due to the decline in the sales price of reined oil products.
Collectability of Receivables
Our receivables are coming from highly reputable major oil companies such as PT Pertamina (Persero), PT Pertamina Patra Niaga and Mitsui Energy Trading Pte Ltd (Singapore). Moreever in 2015, sales turnover improved from 37 days to 26 days.
As there is no unforeseen diiculties in collecting these receivable, there is no need for any impairment allowance for receivables at this time.
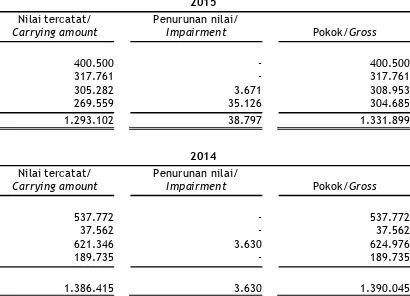
Available for Sale Financial Assets
The Available-For-Sale (AFS) inancial assets consist of Saratoga's investments with less than 20% of ownership and case we apply the cost method. For listed companies categorized as AFS, we determine the fair value using closing market price, in proportion to our efective ownership in the company. For unlisted companies, we apply historical investment cost.
Total AFS increased by 37% from IdR2,092 billion in 2014 to IdR2,869 billion in 2015, mainly due to the investment in Merdeka Copper Gold.
In 2015, we listed PT Merdeka Cooper Gold Tbk. resulting in a net increase investment value of IdR1,031 billion. At the same time, due to dilution in efective ownership after listing, investment in Merdeka can no longer be categorized as Investment in Equity Accounted Investees but should be categorized as AFS. As of 31 december 2015, Merdeka’s market value was IdR1,519 billion.
Investment in Associates
I N V E S T M E N T I N E Q U I T Y- A C C O U N T E D I N V E S T E E S IDR Billion
Description 2015 2014 Increase
(decrease) %
PT Adaro Strategic Capital 3,255 2,831 15%
PT Adaro Strategic Lestari 1,297 1,129 15%
PT Mitra Pinasthika Mustika Tbk 2,296 2,282 1%
PT Tower Bersama Infrastructure Tbk 1,908 1,810 5%
PT Provident Agro 766 763 0%
PT Baskhara Utama Sedaya 320 321 0%
PT Saratoga Power 314 246 28%
PT Agro Maju Raya 158 220 (28%)
PT Etika karya Usaha 68 71 (5%)
PT Agra Energi Indonesia 68 - 100%
PT Bangun daya Perkasa 55 68 (20%)
PT Saratoga Infrastruktur 13 13 6%
PT Merdeka Copper Gold Tbk. - 267 (100%)
Sumatra Copper & Gold plc - 118 (100%)
Total 10,518 10,138 4%
Investment in equity - accounted investees consists of Saratoga’s investments with 20% or more ownership without management control in the company. we apply the equity accounting method in which we value the company based on its investment cost adjusted by proit/loss in proportion to our ownership in the relevant company.
Consolidated Liabilities
Our consolidated liabilities were IdR5,221 billion as of 31 december 2015, an increase of 9% in comparison with last year. The increase was mainly driven by the increase of borrowings for our investment activities, relected in our Non-Current Liabilities.
C U R R E N T L I A B I L I T I E S IDR Billion
Description 2015 2014 Increase
(decrease) %
Trade payables to third parties 20 20 1%
Other payables
Third parties - 66 (100%)
Advance from sale of investment 32 30 6%
Accrued expenses 90 76 18%
Income tax payables 79 121 (35%)
Other tax payables 56 48 18%
Unearned revenues 11 11 0%
derivative inancial liabilities 42 2 2012%
Current maturities of long -term borrowings 705 434 63%
Total 1,035 808 28%
c h a p t e r 2 m a n a g e m e n t d i s c u s s i o n & a n a l y s i s
In order to service debt, Saratoga - parent level maintains several sources of cash low:
1. Dividend Income
D I V I D E N D I N C O M E IDR Billion
Company Name 2015 2014* Increase
(decrease) %
Adaro Energy 179 129 39%
Nusa Raya Cipta 5 5 7%
Mitra Pinasthika Mustika 10 - 100%
Tri wahana Universal 74 100%
Tower Bersama - 136 (100%)
Total 268 270 (1%)
In 2015, we recognized IdR268 billion in dividend income from PT Adaro Energy Tbk. (IdR179 billion), PT Mitra Pinasthika Mustika Tbk. (IdR10 billion), Nusa Raya Cipta (IdR5 billion) & PT Tri wahana Universal (IdR74 billion).
we continue to receive dividends from an increased number of investee companies from year to year. Prior to 2013, we received dividends from PT Adaro Ene