ASSESSMENTS OF SENTINEL-2 VEGETATION RED-EDGE SPECTRAL BANDS FOR
IMPROVING LAND COVER CLASSIFICATION
Shi Qiu, Binbin He*, Changming Yin, Zhanmang Liao
University of Electronic Science and Technology of China, Chengdu, Sichuan 611731, China
KEY WORDS: Classification, Sentinel-2, Multi spectral instrument, Vegetation red-edge, Land cover
ABSTRACT:
The Multi Spectral Instrument (MSI) onboard Sentinel-2 can record the information in Vegetation Red-Edge (VRE) spectral domains. In this study, the performance of the VRE bands on improving land cover classification was evaluated based on a Sentinel-2A MSI image in East Texas, USA. Two classification scenarios were designed by excluding and including the VRE bands. A Random Forest (RF) classifier was used to generate land cover maps and evaluate the contributions of different spectral bands. The combination of VRE bands increased the overall classification accuracy by 1.40%, which was statistically significant. Both confusion matrices and land cover maps indicated that the most beneficial increase was from vegetation-related land cover types, especially agriculture. Comparison of the relative importance of each band showed that the most beneficial VRE bands were Band 5 and Band 6. These results demonstrated the value of VRE bands for land cover classification.
* Corresponding authorTel.: 86 28 61831586 E-mail address: [email protected]
1. INTRODUCTION
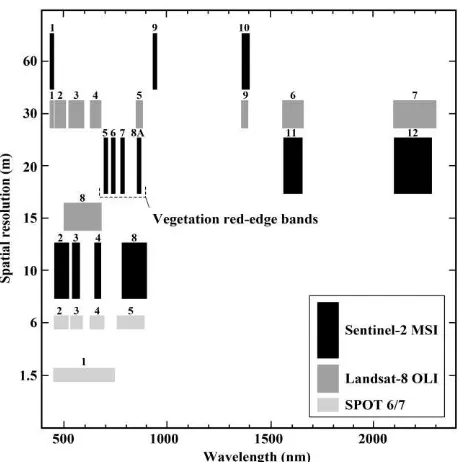
Land cover impacts on many parts of the human and physical environments, and its production has a long history in the remote sensing community. Many land cover maps have been produced using moderate-high spatial resolution remotely sensed data, such as Landsat and SPOT (Satellite Pour l'Observation de la Terre) datasets (Bartholome and Belward, 2005; Fuller, et al., 1994; Homer, et al., 2004). Recently, the availability of Sentinel-2 with more spectral bands provides significant new opportunities and challenges for mapping land cover. Compared with the data obtained from the previous optical satellites, the Multi Spectral Instrument (MSI) onboard Sentinel-2 can record the information in Vegetation Red-Edge (VRE) spectral domains (Figure 1). However, the integration of more information is not always helpful to improve the classification accuracy, which is determined by the high correlations between input variables and the necessity of more parameters to be estimated in classifier (Pal, et al., 2006; Zhu, et al., 2016). Thus, the necessities and effectiveness of VRE bands of Sentinel-2 MSI data are needed to be assessed for improving the land cover classification accuracy.
2. STUDY AREA AND DATA
2.1 Study area and Sentinel-2 MSI data
The study area, with an area of 100 km2, is located in East Texas, USA (Figure 2). It is dominated by different land cover types, including forest, grassland, water, urban, agriculture, etc. These diverse land covers provide a good opportunity of testing the performance of VRE bands in classification.
A cloud-free Sentinel-2A MSI Level-1C image (T001639) acquired at 29, September, 2016 (Figure 2) was downloaded from U.S. Geological Survey (USGS) at EarthExplorer (http://earthexplorer.usgs.gov/). The Level-1C image is Top of Atmosphere (TOA) reflectance product already processed by radiometric and geometric corrections with sub-pixel accuracy (HUHET, 2015). To reduce the effect contributed from the
atmosphere, the TOA data were converted into Bottom of Atmosphere (BOA) reflectances using the Sen2Cor tool (E.S.A, 2017). Meanwhile, all of the spectral bands were resampled to 10 m spatial resolution using nearest neighbour approach.
Figure. 1. Comparison of spatial resolution and wavelength characteristics of Sentinel-2 Multi Spectral Instrument (MSI), Landsat-8 Operational Land Imager (OLI), and SPOT 6/7 Instruments. (from ESA Sentinel-2 User Handbook)
2.2 Land cover categories and sample data
The sample data used in this study were extracted from USGS’s Land Cover Trends (LCT) 2000-2011 dataset (USGS, 2017). While the LCT was originally designed to analyse the land cover change of United States (Loveland, et al., 2002), it has been proved to be sufficient as reference data for classification The International Archives of the Photogrammetry, Remote Sensing and Spatial Information Sciences, Volume XLII-2/W7, 2017
ISPRS Geospatial Week 2017, 18–22 September 2017, Wuhan, China
This contribution has been peer-reviewed.
Figure. 2. Study area and data. The middle background is the true color composited Sentinel-2 MSI image (Bands 4, 3, and 2). A total of 10 Land Cover Trends (LCT) sample blocks (three parts) are located within the image. The two ignored disturbance classes (mechanically disturbed and non-mechanically disturbed) are marked by dotted box.
(Zhu, et al., 2016). The LCT dataset consists of many randomly-distributed 10 km × 10 km sample blocks throughout the United States, in which 11 land cover categories (detailed at
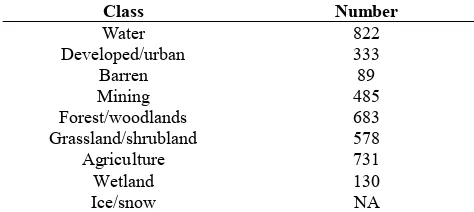
http://landcovertrends.usgs.gov/main/classification.html) were manually interpreted at scale of 30 m for multi target years. Focusing on the classification, we excluded the two disturbance classes (i.e., mechanically disturbed and non-mechanically disturbed) in LCT and only used the remaining 9 stable categories (Table 1). And, a total of 1,000 samples were randomly selected from each of the 9 land cover types based on the LCT mapping results from 2010 (the nearest to the acquired date of the Sentinel-2A MSI image). To further ensure the correctness of randomly-selected samples, we carefully examined each of them using high resolution images in Google EarthTM and the obtained Sentinel-2A image. After removing incorrect pixels, the remaining 3,851 samples were used as the reference data in this study (Table 1). Note that there is no ice
Table 1. 9-catagories used in this study. NA: Not Available.
3. METHOD
3.1 Input variables
Ten spectral bands of the Sentinel-2A MSI image (Bands 2, 3, 4, 5, 6, 7, 8, 8A, 11, and 12) were used as the input variables. To assess the relative importance of the spectral features of VRE bands for classification, we simply designed two scenarios by excluding and including VRE bands: Scenario 1 (Bands 2, 3, 4, 8, 11, and 12) and Scenario 2 (Bands 2, 3, 4, 5, 6, 7, 8, 8A, 11, and 12).
3.2 Random forest classifier
Random Forest (RF) classifier was used to generate land cover maps and evaluate the performance of different input variables on map accuracy. The RF classifier is an ensemble classification method that uses trees as base classifiers {h(x, Θk), k=1, …},
where x is the input vector and {Θk} are the independent and
identically distributed random vectors (Breiman, 2001). RFC can run on large data bases, handle thousands of input variables, and assess the relative importance of the different variables. The RFC is easy to run by setting the number of trees and the number of prediction variables at each node. In this study, a total of 500 trees were grown, and the square root of the number of total input variables were used as the number of prediction variables at each node (Zhu, et al., 2016).
3.3 Accuracy evaluation
The randomly-selected samples were used as the basis for assessing the accuracies of classification results. All of samples were randomly separated into two groups, one group with 80% used to train the RFC and another one with 20% used to assess the classification accuracy (Fielding, et al., 1997). This assessment was repeated 50 times, and the confusion matrices, producer's accuracies, user's accuracies, and overall classification accuracies were used to compare the results from different scenarios. Meanwhile, a Paired t-test at 95% significance level was performed for the accuracy of each classification results to test whether the observed accuracy increase is statistically significant.
4. RESULTS AND DISCUSSION
The confusion matrixes for the two different classification scenarios are presented in Table 2 and Table 3, respectively. The overall classification accuracy was 71.75% (Table 2) only using the Bands 2, 3, 4, 8, 11, and 12 (Scenario 1). When combing the four VRE bands (Scenario 2), the overall accuracy (73.15%) increased by 1.40%, which was statistically significant in the Paired t-test (at 95% level). Except for the producer's and user's accuracy for water, the user's accuracy for developed, and the producer's accuracy for barren, all increased at different degrees by adding VRE bands. However, there are large areas of developed and barren incorrectly identified as The International Archives of the Photogrammetry, Remote Sensing and Spatial Information Sciences, Volume XLII-2/W7, 2017
ISPRS Geospatial Week 2017, 18–22 September 2017, Wuhan, China
This contribution has been peer-reviewed.
mining no matter whether the VRE bands were inputted or not (red cycle in Figure 3c). This kind of commission error was made mostly due to their similar spectral features (Figure 4). The visual assessment indicated that the real accuracies for mining may not be good as the statistics accuracies (Table 2 and 3). Those results demonstrated that the integration of VRE bands is helpful to improve the classification accuracy, especially for the vegetation-related land cover types (forest, grassland, agriculture, and wetland). D=Developed, M=Mining, B=Barren, F=Forest, G=Grassland, A=Agriculture, W2=Wetland. D=Developed, M=Mining, B=Barren, F=Forest, G=Grassland, A=Agriculture, W2=Wetland.
Figure 3. A subset area (5.7 km × 4 km) of the presented LCT’s region (Figure 2) for illustrating the classification results from different input variables. a) Map from Scenario 2. b) Map from Scenario 1. c) True colour composited image (Bands 4, 3, and 2). d) Difference between maps derived from Scenario 1 and 2.
By carefully comparing the land cover map derived from the inputs including VRE bands (Figure 3a) and the one obtained from the inputs excluding VRE bands (Figure 3b), we found the basic pattern for the two land cover maps were very similar.
However, the most obvious difference between the two maps were located in the boundary of different land cover types and within agriculture (Figure 3d). The differences showed the VRE bands of Sentinel-2 MSI image have a special contribution to improve the identification of agriculture, which agreed with the substantial increase of its accuracies (both producer’s accuracy and user’s accuracy were more than 2%).
Figure. 4. The average BOA reflectance of each band for developed, mining, and barren based on all sample points. BOA: Bottom of Atmosphere.
To analyse the relative contributions of the spectral bands for land cover classification, we presented their relative importance in Figure 5. The Band 3 worked best in land cover classification for the Sentinel-2 MSI image. Moreover, except for the Band 8A, the remaining three VRE bands (Bands 5, 6, and 7) were also helpful to improve the classification accuracy. The contributions of Band 5 and Band 6 on land cover classification were not less than Bands 2, 4, 8, and 12.
Figure. 5. Importance of the ten spectral bands (Bands 2, 3, 4, 5, 6, 7, 8, 8A, 11, and 12) of Sentinel-2 MSI data.
5. CONCLUSION
By testing an autumn (September) Sentinel-2 image at scale of 10 m located in East Texas, USA, the combination of VRE bands improved the overall classification accuracies by 1.40%, which was statistically significant. The adding VRE bands was helpful to identify vegetation-related land cover types, especially agriculture. Regarding the four VRE bands of Sentinel-2 MSI data, Band 5 and Band 6 presented substantial contributions on the improvement of land cover classification, which were not less than the normal bands (Bands 2, 4, 8, and 12).
ACKNOWLEDGEMENTS
This work was supported by the National Natural Science Foundation of China (Contract No. 41471293 & 41671361), the Fundamental Research Fund for the Central Universities (Contract No. ZYGX2012Z005).
The International Archives of the Photogrammetry, Remote Sensing and Spatial Information Sciences, Volume XLII-2/W7, 2017 ISPRS Geospatial Week 2017, 18–22 September 2017, Wuhan, China
This contribution has been peer-reviewed.
REFERENCES
Bartholome, E. M., & Belward, A. S., 2005. GLC2000: a new approach to global land cover mapping from Earth observation data. International Journal of Remote Sensing, Vol. 26, pp. 1959-1977.
Breiman, L., 2001. Random forests. Machine learning, Vol. 45, pp. 5-32.
E. S., Agency. Level-2A Prototype Processor for Atmosphericterrain and Cirrus Correction of
Top-of-Atmosphere Level 1C Input Data. Available:
http://step.esa.int/main/third-party-plugins-2/sen2cor/ (Jan., 6, 2017)
Fielding, A. H. & Bell, J. F., 1997. A review of methods for the assessment of prediction errors in conservation presence/absence models," Environmental conservation, Vol. 24, pp. 38-49.
Fuller, R., Groom, G., & Jones, A., 1994. Land cover map of Great Britain. An automated classification of Landsat Thematic Mapper data. Photogrammetric Engineering and Remote Sensing,Vol. 60.
Homer, C., Huang, C., Yang, L., Wylie, B., & Coan, M., 2004. B. Wylie, and M. Coan. Development of a 2001 national land-cover database for the United States. Photogrammetric Engineering & Remote Sensing, Vol. 70, pp. 829-840.
Loveland, T., Sohl, T., Stehman, S., Gallant, A., Sayler, K., & Napton, D., 2002. A Strategy for Estimating the Rates of Recent United States Land Cover Change. Photogrammetric Engineering and Remote Sensing, Vol 68, pp. 1091-1099.
Pal, M., 2006. Support vector machine‐ based feature selection for land cover classification: a case study with DAIS hyperspectral data. International Journal of Remote Sensing, Vol. 27, pp. 2877-2894.
Sayler, K. L., Acevedo, W., Soulard, C.E., & Taylor, J.L., 2005. Land cover trends dateset, 2000-2011. ed: U.S. Geological Survey.
SUHET, 2015. Sentinel-2 User Handbook. E. S. Agency, Ed., 1.2 ed.
U. S. G. Survey. Land Cover Trends Project. Available:
http://landcovertrends.usgs.gov/main/classification.html (Jan. 6, 2017).
Zhu, Z., Gallant, A. L., Woodcock, C. E., Pengra B., Olofsson P., Loveland, T. R., et al., 2016. Optimizing selection of training and auxiliary data for operational land cover classification for the LCMAP initiative. ISPRS Journal of Photogrammetry and Remote Sensing,Vol. 122, pp. 206-221. The International Archives of the Photogrammetry, Remote Sensing and Spatial Information Sciences, Volume XLII-2/W7, 2017
ISPRS Geospatial Week 2017, 18–22 September 2017, Wuhan, China
This contribution has been peer-reviewed.