Kimia Amouzandeh a and Farid Karimipour a
a School of Surveying and Geospatial Engineering, College of Engineering, University of Tehran
{amouzandeh.kimia, fkarimipour}@ut.ac.ir
KEY WORDS. Spatial movement analysis, Movement observations, Spatio-temporal patterns, Orienteering.
ABSTRACT:
Study of movement observations is becoming more popular in several applications. Particularly, analyzing sport movement time series has been considered as a demanding area. However, most of the attempts made on analyzing movement sport data have focused on spatial aspects of movement to extract some movement characteristics, such as spatial patterns and similarities. This paper proposes statistical analysis of sport movement observations, which refers to analyzing changes in the spatial movement attributes (e.g. distance, altitude and slope) and non-spatial movement attributes (e.g. speed and heart rate) of athletes. As the case study, an example dataset of movement observations acquired during the “orienteering” sport is presented and statistically analyzed.
1. INTRODUCTION
Analysis of movement data is a recent trend of research in GIScience. Recent and emerging positioning technologies and wearable sensors have resulted in significant increases in the availability of highly accurate data on moving phenomena (Gudmundsson et al. 2011). “The study of trajectory behavior of moving objects intends to transform raw data in useful information to the decision making process, knowledge discovery, and reality interpretation” (Wang et al. 2016). In particular, analysis of movement observations, which contain information about the movement of each individual entity and the underlying mechanisms, are of great interest. Thus, new exploratory tools and knowledge discovery techniques are required to extract meaningful information, discover interesting patterns, and explore the dynamic behavior of moving objects by using visual, analytical and exploratory methods (Karimipour et al. 2016). Positional data and ancillary observations are key to the study and understanding of movement (Dodge et al. 2016) and to describe objects behavioral and cognitive proceeds. They are employed to study the behavioral movement patterns and their impacts on the target object.
Analysis of movement data is becoming more popular in several applications. Among others, attempts have been made to analyze movements in sport scenes (Gudmundsson and Wolle 2010; Memmert and Perl 2009; Taki and Hasegawa 2000). However, they have mostly focused on spatial aspects of the movement to extract some movement characteristics, such as patterns and similarities. This research proposes examining the behavioral movement patterns of athletes by analyzing time series of spatial movement attributes (e.g. altitude and slope) and non-spatial movement attributes (e.g. speed and heart rate) of each individual athlete during a competition. We believe analyzing the athletes’ movement observations in terms of space (x, y, z) and time (t), through considering movement attributes
of each athlete (e.g. heartrate and speed) and contextual information (e.g. the environmental information such as land cover) will direct us to better understanding of behavioral movement patterns of athletes and the effect of different situation on athlete’s performance. In other words, we aim to identify the effect of athletic status (e.g. elite vs. amateur) and of surface (e.g. road vs. forest) on the movement patterns. This paper considers movement observations of “orienteering” sport and statistically analyses them to discover simple movement patterns. We also determined the effect of slope mean on movement characteristics. The results verify that such movement observations contain a significant level of information in order to be exploited in extracting more sophisticated behavioral movement patterns. For instance, the movement parameter profiles (Dodge et al. 2009) show that direction and magnitude of slope influence behavioral movement patterns. example dataset of the movement observations extracted during the orienteering task is presented. Finally,Section 4 presents the concluding remarks and outlines directions for future work.
2. STATE OF THE ART
2.1 Analysis of movement pattern
Movement is a key element of many processes and activities. Understanding the movement itself, as well as the patterns of movement is very important in many areas of science and technology (Dodge 2011). Capturing trajectory data at fine temporal and spatial granularities has allowed representation, and consequently analysis, of detailed geospatial lifelines.
STATISTICAL ANALYSIS OF SPORT MOVEMENT OBSERVATIONS: THE
CASE OF ORIENTEERING
Spatio-temporal sequences of a person provide unprecedented opportunities to explore patterns of life through space-time analytics of movement and stops of individuals (Yuan and Nara 2015). Especially, coupling such data with field observations enable extraction of movement patterns that contain information about preferences regarding individual decision-making and locational choices (Karimipour et al. 2016). For example, Analyzing tourist behavior in parks – such as places visited, time spent and facilities used – can help managers adapt infrastructure and facilities to offer more diverse options to different visitor groups or to route visitors to a range of park security cameras. Travel mode detection is another issue that is important to transport planning and movement behavior analysis (Das and Winter ; Zheng et al. 2010).
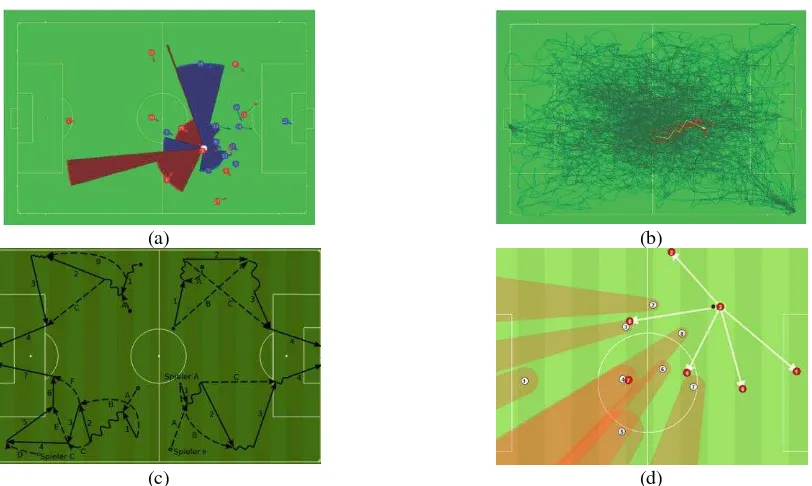
In particular, professional sports have widely been influenced by such analyses. For example, Gudmundsson and Wolle (2010) deployed trajectory clustering techniques to study frequent movements of an individual football player and groups of players (Figure 1.a and 1.b). In the same regards, Grunz et al. (2009) used a neural network-based approach follows the by Fujimura and Sugihara (2005) and by Kang et al. (2006) by including an advanced modelling of human movement. Even, some systems have been developed to analyze football matches in real time. Those systems consist of a hardware (object tracking) component, where the positions of the players, balls and referees are tracked via video, radio or GPS tracking, which are then used by coaches to analyze the performance of the players and choosing the best strategy. The amount of knowledge gained ranges from a single number (running performance) to complex movement patterns. It is categorized into three levels: basic level, which mainly consist of pure measurements or simple aggregations (e.g. distance, heat map, sprints and etc.), the medium level, which enables the coach to evaluate the behavior of the team in respect to the a priori given tactical rules and it consist of passes and shots, pass graphs, player roles and etc., and finally advance level, where coaches are able to find pass sequence patterns to determine passing possibilities or to recognize movement patterns (Figure 1.d) (Feuerhake 2016).
(a) (b)
(c) (d)
Figure 1. (a) Passable regions visualized with red (to players in the same team as the ball holder) and blue (to players in the opposite team); (b) Movement of a player, and a cluster of frequent movements highlighted in red (Gudmundsson and Wolle 2010). (c) different patterns of motion and interaction (Grunz et al. 2009). (d) Passing possibilities of a ball possessing player (the black dot is
the ball; possible passes are marked via white arrows).
As mentioned, previous efforts to analyses sport movement data have mostly focused on spatial aspects of the movement to extract some movement characteristics, such as patterns and similarities. An exception is Hollman et al. (2007), which examined the effect of age on gait velocity and stride-to-stride variability during normal and dual task walking conditions. There are also research that studies the effect of different situations on runners' biomechanics (Bert-Losier et al. 2015; Hébert‐Losier et al. 2014). Myers and Mitchell (2013) deployed three-dimensional equations describing the motion through the
air of a spinning ball. The analytical solution shows explicitly how a soccer ball motion depends on parameters such as ball roughness, velocity and atmospheric conditions.
2.2 Spatio-Temporal Patterns in Sport Movement Observations: The Case of Orienteering
This research proposes examining the behavioral movement patterns of athletes by analyzing changes in different spatial movement attributes (e.g. altitude and slope) and non-spatial movement attributes (e.g. speed and heart rate). Orienteering is The International Archives of the Photogrammetry, Remote Sensing and Spatial Information Sciences, Volume XLII-4/W4, 2017
selected as a case study. Orienteering is a family of sport that requires navigational skills using a map and compass to navigate from point to point in diverse and usually unfamiliar terrain, and normally moving at speed. There are two major forms of orienteering competition (Scouts 1995):
• Score (- or free) orienteering: Here, many checkpoints are placed in an area of 1 to 2 kilometers around the starting point, which is also considered as the finish line, with different scores depending on the distance to the start point or the level of difficulty to find. Competitors have certain time to find as many checkpoints as they can (in any order they wish) and earn as large a total score as possible. Therefore, they must judge the time well and evaluate their abilities to run and read orienteering map.
•Cross-country (- or point-to-point) orienteering: In this case, every competitor must visit the same checkpoints in the numerical order as quickly as possible. This form of orienteering is challenge in route choice and stamina.
In both forms of orienteering, competitors choose their route around the course. Hence, they confront many possible challenges such as terrain barriers or obstacles, artificial features, level of physical fitness and so on.
There have been considerable researches on spatial aspect of orienteering sport. For instance, there are lots of works about producing complete and accurate orienteering map. For example, He (2012) used GIS to produce orienteering map, design competition routes and locate control points. According to this research, the design of competition routes should follow some principles (e.g. a fair competition, gender dependency, field fabric dependency and etc.) (He 2012). Leung (2003) introduced alternative methods for course planning and mapmaking using GIS modelling techniques and analytical power. Course planning models make use of assessment tools in course-design scenario analysis to assess paths of suitable difficulty levels.
In addition to mentioned researches, it is expected that some personal and behavioral parameters such as age, weight and height of the person influence the athlete’s performance. For instance, Bert-Losier et al. (2015) Have identified the effect of athletic status and of surface on the running biomechanics of orienteers.
To the best of our knowledge, movement parameter profile so far has not been used to examine the behavioral movement patterns. By analyzing movement parameter profile, we can reach the behavioral movement patterns and the effect of contextual information on each pattern.
3. METHODOLOGY AND RESULTS
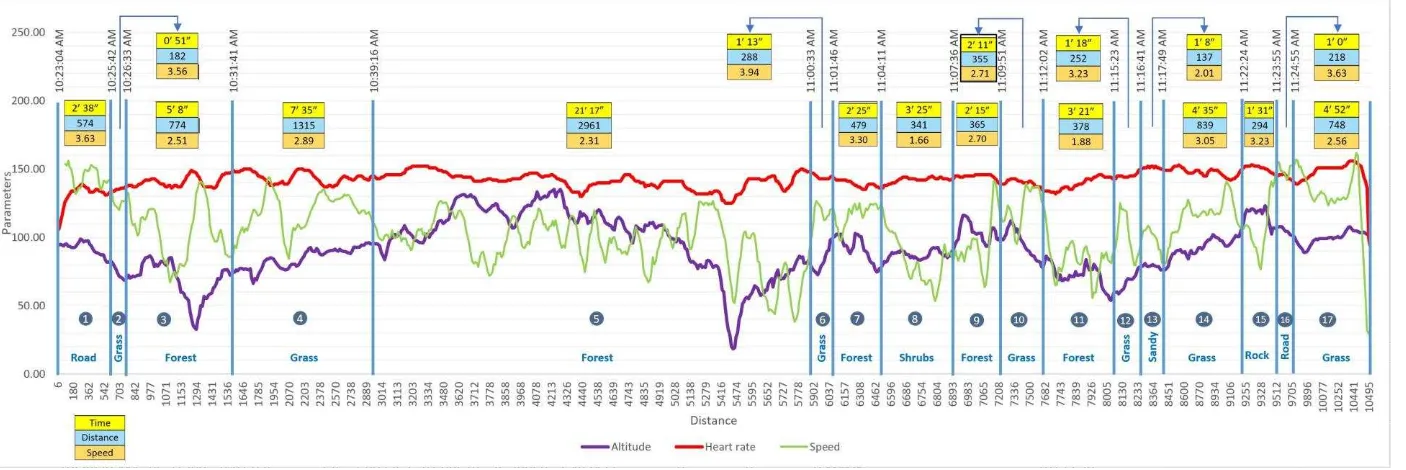
Understanding movement behavior need some statistical and computational analysis which can show the effect of spatial and non-spatial parameters on behavioral movement patterns. For this, according to Figure 4, we have considered some movement parameter profiles of an athlete which is including altitude, heart rate and speed. On the other hand, the path was divided
into several sections based on the land cover and computed the duration, distance, thereby the average speed of each section, hoping that relations can be found between these parameters in four levels:
(1)An individual section: behavioral movement patters of athletes can be investigated in an exact time limit. (2)Sections of the same type: In this level, behavioral
movement pattern of an athlete is examined in a specified land cover.
(3)The whole path: Most of the times, there exists some relationships between movement parameters profile, which usually changes with personal and environmental conditions
As our previous work, some behavioral movement patterns can be detected visually. For example, in the first part of section 5 (Figure 4), where the land cover is forest, the altitude is ascending, which caused an increase in the heart rate and speed. However, in the next part of this section, the altitude is descending, thus it does not influence the heart rate; instead the heart rate is in direct relation with speed (Karimipour et al. 2016).
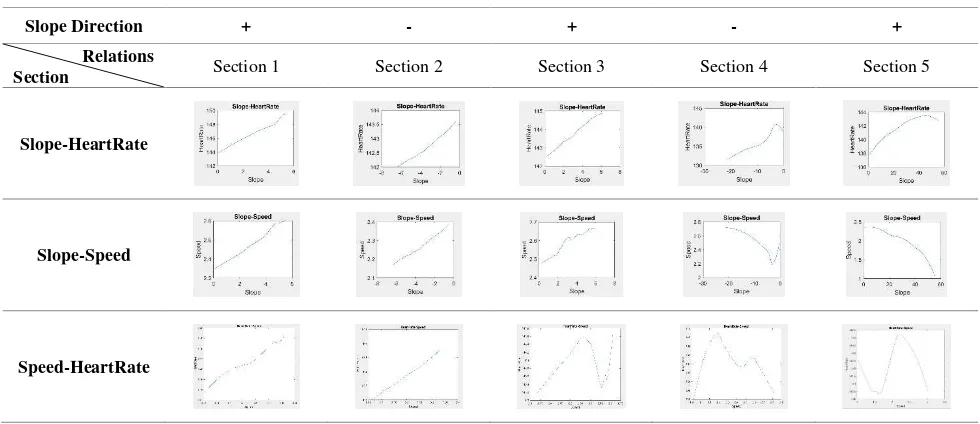
In this paper, we have focused on behavioral movement patterns in an individual section. For this, section 5, where the land cover is forest, have been divided into several parts based on slope direction (Figure 2). For example, considering positive slope direction, in section 1 and 3 the altitude is ascending, which caused an increase in the heart rate and speed. However, in section 5, although the slope direction is positive, the speed trend is opposite to section 1 and 3. It is probably because of the magnitude of slope. According to Table 1, in section 5, the range of slope is from 0 to 60 although in section 1 and 3, this range is from 0 to 6. Therefore, we can say that in forests, the tendency of speed respect to slope depend on slope mean. In addition to visual analysis of graphs (Table 1), the following linear correlation has been used to compute the correlation correlation between slope and speed is completely different. Therefore, it can be said that the slope mean only has effect on speed, and does not influence the heart rate.
Figure 2. Movement parameter profiles of section 5 (forest) in Figure 4.
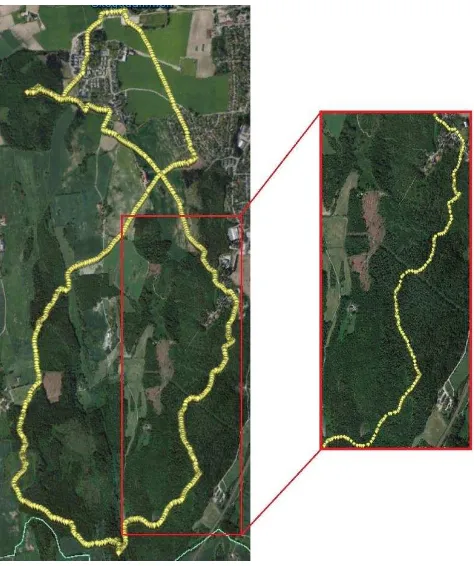
Figure 3. The path taken by an orienteering athlete. Right figure shows the path corresponded to the Section #5 in Figure 3 in more details.
Figure 4. Movement observations corresponded to the path illustrated in Figure 2, including altitude, heart rate, speed, as well as the land cover The International Archives of the Photogrammetry, Remote Sensing and Spatial Information Sciences, Volume XLII-4/W4, 2017
Slope Direction + - + - +
Relations
Section Section 1 Section 2 Section 3 Section 4 Section 5
Slope-HeartRate
Slope-Speed
Speed-HeartRate
Table 1. Graphs of relation between spatial parameters (Slope) and non-spatial parameters (Heartrate and Speed).
Slope Direction + - + - +
Section
Relations Section 1 Section 2 Section 3 Section 4 Section 5
Slope-HeartRate 0.9507 0.8259 0.9305 0.8642 0.6417
Slope-Speed 0.9283 0.7766 0.5120 -0.6841 -0.6536
Speed-HeartRate 0.8319 0.9926 0.2325 -0.4776 0.1530
Table 2. Correlation between parameters
4. CONCLUSION
This paper proposed the idea of examining the behavioral movement patterns and relation between parameters of athletes by analyzing changes in different spatial movement attributes (e.g. Altitude and slope) and non-spatial movement attributes (e.g. speed and heart rate), which we believe leads to better understanding of behavioral movement patterns of athletes and the effect of different situation on athlete’s performance. Here, we presented a type of such information for a path taken by an orienteering athlete, in which some patterns can be detected. As a future extension of our research, we plan to develop a segmentation technique using some characteristics of the Movement Parameter Profiles to extract behavioral movement patterns. Moreover, we are going to use more contextual data (e.g. temperature, wind direction and etc.) and behavioral data (e.g. cadence) to explore behavioral movement pattern and the effect of different situation on patterns.
REFERENCES
Alvares, L.O., A.M. Loy, C. Renso, and V. Bogorny. 2011. An algorithm to identify avoidance behavior in moving object trajectories. Journal of the Brazilian Computer Society 17: 193-203.
Bert-Losier, K., L. Mourot, and H.-C. Holmberg. 2015. Elite and amateur orienteers’ running biomechanics on three surfaces at three speeds.
Das, R.D., and S. Winter. A Neuro-Fuzzy based Hybrid Intelligent Framework for Transport Mode Detection. Dodge, S. 2011. Exploring movement using similarity analysis. Dodge, S., R. Weibel, S.C. Ahearn, M. Buchin, and J.A. Miller.
2016. Analysis of movement data. International Journal of Geographical Information Science 30: 825-834.
Dodge, S., R. Weibel, and E. Forootan. 2009. Revealing the physics of movement: Comparing the similarity of movement characteristics of different types of moving objects. Computers, Environment and Urban Systems
33: 419-434.
Feuerhake, U. 2016. Recognition of Repetitive Movement Patterns—The Case of Football Analysis. ISPRS International Journal of Geo-Information 5: 208. Fujimura, A., and K. Sugihara. 2005. Geometric analysis and
quantitative evaluation of sport teamwork. Systems and Computers in Japan 36: 49-58.
Grunz, A., D. Memmert, and J. Perl. 2009. Analysis and simulation of actions in games by means of special self-organizing maps. International Journal of Computer Science in Sport 8: 22-37.
Gudmundsson, J., P. Laube, and T. Wolle. 2011. Computational movement analysis. In Springer handbook of geographic information, 423-438: Springer.
Gudmundsson, J., and T. Wolle. 2010. Towards automated football analysis: Algorithms and data structures.
Proc. 10th Australasian Conf. on mathematics and computers in sport.
He, X. 2012. Application of Geographic Information System in Orienteering Sports. In Business, Economics, Financial Sciences, and Management, 637-642: Springer.
Hébert‐Losier, K., K. Jensen, L. Mourot, and H.C. Holmberg. 2014. The influence of surface on the running velocities of elite and amateur orienteer athletes.
Scandinavian journal of medicine & science in sports
24: e448-455.
Hollman, J.H., F.M. Kovash, J.J. Kubik, and R.A. Linbo. 2007. Age-related differences in spatiotemporal markers of gait stability during dual task walking. Gait & posture
26: 113-119.
Kang, C.-H., J.-R. Hwang, and K.-J. Li. 2006. Trajectory analysis for soccer players. In Sixth IEEE International Conference on Data Mining-Workshops (ICDMW'06), 377-381: IEEE.
Karimipour, F., K. Amouzandeh, S.H. Chavoshi, and H. Tveite. 2016. Exploring Spatio-Temporal Patterns in Sport Movement Observations.
Leung, C.-M. 2003. Integration of modern GIS into orienteering course planning and map making. 香港大學學位論文: 1-0.
Meijles, E., M. De Bakker, P. Groote, and R. Barske. 2014. Analysing hiker movement patterns using GPS data: Implications for park management. Computers, Environment and Urban Systems 47: 44-57.
Memmert, D., and J. Perl. 2009. Game creativity analysis using neural networks. Journal of sports sciences 27: 139-149.
Myers, T., and S. Mitchell. 2013. A mathematical analysis of the motion of an in-flight soccer ball. Sports Engineering 16: 29-41.
Scouts, B. 1995. Orienteering(Merit Badge). Irving, Texas. Taki, T., and J.-I. Hasegawa. 2000. Visualization of dominant
region in team games and its application to teamwork analysis. In Computer Graphics International, 2000. Proceedings, 227-235: IEEE.
Wang, J., M. Duckham, and M. Worboys. 2016. A framework for models of movement in geographic space.
International Journal of Geographical Information Science 30: 970-992.
Yuan, M., and A. Nara. 2015. Space-time analytics of tracks for the understanding of patterns of life. In Space-Time Integration in Geography and GIScience, 373-398: Springer.
Zheng, Y., Y. Chen, Q. Li, X. Xie, and W.-Y. Ma. 2010. Understanding transportation modes based on GPS
data for web applications. ACM Transactions on the Web (TWEB) 4: 1.