ISSN (print): 1978-1520, ISSN (online): 2460-7258
DOI: 10.22146/ijccs.32142 95
Evaluating Library Services Quality Using GDSS-AHP,
LibQual, and IPA
Muhammad Ihsan*1, Reza Pulungan2, Afiahayati3 1
Ministry of Trade of the Republic of Indonesia, Indonesia 2,3
Dept. of Computer Science and Electronics, FMIPA, UGM, Yogyakarta, Indonesia e-mail: *[email protected], [email protected], [email protected]
Abstrak
Sistem evaluasi kualitas layanan perpustakaan yang dikembangkan dalam penelitian ini menggunakan metode Group Decision Support System-Analytical Hierarchy Process (GDSS-AHP), LibQual dan Importance-Performance Analysis (IPA). GDSS-AHP LibQual digunakan untuk menghitung bobot tiap butir pernyataan evaluasi dan tingkat kualitas layanan per-pustakaan berdasarkan persepsi dan ekspekta si pemustaka. IPA digunakan untuk menempatkan nilai-nilai tiap butir pernyataan evaluasi ke dalam empat kuadran IPA untuk memperoleh rek-omendasi peningkatan layanan perpustakaan. Penelitian ini dilakukan di Perpustakaan Kemen-terian Perdagangan, dengan melibatkan empat decision maker, yaitu: satu pimpinan per-pustakaan, satu pakar akademisi perper-pustakaan, dan dua pakar praktisi perpustakaan. Pemu s-taka yang dijadikan responden untuk menilai kualitas layanan sebanyak 50 responden. Ber-dasarkan pengujian pada sampel data diperoleh bahwa tingkat kepuasan pemustaka/responden adalah puas atau lebih, yaitu 44.86%. Di samping itu dilakukan juga pengujian usability ter-hadap sistem yang dikembangkan dengan menggunakan elemen observasi efektivitas, efisiensi, dan kepuasan. Pengujian usability dilakukan terhadap lima orang responden, satu orang a d-min, dan dua orang decision maker, dan diperoleh rerata tingkat usability sistem sebesar 90.03%.
Kata kunci— GDSS, AHP, LibQual, IPA, evaluasi, kualitas layanan perpustakaan.
Abstract
Library services quality is one of the most vital parts in library management. Evalua-tion of the library services based on the perspective of users is important. In this paper , we pro-pose a collaboration of Group Decision Support System-Analytical Hierarchy Process (GDSS-AHP), LibQual, and Importance-Performance Analysis (IPA) methods to evaluate library ser-vices quality. The collaboration of GDSS-AHP and LibQual is used to calculate the weight of
each evaluation statement and the level of library services quality based on users’ perception
and expectation. IPA is then used to determine the position of the value of each eva luation statement in the IPA’s four quadrants to obtain the recommendation level for the library ser-vices improvement. This study is conducted at the Library of the Ministry of Trade of Indonesia, involving four decision makers: a head librarian, a library academic expert, and two library practitioners. Fifty library visitors become respondents to assess the quality services
question-naires. Based on their responses, we obtain that users’ satisfaction level is at least satisfied by
76.49 %. Meanwhile, a usability testing is also conducted on the developed system by using three observation elements: effectiveness, efficiency and satisfaction. The usability testing is performed on five respondents, one admin, and two decision makers, and results in an average usability level of 90.03%.
1. INTRODUCTION
Library services quality is one of the most vital parts in library management, as it serves as the main element in meeting users’ needs. Evaluation of library services based on the per-spective of users is important because services should be assessed by those who receive them. LibQual protocol has become the de facto standard for providing a holistic assessment of users’ perception of library services [1]. The LibQual protocol consists of 22 core survey items. The items measure users' perception of library services quality in three dimensions: affect of service, information control, and library as place[2].
In the LibQual protocol, there is no weight level for each survey item and the protocol also has not been able to provide any conclusion of actions needed for services improvement.
The items’ weights should provide more comprehensive calculation in order to decide the level of services quality. Therefore, a method to calculate those weights is required. Analytical Hier-archy Process (AHP) is a method in decision-support system to provide consistent weights cal-culation. In order to remove the subjectivity in weights calculation, a group of people are in-volved in the process of calculation. This method is called Group Decision Support System (GDSS). Martilla and James [3] introduced Importance-Performance Analysis (IPA) method, also known as quadrant analysis, to measure the relationship between consumers’ perception and priority of services quality improvement.
Li and Yang [4] conducted a research on the evaluation of library services quality using Fuzzy AHP (FAHP) and LibQual. Their research invited three experts in a library to obtain FAHP weights, with 200 survey items. Their conclusion is that using FAHP could improve the evaluation process to obtain better accuracy. Do et al. [5] conducted a research on the evalua-tion of an academic library services quality using FAHP approach with trapezoid curve repre-sentation. FAHP could capture the vagueness of human judgments, provide systematic proce-dure proposals in the group decision making, and obtain a more accurate level of consensus. Ilham and Mulyana [6] conducted a research on GDSS to determine the location of
stu-dents’ placement in job training using AHP and Borda. Saputra and Wardoyo [7] also conducted a research on GDSS to determine the best employees using TOPSIS and Borda.
Wahyudin [8] conducted a research to find out students’ satisfaction index of library services at Universitas Pendidikan Indonesia, using Satisfaction Index of Society for data analy-sis technique and Analyanaly-sis of Importance of Results to obtain the level of conformity between services expectation and quality. The results showed that the library services performance is good enough. The most perceived service element was related to service security, while the least perceived service element is the discipline of the service personnel.
In this research, the quality of library services is evaluated using GDSS-AHP, LibQual and IPA. GDSS-AHP method is used to obtain the weights of criteria (LibQual’s three dime
n-sions) and subcriteria (LibQual’s survey items). The combination of GDSS-AHP and LibQual is used to obtain the level of services quality in general and to know the value of each evaluation statement according to the perception and expectation of users. IPA method, on the other hand,
is used to map the level of users’ perception and expectation to the four IPA quadrants, to obtain recommendations for services improvement.
The rest of the paper is organized as follows: Section 2 lays out our proposed method. In Section 3, we present the results of our experiments on using the proposed method in a par-ticular library. Section 4 concludes the paper.
2. METHODS
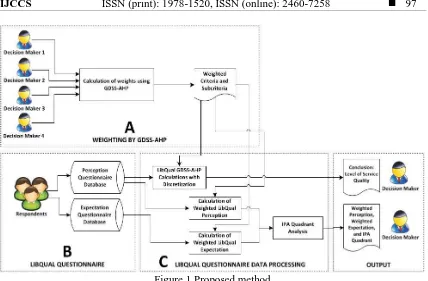
Figure 1 Proposed method
2.1 Weighting Criteria and Subcriteria Using GDSS-AHP
This weighting stage involves 4 decision makers, consisting of a head librarian at the Ministry of Trade, one library academic expert, and two library practitioners. The criteria and subcriteria used are shown in Table 1.
Table 1 Criteria and subcriteria for evaluating the quality of library services
No. Criteria Subcriteria
1. Affect of Service Appearance and tidiness (SC-1) Attitudes and behavior (SC-2) Responsiveness (SC-3) Librarian's ability (SC-4) Guidance from librarians (SC-5) Service hours (SC-6)
2. Information Control Collections updates (SC-7) Book collections (SC-8) Audio-visual collections (SC-9)
Newspaper and magazine collection (SC-10) Computer facilities (SC-11)
Internet/WIFI facilities (SC-12) Online journal collection (SC-13) Collection placement (SC-14) Self-service (SC-15)
Catalog search/OPAC (SC-16)
3. Library as Place Room design (SC-17)
Cleanliness and beauty (SC-18)
Lighting and temperature setting (SC-19) Conducive/comfort (SC-20)
The weighting steps using GDSS-AHP are as follows:
1. Each decision maker assigns a weight to each criterion and to each subcriterion. The weighting of these criteria and subcriteria refers to the procedure of AHP weighting measures according to Chun et al. [9], namely:
a. Creating a pairwise comparison matrix (B) by using the assessment scale of 1 to 9, whose rows and columns contain all operation elements of the same hierarchy level. A compo-nent at the i-th row and j-th column represents the preference comparison between opera-tion element i and operation element j. This matrix is reciprocal, where if, for instance, A1 is preferred over A2 with a preference comparison value of X, then A2 is preferred over A1 with the preference comparison value of 1/X. An operation element can be a cri-terion or a subcricri-terion, according to the computation being carried out.
b. Multiplying each element in each row of comparison matrix, as follows:
∏ , (1)
where Bi,j is the element of the comparison matrix at i-th row and j-th column, and n is the number of elements.
c. Calculating the square root of Mi, as follows:
̅ √ . (2)
d. Calculating the normalization of ̅, as follows: ̅
∑ ̅ (3)
e. Calculating the value of , as follows:
∑ ∑ , (4)
where Wj is the normalized weights vector of the j-th element. f. Calculating the Consistency Index (CI) value, as follows:
, (5)
where n is the number of elements.
g. Determining Random Index (RI) value according to Table 2. h. Calculating Consistency Ratio (CR) value, as follows:
. (6)
If the value of CR≤ 0.1 then it can be concluded that the pairwise comparison matrix is
already consistent. However, if the value of CR > 0.1, then the priority assessment should be repaired.
2. Calculating the global priority weight of each decision maker by multiplying the priority weight of the criteria with the priority weight of subcriteria obtained previously, as follows:
, (7)
where WSCd,s is the global priority weight of subcriterion s for decision maker d, wcd,c is the priority weight of criterion c for decision maker d, and wscd,s is the priority weight of sub-criterion s for decision maker d.
3. Calculating the total weight of GDSS-AHP for all decision makers, i.e., the average value of the global priority weighting of all decision makers, as follows:
∑
where WSCs is the average value of the global priority of subcriterion s for all decision mak-ers, and m is the number of the decision makers.
Table 2 Random Index (RI) for different matrix sizes (n×n) [10]
n 1 2 3 4 5 6 7 8 9 10 11
RI 0.00 0.00 0.58 0.90 1.12 1.24 1.32 1.41 1.45 1.49 1.51
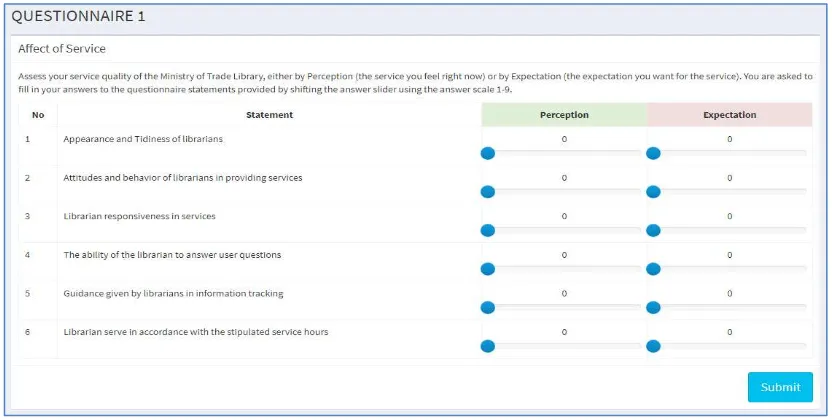
2.2 Developing an Evaluation Questionnaire
The evaluation questionnaire is based on the perception and expectation of the us-ers/respondents by referring to the criteria and subcriteria listed in Table 1. Part of the evalua-tion quesevalua-tionnaire is shown in Figure 2. Figure 2 represents the six evaluaevalua-tion items for the af-fect of service criterion.
2.3 LibQual Questionnaire Data Processing
LibQual questionnaire data processing consists of:
1. LibQual GDSS-AHP computation with discretization. This computation aims to determine the conclusions of the quality level of library services. The procedure for this computation refers to both Li and Yang [4] and Do et al. [5], where they used linguistic scales on their questionnaire answer choices. This study uses an assessment scale of 1 to 9 on the question-naire answer choices. Therefore, to produce conclusions in linguistic form, a value conver-sion is used to discretize the respondents’ response to form a linguistic label. The discretiza-tion of the responses is carried out as follows:
{
{ }
{ } { }
{ }
{ }
(9)
where responsei,j is the choice of answer given by the i-th respondent on the j-th item state-ment of the evaluation instrustate-ment.
LibQual GDSS-AHP calculation steps with discretization after weighing the criteria and subcriteria are as follows:
a. Calculating the percentage of each discretized label for each subcriterion (LibQual state-ment item). For example, for the first statestate-ment we may obtain that 0% of respondents answered Very Dissatisfied (STP), 3% answered Not Satisfied (TP), 1% answered Quite Satisfied (CP), 15% answered Satisfied (P), and 82% answered Very Satisfied (SP). b. Compiling RC1 (affect of service) matrix with dimension 6x5, RC2 matrix (information
control) with dimension 10x5, and RC3 (library as place) matrix with dimension 6x5. The elements of matrices RC1, RC2, and RC3 are derived from the number of subcriteria in
RC1, RC2, and RC3 and the percentage of the discretized label obtained from the previous step.
f. Based on the principle of maximum membership degree, the final conclusions of services quality evaluation are selected based on the largest percentage value of the discretized la-bel from matrix B. Matrix B (of dimension 1x5) represents the total value of the tized label of the library services quality. As described in Equation (9), there are 5 discre-tized labels: Very Dissatisfied (STP), Not Satisfied (TP), Quite Satisfied (CP), Satisfied (P), and Very Satisfied (SP).
2. Calculation of weighted LibQual perception. This calculation aims to determine the value of each statement item of the evaluation instrument of the library services quality based on
re-spondents’ perception. LibQual weighted calculation steps are as follows:
a. Finding the average perception value of each statement item (each subcriterion), as de-fined by:
̅̅̅̅̅ ∑ (14)
where ̅̅̅̅̅ is the mean perception value of the j-th subcriterion, is the perception value of the i-th respondent on the j-th subcriterion, and N is the number of respondents. b. Calculating the weighted perception value of each statement item by multiplying the
mean perception value of each statement item and the weight produced by GDSS-AHP, as defined by:
̅̅̅̅̅ (15)
where is the weighted perception value of the j-th subcriterion, and is the GDSS-AHP weight of the j-th subcriterion.
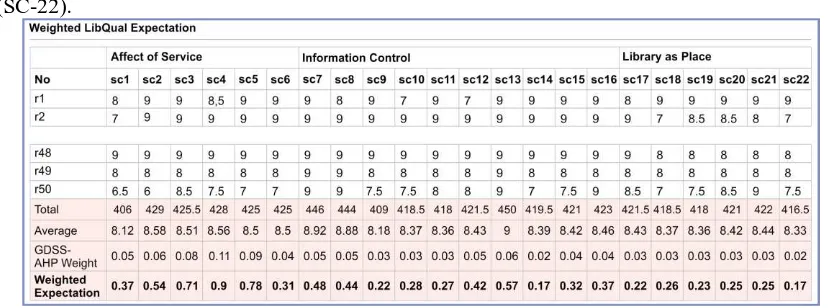
3. Calculation of weighted LibQual expectation. This calculation aims to determine the value of each statement item of the evaluation instrument of the library services quality based on
a. Finding the average expectation value of each statement item (each subcriterion), as de-fined by:
̅̅̅̅̅ ∑ (16)
Where ̅̅̅̅̅ is the mean expectation value of the j-th subcriterion, is the expecta-tion value of the i-th respondent on the j-th subcriterion, and N is the number of respond-ents.
b. Calculating the weighted expectation value of each item statement by multiplying the av-erage expectation value of each statement and the weight produced by GDSS-AHP, as de-fined by:
̅̅̅̅̅ (17)
where is the weighted expectation value of the j-th subcriterion, and is the GDSS-AHP weight of the j-th subcriterion.
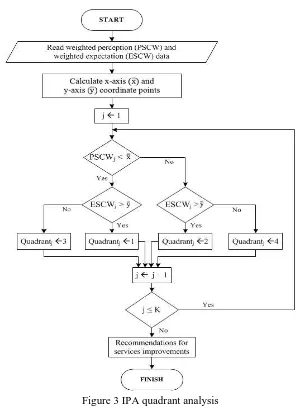
4. IPA quadrant analysis. After knowing the quality level of library services from each evalua-tion statement according to percepevalua-tion and expectaevalua-tion of respondents, then Importance-Performance Analysis is used to map each evaluation statement into the four IPA quadrants aiming to know weakness and strength of each evaluation statement. The flow diagram of the IPA quadrant analysis is depicted in Figure 3.
To map each evaluation statement, it is necessary to find the values of x-axis point (perfor-mance or perception) and y-axis (importance or expectation), as follows:
̿ ∑ , (18)
̿ ∑ , (19)
where ̿ ̿ are x-axis and y-axis points, respectively and K is the number of subcriteria or statement items.
3. RESULTS AND DISCUSSION
In this research, the data comes from 50 respondents, who are users of the library of the Ministry of Trade. The weight calculation involves four decision makers. The result of the ser-vices evaluation for the library is presented in this section.
3.1 Weighting Using GDSS-AHP
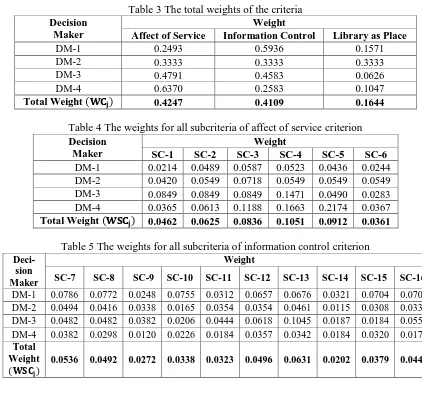
The result of the overall weighting of the criteria is presented in Table 3. The weights for all subcriteria of affect of service, information control, and library as place criteria are shown in Tables 4, 5, and 6, respectively.
Table 3 The total weights of the criteria Decision
Maker
Weight
Affect of Service Information Control Library as Place
DM-1 0.2493 0.5936 0.1571
DM-2 0.3333 0.3333 0.3333
DM-3 0.4791 0.4583 0.0626
DM-4 0.6370 0.2583 0.1047
Total Weight 0.4247 0.4109 0.1644
Table 4 The weights for all subcriteria of affect of service criterion Decision
Deci-Table 6 The weight for all subcriteria of library as place criterion against the three criteria. DM-1, representing the library being studied, gives more attention to the information control criterion. DM-2, representing academics in the library field, considers that the three criteria have similar values. DM-3 and DM-4, representing library practitioners, on the other hand, tends to pay more attention to affect of service criterion. The result of this weighting indicates that there is a difference among the decision makers in giving preference values against the criteria, and this difference arises more from the background of the decision makers.
3.2 LibQual GDSS-AHP with Discretization
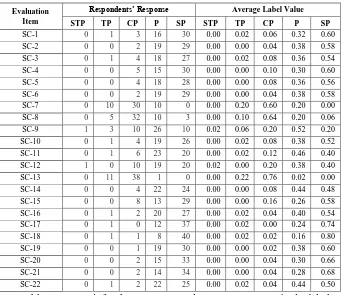
The responses of the respondents are discretized according to Equation (9). The average for each label value of each evaluation item is shown in Table 7. The RC1 (affect of service) matrix with dimension 6x5 is represented by the elements of Table 7 rows 1 to 6 in columns 7 to 11 (columns “Average Label Value”). The RC2 (information control) matrix with dimension 10x5 is represented by the elements of Table 7 rows 7 to 16 in columns 7 to 11. The RC3 (li-brary as place) matrix with dimension 6x5 is represented by the elements of Table 7 rows 17 until 22 in columns 7 to 11.
Table 7 The average discretization label values
Evaluation
very dissatisfied. This is directly reflected in the result of GDSS-AHP LibQual calculation with discretization. The result shows that the largest percentage is very satisfied; followed by satis-fied, quite satissatis-fied, dissatisfied and very dissatissatis-fied, as shown in Figure 4.
Figure 4 Calculation of LibQual GDSS-AHP discretization
3.3 Weighted LibQual Perception
The calculation of weighted LibQual perception uses the respondents’ perception data. The data uses score 1 until 9. Figure 5 shows that the evaluation survey item with the greatest value is related to the ability of librarian (SC-4) and the lowest is related to the collection placement (SC-14).
Figure 5 Calculation of weighted LibQual perception
3.4 Weighted LibQual Expectation.
The calculation of weighted LibQual expectation uses the respondents’ expectation d a-ta. Similar to the perception data, the expectation data also uses score 1 until 9. Figure 6 shows that the evaluation survey item with the greatest value is related to the ability of the librarian (SC-4) and the lowest is related to the collection placement (SC-14) and the locker facilities (SC-22).
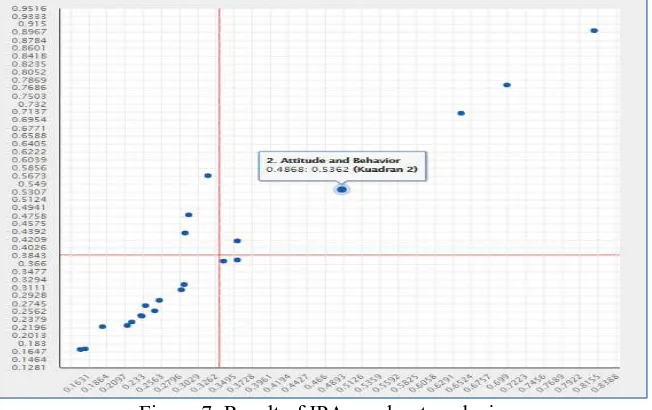
3.5 IPA Quadrant Analysis
In this analysis, the weighted LibQual perception and expectation are used to obtain a set of recommendations to improve the library services quality. The result of IPA quadrant analysis is depicted in Figure 7. The x-axis represents the weighted LibQual perception and the
y-axis represents the weighted LibQual expectation. Based on Figure 7, the recommendations for improving the library services quality are as follows: to give special attention (priority) to quadrant 1 (survey items 7, 8, and 13), to maintain performance in quadrant 2 (survey items 2, 3, 4, 5, and 12), to give low priority in quadrant 3 (survey items 6, 9, 10, 11, 14, 15, 17, 18, 19, 20, 21, and 22), and to reduce (ignore) performance in quadrant 4 (survey items 1 and 16).
Figure 7. Result of IPA quadrant analysis
3.6 Usability of the System
An application can be considered usable if its functions can be executed effectively, ef-ficiently, and satisfactorily. The next activity is to conduct a usability testing on the developed system. We have used a standard measurement to calculate the usability level of an application or software in software engineering, namely Questionnaire for User Interface Satisfaction (QUIS) [11], which consists of 27 questions. The tests are conducted on three type of users (re-spondents) of the system, namely five users, one administrator, and two decision makers, by distributing questionnaires based on three types of observation elements: effectiveness, efficien-cy and satisfaction. The average usability level of the system is 90.03%. And the result of test-ing for the overall system usability test is depicted in Figure 8.
Figure 8 Usability of the system
4. CONCLUSION
The method we have proposed in this paper to evaluate library services quality using LibQual, GDSS-AHP, and IPA has been shown to be effective in evaluating the performance of a library. This method can be developed further to become an evaluation tool to determine the level of a library services quality and even to obtain a set of recommendations to improve the
services quality. Since both elements of stakeholders, i.e., decision makers as person in charge giving weights toward criteria and subcriteria and users as a research respondent, are taken into consideration, the result is relatively trustworthy. Users have also found the method to be
satis-factory and useful, which is indicated by the result of system’s usability testing with average
value of 90.03%. For the particular library we conducted our research on, we obtained that
us-ers’ satisfaction level is at least satisfied by 76.49%. For future work, it is interesting to find out more about other possible methods for library services evaluation, for instance methods that are based on Quality Function Deployment (QFD).
REFERENCES
[1] J. C. Fagan, “The dimensions of library service quality: A confirmatory factor analysis of
the LibQUAL+ instrument,” Libr. Inf. Sci. Res., vol. 36, no. 1, pp. 36–48, 2014 [Online]. Available: http://dx.doi.org/10.1016/j.lisr.2013.10.003
[2] V. Kieftenbeld and P. Natesan, “Examining the measurement and structural invariance of
LibQUAL+® across user groups,” Libr. Inf. Sci. Res., vol. 35, no. 2, pp. 143–150, 2013 [Online]. Available: http://dx.doi.org/10.1016/j.lisr.2012.11.003
[3] J. A. Martilla and J. C. James, “Importance-Performance Analysis,” Journal of Marketing, vol. 41, no. 1, pp. 77–79, 1977.
[4] X. Li and J. Yang, “Application of LibQual and FAHP on Public Library Service Quality Evaluation,” The 19th International Conference on Industrial Engineering and
Engineering Management, pp. 853–862, 2013 [Online]. Available:
http://link.springer.com/10.1007/978-3-642-38442-4
[5] Q. H. Do, J. Chen, and H. Hsieh, “Trapezoidal Fuzzy AHP and Fuzzy Comprehensive
Evaluation Approaches for Evaluating Academic Library Service,” WSEAS Transactions on Computers, vol. 14, pp. 607-619, 2015.
[6] D. N. Ilham and S. Mulyana, “Sistem Pendukung Keputusan Kelompok Pemilihan
Tempat PKL mahasiswa dengan Menggunakan Metode AHP dan Borda,” IJCCS (Indonesian J. Comput. Cybern. Syst., vol. 11, no. 1, p. 55-66, 2017 [Online]. Available: https://journal.ugm.ac.id/ijccs/article/view/16595
[7] M. A. B. Saputra and R. Wardoyo, “Group Decision Support System Determination Of
Best Employee Using Topsis And Borda,” IJCCS (Indonesian J. Comput. Cybern. Syst., vol. 11, no. 2, pp. 165-176, 2017 [Online]. Available: https://jurnal.ugm.ac.id/ijccs/article /view/ 22773
[8] U. Wahyudin, “Importance-Performance Analysis Layanan Perpustakaan UPI untuk
Optimalisasi Peningkatan Mutu Akademik Dan Penelitian,” Edutech, Tahun 14, vol. 1, no. 2, pp. 241–272, 2015 [Online]. Available: https://www.researchgate.net/publication/ 313831866_ImportancePerformance_Analysis_Of_Indonesia_University_Of_Education_ Upi_Library_Services_To_Optimize_Academic_And_Research_Quality_Improvement [9] Y. Chun, H. Yan-yan, and W. Zhi-quan, “Topsis-AHP-Simulation Method and Its
Application in Operational Capability Evaluation,” Chinese Control and Decision Conference, pp. 2954–2957, 2009.
[10] G. Abdollahzadeh, C. A. Damalas, M. S. Sharifzadeh, and H. Ahmadi-Gorgi, “Selecting strategies for rice stem borer management using the Analytic Hierarchy Process (AHP),”
Crop Prot., vol. 84, pp. 27–36, 2016 [Online]. Available: http://dx.doi.org/10.1016/ j.cropro.2016.02.004
[11] J. Sauro and J. R. Lewis, Chapter 8: Standardized Usability Questionnaires, In