Address of Publisher & Editor's Office: GDAŃSK UNIVERSITY
OF TECHNOLOGY Faculty of Ocean Engineering
& Ship Technology ul. Narutowicza 11/12 80-233 Gdańsk, POLAND
tel.: +48 58 347 13 66 fax: +48 58 341 13 66 e-mail: [email protected]
Account number: BANK ZACHODNI WBK S.A.
I Oddział w Gdańsku 41 1090 1098 0000 0000 0901 5569
Editorial Staff: Tadeusz Borzęcki Editor in Chief
e-mail: [email protected]
Przemysław Wierzchowski Scientific Editor e-mail: [email protected] Jan Michalski Editor for review matters
e-mail: [email protected]
Aleksander Kniat Editor for international re la tions e-mail: [email protected]
Kazimierz Kempa Technical Editor e-mail: [email protected] Piotr Bzura Managing Editor
e-mail: [email protected] Cezary Spigarski Computer Design
e-mail: [email protected] Domestic price: single issue: 25 zł Prices for abroad:
single issue: - in Europe EURO 15
- overseas USD 20
ISSN 1233-2585
POLISH
MARITIME
RESEARCH
in internet
www.bg.pg.gda.pl/pmr/pmr.php
PUBLISHER:
5 DUNG-YING LIN, CHIEN-CHIH HUANG
Coopetition in international maritime shipping
13 Y.H. VENUS LUN
Development of green shipping network to enhance environmental and economic performance
20 JOYCE M.W LOW, SHAO WEI LAM, LOON CHING TANG, ZHANG LAN
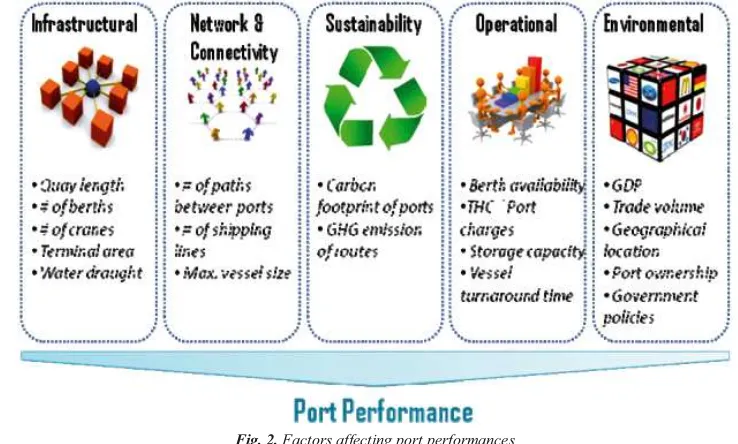
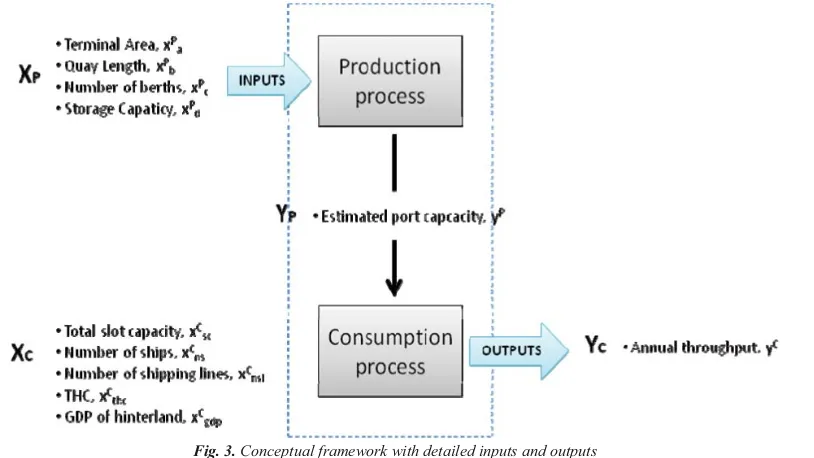
Evaluations of port performances from a seaborne cargo supply chain perspective
32 ZHONG-ZHEN YANG, GANG CHEN, DONG-PING SONG
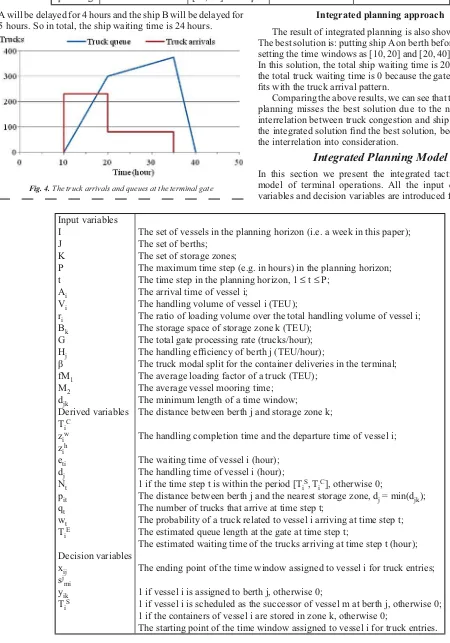
Integrating truck arrival management into tactical operation planning at container terminals
47 JASMINE SIU LEE LAM, DONG-WOOK SONG
Seaport network performance measurement in the context of global freight supply chains
55 LIN FENG, THEO NOTTEBOOM
Peripheral challenge by Small and Medium Sized Ports (SMPs) in Multi-Port Gateway Regions: the case study of northeast of China
67 NATHAN HUYNH, FATEME FOTUHI
A new planning model to support logistics service providers in selecting mode, route, and terminal location
CONTENTS
POLISH MARITIME RE SE ARCH
POLISH MARITIME RESEARCH is a scientific journal of worldwide circulation. The journal ap pe ars as a quarterly four times a year. The first issue of it was published in September 1994. Its main aim is to
present original, innovative scientific ideas and Research & Development achie ve ments in the field of:
Engineering, Computing & Technology, Mechanical Engineering,
which could find applications in the broad domain of maritime economy. Hence there are published papers which concern methods of the designing, manufacturing and operating processes of such technical objects and devices as: ships, port equ ip ment, ocean engineering units, underwater vehicles and equipment as well
as harbour facilities, with accounting for marine environment protection.
The Editors of POLISH MARITIME RESEARCH make also efforts to present problems dealing with edu ca tion of engineers and scientific and teaching personnel. As a rule, the basic papers are sup ple men ted by information on conferences , important scientific events as well as co ope ra tion in carrying out in ter
na-tio nal scientific research projects.
Editorial
Scientific Board
Chairman: Prof. JERZY GIRTLER - Gdańsk University of Technology, Poland
Vice-chairman: Prof. ANTONI JANKOWSKI - Institute of Aeronautics, Poland
Vice-chairman: Prof. MIROSŁAW L. WYSZYŃSKI - University of Birmingham, United Kingdom
Dr POUL ANDERSEN
Süleyman De mi rel University Turkey of Science and Technology
Norway
Institute of Fluid-Flow Machinery of PASci
Gdynia Ma ri ti me University Poland
University of Ap plied Sciences Germany
Prof. TADEUSZ SZELANGIEWICZ
Polish Maritime Research Special Issue
on Maritime Freight Transport
A nation’s economy relies on its system of highways, ports, railroads, and waterways to swiftly and safely
move raw materials, labour, manufactured products, and component parts. This exchange of goods and
services underpins almost all economic activities. The unrelenting demand for faster, cheaper and better
transportation options brought about by population growth, urbanization and globalization, has strained
the global supply chains and the underlying support infrastructure. Bottlenecks at ports, congestion on
highways leading to and from ports, inefficient logistic systems, and high transportation costs can strangle
economic growth and, if left unchecked, place the nation at a global economic disadvantage.
Ports are absolutely critical assets to a nation’s economy, infrastructure, and quality of life. They are a
part of the transportation system that serves as the circulatory system of civilization. Specifically, they
provide the vital link for transporting export goods produced at factories and farms to consumers overseas
and getting imports of goods to domestic consumers. Today, international trade accounts for a significant
portion of most countries’ Gross Domestic Products, and container vessels move the majority of the trade
by volume and value through ports. Ports are also important in that they generate jobs and contribute to
the local economy. The impacts of ports go far beyond the communities in which seaports are located. In
the U.S., on average, any given state uses the services of 15 different ports around the country to handle
its imports and exports.
For the above reasons, there is a need to improve maritime and port operations and logistics to increase
operational efficiency while reducing environmental impact, improve end-to-end experience for shippers
and other stakeholders such as ocean carriers and truckers, and improve security. By addressing this vital
and weak link in the freight supply chain, it would allow the supply chain to operate more efficiently.
The main objective of this special issue is to provide an update on the recent research and development in
maritime freight transport. Seven papers have been selected for publication after a thorough peer-review
process, according to the standards of the Polish Maritime Research. The papers were selected based on
their technical merit as well as their relevance to maritime freight transport. The topics covered by the
papers can be categorized as maritime logistics, port operations, and intermodal logistics. An overview of
how the papers are advancing maritime freight transport research is provided below.
The increasingly competitive nature of maritime freight transport has stimulated ocean carriers to
improve efficiency and lower costs. The larger a carrier the more competitive advantage it has. Therefore,
carriers have to form alliances with other carriers so that they can reduce their operational costs due to
economy of scale. Such alliances pose a significant business challenge to the carriers. On the one hand,
their partnerships with other carriers allow them to improve quality of their service by increasing their
network coverage. On the other hand, they have to compete against their partners for businesses. How to
form strategic alliances is the research issue addressed by Lin and Huang. In their study, they proposed a
theoretical framework for characterizing competition in international maritime shipping and investigated
how carriers can manage their business models.
In another paper dealing with maritime logistics, Lun addressed the issue of container vessels making
frequent calls to ports in the Pearl River Delta region in China. In her study, she suggested using a green
shipping network to trans-ship containers from feeder ports to hub ports to lower the overall carbon dioxide
emissions in the region. She investigated how the use of the hub-and-spoke approach and the deployment
of mega-ships can be beneficial to port users, both economically and environmentally.
alleviate the gate congestion at container terminals. The authors proposed an integrated planning model
and a sequential planning model to coordinate the major terminal planning activities, including berth
allocation, yard storage space allocation and truck arrivals. Their work provides important insights on the
model development and implementation of port integrated models, which to date has not been accomplished
due to modelling complexity and computational constraints.
The last three papers address intermodal logistics in which ports play a critical role. The study by Lam and
Song assessed a port’s role within the supply chain and its performance from the perspective of shippers and
logistics’ providers. Their study developed a unified framework for analyzing how well a port is integrated
within the global freight supply chains including shipping line networks, hinterland and intermodal transport
network, and even urban network. This framework is aimed at supporting a wider group of stakeholders,
including terminal operators, port authorities, shippers, shipping companies, inland transport providers,
freight forwarders, logistics service providers, and transportation agencies.
Feng and Notteboom studied the role of small and medium-size ports (SMPs) in enhancing the competitiveness
and logistics performance of multi-port gateway regions and associated inland logistics systems. They
analyzed the role of a SMP in a region using different variables: (a) cargo volume and market share; (b)
international connectivity; (c) relative cluster position; (d) port city and hinterland connection; and (e)
logistics and distribution function. The five-dimension analysis combined with an in-depth case study
provides important information about SMPs.
In the third and final paper on intermodal logistics, Fotuhi and Huynh addressed the freight network design
problem. This study takes the perspective of logistics service providers whose task is to serve a multiregional
customer base. Of particular interest to these decision makers is the management of shipments between
origins and destination through the use of different modes, routes, as well as logistic hubs. At a strategic
planning level, the service providers need to develop long-term policies on terminal locations, modes, and
routes to lower costs. To this end, the authors proposed a mixed integer linear program to help logistics
service providers to jointly select the best location of terminals among a set of candidate places, shipping
modes, and route for shipping commodities of different types.
As discussed, the papers published in this special issue represent a collection of inter-related and up-to-date
topics on maritime freight transport. We hope that the special issue provides valuable research references
and suggests directions for new research in this area.
Acknowledgments
We would like to thank the authors and referees of the papers for their outstanding contributions.
Guest Editors
:
S. S. Ganji
Department of Transportation Engineering
Islamic Azad University of Tehran, Tehran, IRAN
e-mail: [email protected]
Nathan Huynh
University of South Carolina
Dept. of Civil and Environmental Engineering
300 Main StreetColumbia, SC 29208
e-mail: [email protected]
Mohammad Najafi
Department of Civil Engineering,
The University of Texas at Arlington, Arlington, U.S.A.
e-mail: [email protected]
Editor-in-Chief
:
Tadeusz Borzecki
Polish Maritime Research
1. INTRODUCTION
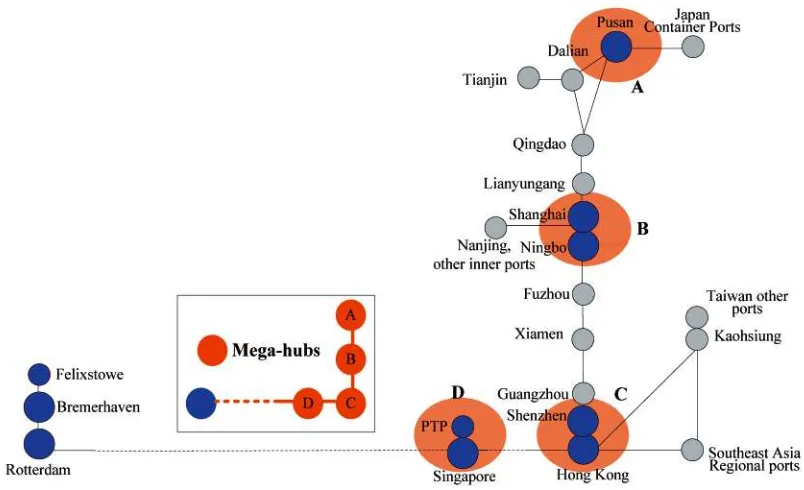
In recent years, fundamental changes have taken place in the operational models of international maritime shipping. Traditionally, carriers assign ships of various sizes to pick up containers along the countries of the Pacific Rim. For instance, as Figure 1 illustrates, a ship of 10,000 TEU or over may depart from Japan and pick up loads from Korea, China, Hong Kong and Singapore and then depart Asia for ports in Europe (e.g., Rotterdam). However, the more ports at which a ship stops, the more delay it may potentially incur. Specifically, the ship has to wait during the berthing, loading and unloading processes. The time required for each of these can vary significantly, depending on the efficiency of the stopping ports. As a result, the number of ports at which a ship stops is directly related to the reliability of the shipping time to which the carrier can commit. To improve the reliability of the service provided, carriers have proposed an alternative operational model of daily frequency. The carrier conceptually considers certain ports in the current network associated with high customer demand as mega-hubs (e.g., Pusan, Shanghai, Hong Kong and Singapore) and dispatches its largest ships to pick up and deliver shipments at those ports. Shipments from smaller ports, such as Tianjin, are carried by feeder ships to the mega-hubs.
The new operational model is very similar to hub-and-spoke operation in air transportation and has provided several advantages for maritime freight carriers. First, because the carriers use large ships to service selected major ports, these
large ships (e.g., ships over 10,000 TEU) do not need to operate at full speed between mega-hubs because a large ship can cover a given distance more quickly than a small ship can. Therefore, a large ship can increase its speed when the pre-specified schedule is delayed and improve the reliability of the schedule. This gives the carrier the operational flexibility to improve its service quality. Second, if the number of ships is abundant, carriers can provide pickup and delivery services at the mega-hubs on a daily basis. Presuming that it requires 40 days to travel from the Asian ports to Europe, carriers can provide daily service as long as they have 40 large ships. Thus, a high service frequency greatly improves a carrier’s competitive advantage. Third, carriers can achieve economies of scale at the mega-hubs, in the same way that economies of scale are achieved at hubs in a hub-and-spoke air transport network. Lastly, this new business model has implications for energy consumption and environmental impact because the large ships in the network can operate at slower speeds, thereby consuming less energy and generating less pollution.
In a winner-take-all market, carriers need to develop new strategies in response to this new operational model so that they can survive in the market. With this in mind, carriers have proposed collaboration so that the number of ships and the service network can be expanded. As they adopt the collaboration strategy, they compete with each other at the same time because carriers have to defend their own profits. In such a scenario, a game of coopetition develops. In this study, we investigate the coopetition game and analyze its
Coopetition in international
maritime shipping
Dung-Ying Lin, Ph.D., Associate Professor Chien-Chih Huang, B. Sc.
National Cheng Kung University, Taiwan
ABSTRACT
The increasingly competitive nature of maritime freight transport has stimulated carriers to improve efficiency and lower costs. The industry has gradually matured, and it has recently become the case that the larger a carrier is, the more competitive advantage it has. Therefore, carriers form strategic alliances to collaborate with each other so that they can reduce their operational costs due to economies of scale. At the same time, such alliances allow carriers to improve the quality of their service by increasing their network coverage. Although carriers collaborate to improve their operational efficiency, they compete with each other simultaneously. In other words, a game of coopetition among carriers has developed in international maritime freight transport in recent years. In this study, we propose a theoretical framework for characterizing coopetition in international maritime shipping and investigating how carriers can manage their business models. Empirical studies, together with salient analytical results, are presented
and discussed.
Keywords: Coopetition; Maritime freight; International shipping; Jacobi approach; Backward induction
POLISH MARITIME RESEARCH Special Issue 2013 S1 (79) 2013 Vol 20; pp. 5-12 10.2478/pomr-2013-0022
mathematical properties. Because the game of coopetition is rarely discussed in the literature, we develop its equilibrium condition and solution approach to gain insight into empirical studies of this phenomenon.
The remainder of the paper is structured as follows. Section 2 provides a critical overview of the recent developments in the field of coopetition and maritime freight shipping and related fields of research. Section 3 presents a mathematical model of the coopetition framework. Section 4 presents a proposed solution procedure, a diagonalization algorithm, for finding the solution of the mathematical model described in Section 3. In Section 5, the proposed method is applied empirically to networks with various sets of parameters to demonstrate their efficacy. The final section concludes the paper and suggests potential directions for future research.
2. LITERATURE REVIEW
To survive in the challenging and increasingly competitive maritime freight transportation industry, carriers strive to improve their efficiency and lower their costs. To accomplish these goals, carriers need to consider alternative business models such as competition, cooperation and coexistence/coopetition (Bengtsson and Kock, 1999). A considerable amount of research exists in the field of freight cooperation. For instance, Özener and Ergun (2008) studied cost allocation in shipper alliances. Based on previous work on the lane covering problem, Ergun et al. (2007) developed optimization techniques for identifying collaborative shippers’ tours to reduce the probability of empty truck repositions. Such carrier collaboration techniques have been applied in areas such as air and sea cargo [e.g., Agarwal et al. (2010), Agarwal and Ergun, (2008) and Houghtalen et al. (2010)]. The aforementioned cooperation research assumed that collaborators work together to find the optimal solution for the collaborative system. Therefore, conventional optimization techniques (rather than a game-theoretic framework) can be applied.
An alternative line of research has applied the game-theoretic framework to analyzing cooperation and competition strategies. We can further classify the related research into cooperative or non-cooperative game theory research. An extensive review of cooperative game-theoretic models
can be found in Nagarajan and Sosic (2008). Sutton (1986) provided a critical review of non-cooperative game models. An updated overview of non-cooperative game models can be found in Cachon and Netessine (2004). From the literature summarized above, it is apparent that only a limited body of research has been devoted to the game of players cooperating and competing simultaneously, especially in the field of maritime freight transportation. In international air services, airlines have widely adopted the practice of code-sharing that designates its code on aircraft operated by other airlines (Humphreys, 1994). Code-sharing among airlines can supplement their own flight frequencies or establish a new market presence. However, the practice can lower the cost to other airlines and make them more competitive in the industry, which can similarly form a game of coopetition. Further, most of the research in this area focuses on the design of the code-sharing system rather than analyzing the problem from a coopetition game perspective. Luo (2007) explained why coopetition occurs, developed an overall framework to analyze coopetition and presented a typology for understanding the intensity and diversity of coopetition with major global rivals. However, this research is more a conceptual effort than a mathematical or theoretical analysis of coopetition. To the best of our knowledge, the work by Ngo and Okura (2008) is the first of the very few research efforts that have been devoted explicitly to the mathematics of the coopetition game. However, their models, which focused on the coopetition game between a semipublic firm and a private firm in a duopoly market, cannot be applied in the analysis of the coopetition games between private freight carriers in maritime transportation. Therefore, in this research, we develop the theoretical background of the coopetition game in a duopoly market so that the competition and cooperation between maritime freight carriers can be captured with greater fidelity. We next present the mathematical model.
3. COOPETITION MODEL
In this section, we present the mathematical model for the coopetition game. Before presenting the mathematical derivation, we first state the following assumptions on which the model is based:
Fig. 1. The new operational model in maritime international shipping (Tai and Lin, 2012)
1. The game of two carriers. For simplicity, we consider
a game structure with two freight carriers in an oligopoly market. The assumption is not meant to be restrictive but to facilitate explanation of the derivation process. One can easily expand the derivation and algorithm to more than two players in the game.
2. Carriers are equally competitive. We assume that there is
no leader or follower in this game. Two separate carriers in a duopoly freight transport market offer partially substitutive freight service.
3. An extensive-form game. An extensive-form game is
a specification of a game in game theory that allows explicit representation of a number of important aspects, such as the sequencing of players’ possible moves, their choices at every decision point, the information each player has about the other player’s moves when she/he makes a decision, and the payoffs for all possible game outcomes.
4. A two-stage game. We consider a typical sequential game with two stages. In the first stage, freight carriers cooperate to decrease the average cost and increase the total market profit. In the second stage, carriers simultaneously choose their competitive effort level to increase the carrier’s own market share. This is the common setup for analyzing this stream of problems.
5. Perfect information. Two carriers are assumed to have
perfect information in cooperate investment and price competition strategies of the market.
6. Static game. We do not consider the dynamic features of this game and assume that carriers’ decisions do not vary over time.
We next introduce the notations that will be used throughout the rest of the paper.
Notations
y1 – The cooperative effort level of each carrier i, i ∈
{1,2} that decreases the average cost and increases the total market size.
xi – The competitive level of each carrier i, i ∈ {1,2}
that can enhance a carrier’s own market share si – The market share of carrier i, i ∈ {1,2}. The value
of si is determined by each carrier’s competitive level. For instance, si = xi/xi + xj if i and j represent the two carriers in the market.
c(y1, y2) – The average cost for each carrier, which is a function of y1 and y2.
q(y1, y2) – The total market demand, which is a function of y1 and y2.
p(q) – The equilibrium market price, which is a function of market demand.
D – The initial demand before the game.
kx – The unit cost of increasing one unit of competitive level.
ky – The unit cost of increasing one unit of cooperative level.
kx,xi – The cost of expanding competitive efforts for each carrier i, i ∈ {1,2}
ky,yi2 – The cost of cooperative efforts for each carrier i, i ∈
{1,2}. Note that yi2 is a mathematical construct that
makes the derivation easier when calculating yi* at
a later stage. One can alter this functional form and obtain similar results rather straightforwardly.
Backward induction
To derive the equilibrium condition of this coopetition game, we use the method of backward induction (McCain,
2010). The concept of backward induction is based on the game-theoretic principle of “think forward and reason backward,” which is similar to the techniques used in solving a dynamic programming problem. The primary difference is that there typically exists only one decision maker in a dynamic program problem, while there are generally two or more players interacting in the context of a game. Essentially, the backward induction reasons backwards in time from the end of a game to determine a sequence of optimal decisions along the sequential process. It proceeds by first considering the last time a decision can be made and then choosing what to do in any situation at that time. Based on the results, game players can then determine what to do at the previous step at the time to make a decision. This process continues backwards until the best action for every possible scenario at every decision point in time has been determined. We next apply the backward induction technique in deriving the equilibrium condition.
Derivation of Equilibrium Condition
We first assume that the total demand of two freight carriers depends on the level of cooperation in the two-stage game. In this static game, both carriers choose their cooperative effort levels to increase total market size in the first stage. In the second stage, carriers choose their competitive levels to increase their corresponding market shares. Therefore, the overall market demand function can be expressed as follows:
q(y
1, y
2) =
D
+ y
1
+ y
2 (1)The form of this demand function is based on the work by Ngo and Okura (2008) and can be modified to suit various situations. For readability, we replaced q(y1, y2), c(y1, y2) and p with Q, C and P so that the derivation process is clearer. The utility/profit functions of carrier 1 and 2 are:
π
1= (P – C)Qs
1– k
xx
1– k
yy
12 (2)π
2= (P – C)Qs
2– k
xx
2– k
yy
22 (3)Again, the functional forms are based on Ngo and Okura (2008) and can be modified if necessary. To make the model reasonable, without loss of generality, we impose the following constraints:
P ≥ C ≥ 0
x
1≥ 0, x
2≥ 0
y
1≥ 0, y
2≥ 0
P ≥ C ≥ 0 implies that the price of the service is higher than its cost and should naturally have a positive value. Similarly, the competition levels x1 and x2 and the cooperation levels y1 and y2 should be greater than zero. As mentioned earlier, to derive the solution of this extensive-form game, we solve the game by backward induction. That is, the equilibrium in the second stage is derived on the basis of the first stage before the first stage has been played. Having derived the equilibrium condition in the second stage, the equilibrium condition in the first stage is derived using the results from the second stage. The second stage of the game is described below. The first-order conditions with respect to xi required to obtain the corresponding maximum utilities are:
(4)
(5)
The cost of expanding the competitive effort for each carrier therefore are:
(6) We can conclude that the equilibrium competitive effort levels are:
(7) Because an increase in kx decreases x1* and x
2*, the intuitive
interpretation is that the higher the cost level, the lower the competitive effort. Next, we consider the relationship between competitive and cooperative effort levels. From equation (7) the following derivatives can be calculated:
(8)
(9)
When , the competitive level decreases when the cooperative level increases. We can conclude that xi and yi are substitutes.
On the other hand, when , the competitive level increases when the cooperative level increases. Thus, we can observe that xi and yi are complements.
We next use backward induction to analyze the first stage of the game from the results of second stage. Plugging x1* and
x2* into the carriers’ utility functions leads to:
(10)
(11) Applying the condition that ∂πi/∂yi = 0, ∀i ∈ {1,2}, the
equilibrium cooperative effort levels are:
(12) To summarize the results and replace the notations with the original meanings, we list the following equilibrium condition for this coopetition game:
(13)
(14)
From equations (13) and (14) we can observe that the equilibrium cooperative and competitive levels are identical for both carriers, which suggests that carriers will adopt the same strategies in this coopetition game when reaching equilibrium and the result profits would be identical as well. Therefore, we only present the cooperation, competition and profit levels of a carrier in the section of numerical studies. Next, we present a theorem stating that there exists a unique solution to this coopetition game.
Theorem 1
There exists a unique solution to the game-theoretic model of the coopetition.
Proof. See the Appendix I.■
As mentioned earlier, we consider a game structure with two freight carriers in an oligopoly market to facilitate explanation of the derivation process. However, the assumption is not meant to be restrictive. The extension of the derivation to three carriers is presented in Appendix II. For the cases with more than three carriers, the derivation can be expanded in the same manner.
4. SOLUTION APPROACH:
DIAGONALIZATION (JACOBI)
ALGORITHM
The iterative diagonalization algorithm by Lin and Hsieh (2012) can be applied to evaluate the model empirically. The fundamental objective of this algorithm is to determine the optimal collaboration and competition efforts of one carrier while assuming that the efforts of other carriers are known and fixed. Given the optimal values for the current carrier, one can then calculate the optimal efforts of the other carriers for the same set of conditions (the values for other carriers are fixed and known). The process repeats iteratively until a pre-specified criterion is satisfied and converges to an equilibrium solution. The typical convergence criterion is that the difference of two consecutive solutions be within a tolerant value. The algorithmic steps can be described as follows:
Step 0: Initialization
We initialize the following parameters required for the algorithms, including the iteration number n, the cost of cooperation ky, the cost of competition kx and the initial demand before the game starts D. Furthermore, we assume that the
carriers in this game do not cooperate before the game. In other words, the cooperation level yin = 0, ∀i ∈ I.
Step 1: Diagonalization
At iteration n, we solve the equilibrium coopetition level, equations (13) and (14) for carrier i ∈ I, by assuming the
competition and cooperation levels for other carriers j ∈ I\i are
given and unchanged from the previous iteration n – 1. This is equivalent to solving the equilibrium problem (equations (13) and (14)) with the diagonal elements of a Jacobian matrix of coopetition levels, which determines the competition and cooperation levels of carrier i ∈ I.
Step 2: Convergence Test
If the cooperation level of a firm yin between two
consecutive iterations is less than a pre-specified level (yin
– yin-1)/y
in ≤ 5%, report the incumbent solution. Otherwise,
n = n + 1; go back to Step 1.
Note that when cooperation level yin reaches an equilibrium
condition, xi stops changing as well. Thus, yin can be used as
the convergence criterion. We next show the convergence of the diagonalization algorithm.
Theorem 2
The diagonalization algorithm converges to a unique solution of this coopetition game.
Proof. Because the profit function of each carrier is concave
(shown in Theorem 1), the gradient (marginal profit function)
is monotonic. For a problem with such an objective function, Dafermos (1983) established that the diagonalization algorithm converges to a unique solution.■
In addition to the convergence behavior established by Dafermos (1983), the convergence of the diagonalization
algorithm can be interpreted in a more intuitive manner. Let us use the competitive level xi as an example. As the diagonalization algorithm solve the coopetition game iteratively, the competitive level in iteration n + 2(xin+2) can
only be lower than the competitive level in iteration n(xin). Note
that xin+2 essentially uses the competitive level x
in as the initial
level and the value of xin+2 involves one step of cooperative
effort based on xin.Therefore, x
in+2 is always smaller than xin
because the competition level can only be smaller if one step of cooperation is involved. Therefore the convergence of the diagonalization can be expected.
5. NUMERICAL EXPERIMENTS
For the numerical studies, we assume that there are two carriers in the market and that the carriers are in a duopoly market with a linear demand function q = 100 – p and q = 90 – c. It is worth noting that, given the above two functions, we make the assumption that the carrier makes a profit with a value of 10 if it sells one unit of its product (p – c = 10). Finally, equation (1) is of the form q = 5 + y1 + y2. The functional form of this equation (q(y1, y2) = D + y
1 + y2) is based on the work by
Ngo and Okura (2008).Thus the initial demand (D) is 5. The
unit cost of increasing one unit of competitive level (kx) and cooperative level (ky) are 5 and 1 respectively. Using this set of randomly chosen data, we find the equilibrium competition level to be 3.75 units and the cooperation level to be 1.25 units. The resulting profit is 17.5 units. It is worth noting that this value reflects only the magnitude of the efforts that the carriers devote to cooperation and competition. For instance, each carrier decides to devote 75% to competing and 25% to cooperating. To further validate the model’s correctness and reasonableness, we present sensitivity analyses of parameters in the following sections.
5.1. Sensitivity analysis of initial demand level
We next perturb the parameters so that we can observe their impact. We first vary the initial demand level D in equation
(1) (q(y1, y2) = D + y
1 + y2) and summarize the impact of this
value on the equilibrium results in Table 1.
We can see from Table 1 that the competition level increases and the cooperation level remains constant as the initial demand level D increases. From equations (13) and (14), we can observe
consistent results. As the initial demand level increases, carriers
compete more to increase their own market shares and their cooperation levels do not vary with initial demand. However, with the rising initial demand, both carriers gain more profit.
Tab. 1. Sensitivity Analysis of Initial Demand Level
D x*
(competition level) y
*
(cooperation level) (profit)Π
5 3.75 1.25 17.50 10 6.25 1.25 30.00 15 8.75 1.25 42.50 20 11.25 1.25 55.00 25 13.75 1.25 67.50 30 16.25 1.25 80.00 35 18.75 1.25 92.50 40 21.25 1.25 105.00 45 23.75 1.25 117.50 50 26.25 1.25 130.00
5.2. Sensitivity analysis of cost of competition
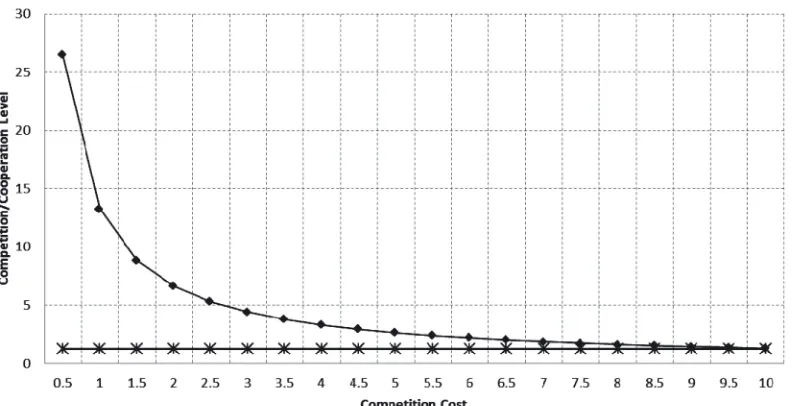
As the cost of competition increases, the competition level decreases and the cooperation level remains constant, as shown in Figure 2. In other words, the competition cost only has an impact on the competition level x. However, as equation (14) shows, the competition level does not influence the cooperation level y. Therefore, the cooperation level remains the same even if the competition cost is perturbed. One of the interesting phenomena we observe is that the resulting profits of both carriers are identical even for different competition costs. We believe that carriers adjust their competition strategies in response to changes in the competition cost and can there by achieve the same profit level even when the competition cost varies.
5.3. Sensitivity analysis of cost of cooperation
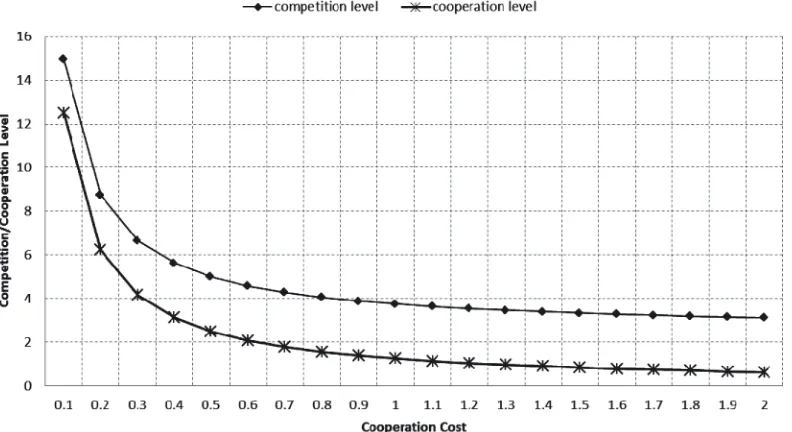
In this experiment, we perturb the cost of cooperation and summarize the results in Figure 3.
Unlike the competition cost, which has an impact only on the competition level, an increase in the cooperation cost (ky) decreases both the competition and cooperation levels. We can interpret these results on the basis of equations (13)
Fig. 2. Sensitivity Analysis of Competition Cost
and (14). According to equation (14), a change in the value of ky changes the equilibrium cooperation levels (y1* and y
2*).
Changes in y1* and y
2* then influence q(y1, y2) and c(y1, y2),
which results in changes in competition levels. It seems that the cooperation cost has a greater impact on the cooperation level than on the competition level.
5.4. Sensitivity analysis of parameters
in demand function
Finally, we vary the parameters in the demand function and see how the equilibrium competition and cooperation levels change in response. The results are summarized in Table 2.
Tab. 2. Sensitivity Analysis of Parameters in the Demand Function
α x
* (competition
level)
y* (cooperation
level)
π
(profit) (elasticity)εd
1 3.75 1.25 17.5 -12.3333 1.1 3.316327 1.071429 15.51021 -11.7273 1.2 2.944215 0.909091 13.81198 -11.2222 1.3 2.622874 0.76087 12.3535 -10.7949 1.4 2.34375 0.625 11.09375 -10.4286 1.5 2.1 0.5 10 -10.1111
Essentially, as the value of α increases, shippers’ or customers’ demand levels become less sensitive to price. In other words, the elasticity of price (εd) decreases as α increases. In this scenario, carriers are less willing to cooperate (the value of y* decreases) because cooperation will not change the market
size much and because carriers have less incentive to cooperate. At the same time, as carriers decrease their competition level, the resulting profit decreases.
6. CONCLUSION REMARKS
As the maritime freight transportation industry has become increasingly competitive in recent years, carriers have attempted to create more value by changing their business strategies to improve their operational efficiency, decrease their overall costs and increase business profits. One such strategy is coopetition between carriers in which small carriers collaborate with each other so that they can compete with leading carriers. In such a collaboration, small carriers have to collaborate with and compete with each other at the same time so that they can survive in the business. In this study, this carrier coopetition problem is investigated, and the manner in which a carrier determines its cooperation and competition levels is analyzed. The problem is formulated as a two-stage sequential game and empirically applied to example freight networks. The numerical results provide evidence that the model presented can effectively capture the problem and can be a useful tool in analyzing this type of coopetition game.
Although the numerical tests conducted in this study are limited, some interesting conclusions were drawn and insights gained and are presented in the numerical section. However, this study is not without its limitations. For instance, we assume that carriers in this game are equally competent and have identical capacities. In a more realistic scenario, carriers would be differentiated based on their capacities, and the resulting game might be different. Future research can explore possibilities along this line. Further, this study only observes certain impact of related issues (e.g. operation cost) on cooperation level and competition level empirically. Analytical analyses of these issues on the level of cooperation or competition should be explored. Finally, the current research assumes that there are not bargaining power differences among carriers. Including the bargaining power that differs based on carrier size or other factors can be an interesting research topic.
Fig. 3. Sensitivity Analysis of Cooperation Cost
Appendix I: Proof of Solution Uniqueness of the Profit Maximization Program
To prove the uniqueness of the solution of this game-theoretic coopetition model, we need to prove that the program is concave. Because the constraints introduced in the model are of linear form (P ≥ C ≥ 0, x1 ≥ 0, x2 ≥ 0, y1 ≥ 0, y2 ≥ 0), we only need to show that the objective function is concave for the whole program to be concave.
Denoting πi = (P – C)Qsi – kxxi – kyyi2, i ∈ {1,2} as function f{.}, we need to show that f[θ(x
i1, yi1), (1 – θ) (xi2, yi2)] ≥ θf(xi1, yi1) +
+ (1 – θ)f(xi2, y
i2) to reach the desired conclusion. The function inequality can alternatively be denoted as follows:
f(θx
11, θy
11
), (1 – θ)x
12, (1 – θ)y
12) ≥ θf(x
11, y
11) + (1 – θ)f(x
12, y
12)
(A1)Let xB and yB be the competition and cooperation levels, respectively, of the other carrier. The left-hand side of inequality (A1) is:
f(θx
11, θy
11
), (1 – θ)x
12, (1 – θ)y
12) = (P – C)[
D
+ θy
11+ (1 – θ) y
12+ y
B]
·– k
x[θx
11+ (1 – θ)x
12
] – k
y[θy
11+ (1 – θ)y
12]
2The right-handside of inequality (A1) is:
θf(x
11, y
11
) + (1 – θ)f(x
12, y
12) = (P – C)θ(A + y
11+ y
B)x
11/(x
11+ x
B) – k
xθx
11– k
yθ(y
11)
2+ (P – C) ·
· (1 – θ)(A + y
12+ y
B
)x
12/(x
12+ x
B) – k
x(1 – θ)x
12– k
y(1 – θ) (y
12)
2Rearranging the inequality, we obtain the following inequality:
(P – C)[
D
+ θy
11+ (1 – θ) y
12+ y
B]
k
y[θ(1 – θ) (y
11– y
12)
2≥
≥ (P – C)θ(
D
+ y
11
+ y
B)x
11/(x
11+ x
B) + (P – C)(1 – θ)(
D
+ y
12+ y
B)x
12/(x
12+ x
B)
We next simplify the inequality and obtain the following:
Note that, given the assumptions of this model, (x11 + x
B)(x12 + xB)[θx11 + (1 – θ)x12 + xB] ≥ 0, θ(1 – θ)xB(D + yB)(x11 – x12)2 ≥ 0
and (P – C) ≥ 0. Therefore, we only need to show that θ(1 – θ)xB(x11 – x
12) [y12(x11 + xB) – y11(x12 + xB)] ≥ 0 and (P – C) ≥ 0
for the inequality to hold. Note that the conditions x11 ≥ x
12, y11 ≤ y12 and x11 ≤ x12, y11 ≥ y12 will ensure that θ(1 – θ)xB(x11 – x12)
[y12(x
11 + xB) – y11(x12 + xB)] ≥ 0. The conditions x11 ≥ x12 and y11 ≤ y12 indicate that the carrier can invest fewer resources in
competition if it decides to invest more resources in cooperation (x11 ≥ x
12 and y11 ≤ y12). On the other hand, the carrier can
invest more resources in competition if it decides to invest fewer resources in cooperation (x11 ≤ x
12 and y11 ≥ y12). The second
itions are typically satisfied for a carrier with a fixed quantity of resources.
Based on this result, we show that the profit (objective) function for a carrier is concave. Given the linear form of the constraints, we can conclude that the profit maximization program for a carrier is concave. According to Kinderlehrer and Stampacchia (1980), because the profit function is concave, the marginal profit function(the gradient) is monotonic. Therefore, we can state the existence and uniqueness of the coopetition game based on this property. ■
Appendix II: The Equilibrium Condition for a Three-Carriers Coopetition Game
Similarly, we first assume that the total demand of three freight carriers depends on the level of cooperation in the two-stage game.
q(y
1, y
2, y
3) =
D
+ y
1
+ y
2+ y3
2For readability, we replaced q(y1, y2, y3), c(y1, y2, y3) and p(q) with Q, C and P so that the derivation process is clearer. The utility/profit functions of carrier 1, 2 and 3 are:
π
1= (P – C)Qs
1– k
xx
1– k
yy
12π
2= (P – C)Qs
2– k
xx
2– k
yy
22π
3= (P – C)Qs
3– k
xx
3– k
yy
32To make the model reasonable, without loss of generality, the following constraints should be imposed:
P ≥ C ≥ 0
x
1≥ 0, x
2≥ 0, x
3≥ 0
y
1≥ 0, y
2≥ 0, y
3≥ 0
The first-order conditions with respect to xi required to obtain the corresponding maximum utilities are:
The cost of expanding the competitive effort for each carrier therefore are:
We can conclude that the equilibrium competitive effort levels are:
We next use backward induction to analyze the first stage of the game from the results of second stage. Plugging x1*, x
2*
and x3* into the carriers’ utility functions leads to:
Applying the condition that ∂πi/∂yi = 0, ∀i ∈ {1,2,3}, the equilibrium cooperative effort levels are:
To summarize the results and replace the notations with the original meanings, we list the following equilibrium conditions for this coopetition game:
It can be noted that the equilibrium condition is similar to the condition with two carriers with only minor difference. For the games with more than three carriers, the same process can be applied.
REFERENCES
1. Agarwal, R. and Ergun, Ö. (2008) Mechanism design for a multicommodity flow game in service network alliances. Operational Research Letters. Vol. 36, pp. 520-524. 2. Agarwal, R., Ergun, Ö. and Sokol, J. (2010) Network design
and allocation mechanism for carrier alliances in liner shipping. Under revision for Operations Research. Available at: http://www2.isye.gatech.edu/~oergun/publications/ ErgunPaper5Alliance_OR.pdf.
3. Bengtsson, M. and Kock, S. (2000), “Coopetition” in business networks-to cooperate and compete Simultaneously, Industrial Marketing Management, Vol. 29, Issue5, pp. 411-426.
4. Cachon, G.P. and Netessine, S. (2004) Game theory in supply chain analysis. In: Simchi-Levi D, Wu SD, Shen ZM (eds) Handbook of quantitative supply chain analysis: modeling in the e-business era. Springer Science, New York
5. Dafermos, S. (1983) An iterative scheme for variational inequalities. Mathematical Programming, 26, pp. 40-47. 6. Ergun, Ö., Kuyzu, G. and Savelsburgh, M. (2007) Shipper
collaboration. Computers and Operation Research. Vol. 34, pp. 1551-1560.
7. Houghtalen, L., Ergun, Ö. and Sokol, J. (2010) Designing mechanisms for the management of carrier alliances. Submitted to Management Science. Available at: http://www2.isye.gatech. edu/~oergun/publications/AirAlliance_MS.pdf.
8. Humphreys, B.K. (1994) The implications of international code sharing, Journal of Air Transport Management, Vol. 1, No. 4, pp. 195-207.
9. Kinderlehrer, D. and Stampacchia, G. (1980) An introduction to variational inequalities and their applications. Academic, New York
10. Lin, C.-C. and Hsieh, C.-C. (2012) A cooperative coalitional game in duopolistic supply-chain competition, Networks and Spatial Economics, 12, pp. 129-146.
11. Luo, Y. (2007) A coopetition perspective of global competition, Journal of World Business,vol. 42, pp. 129-144.
12. McCain, R. A. (2010), Game theory: A nontechnical
introduction to the analysis of strategy, World Scientific, Ohio. 13. Nagarajan, M. and Sosic, G. (2008) Game-theoretic analysis of
cooperation among supply chain agents: Review and extensions, European Journal of Operational Research, Vol. 187, Issue 3, pp. 719-745.
14. Ngo, D. D. and Okura, M. (2008), Coopetition in a mixed duopoly market, Economic Bulletin, Vol. 12, Issue20, pp. 1-9. 15. Özener, O. Ö. and Ergun, Ö. (2008) Allocating costs
in a collaborative transportation procurement network. Transportation Science. Vol. 42, pp. 146-165.
16. Sutton, J. (1986) Non-cooperative bargaining theory: an introduction, The Review of Economic Studies, Vol. 53, No. 5, pp. 709-724.
17. Tai, H.-H. and Lin, D.-Y. (2012) Carbon reduction and environmental implications of daily-frequency operation in maritime international shipping, Technical Report, National Cheng Kung University.
CONTACT WITH THE AUTHORS
Dung-Ying Lin*, Ph.D., Associate Professor Chien-Chih Huang, B. Sc.
Department of Transportation and Communication Management Science
National Cheng Kung University
No. 1 University Road, Tainan City, 70101, Taiwan Phone: +886-6-2757575 ext. 53226
Fax: +886-6-275882 E-mail: [email protected]
* Corresponding author
INTRODUCTION
The costs of environmental protection for firms to reduce CO2 emission have increased considerably since the 1970s. These environmental costs are expected to rise even further. In the context of shipping operations, initiatives to reduce CO2 emission include: (1) use shore power, (2) reduce vessel speed, and (3) use cleaner fuel. Extra operational costs are incurred for upgrading equipment to use shore power, modifying operational procedures to cope with reduced vessel speed, and complying with environmental regulations. To remain competitive, cost-effective green shipping operations are essential for shipping firms (Lun et al, 2010). Hence, research on environmental management has extended from the focus on pollution control to the emphasis on both economic and environmental performance. Integrating both environmental concerns and commercial operations into shipping management has become increasingly important for shipping firms (Lun, 2011).
To enjoy scale operations, green shipping networks (GSN) can be established by using a hub-and-spoke system to support large containerships running forth and back between major ports (Lun and Browne, 2009). Such a system requires delivery of containers to feeder port first by trucks, then transferred to hub port by barges. In intermodal transport operations, the accessibility of road transport is the highest among all transport modes. However, the level of CO2 emission for trucking is the highest. Hence, containers should be first truck to the nearest port to minimize environmental damage. From the perspective of container port operations, ports in the region can be classified into feeder ports, hub ports, and direct ports. Under the hub-and-spoke system, feeder ports receive domestic containers
and transport them to hub ports. Hub ports are ports of loading that handle containers from feeder ports and also their direct containers. Benefits of the development of GSN include: (1) removing of mega containership vessels multiple callings port in a region, and (2) lowering CO2 emissions by using barge delivery between feeder ports and hub ports.
In view of the global community’s increasing concern for the environment, there is an urgent need for the PRD region to enhance environmental performance through the development of a GSN. However, establishing a GSN requires the full support of the port users, which in turn needs to adopt green shipping practices (GSPs) for the sustainable development of the shipping related industries. Users in the port community include shipping companies, shippers, terminal operators, and other transport operators (Lun and Caiou 2009). The establishment of a GSN is important to all port users. According to Lun et al. (2011), users in the port community can be characterized into the following types: (1) first-party users are parties that physically own the cargo to transport, e.g., global traders and small domestic exporters, (2) second-party users are parties that own the vehicles and/or facilities to provide logistics and transport services, (3) third-party users are parties that directly offer services to shippers, e.g., freight forwarders, customs brokers, and other value-added service providers, (4) fourth-party users are parties that supervise third-party logistics services providers to provide services to meet customer requirements, and (5) fifth-party users are parties that conduct research studies or provide consultation services to facilitate the development and growth of the region.
Port operations are closed linked with environmental quality (Gallagher, 2009). The challenge of today’s shipping
Development of green shipping network
to enhance environmental and economic
performance
Y.H. Venus Lun, DBA, Assistant Professor
The Hong Kong Polytechnic University, Hong Kong
ABSTRACT
To secure cargoes, containerships operate double or triple calling of ports in the Pearl River Delta (PRD) region in China. Such shipping operations generate high CO2 emissions. This paper suggest a green shipping network (GSN) as a useful tool to transship containers from feeder ports to hub ports to lower the overall CO2 emissions in the region. From the perspective of scale operations from using the hub-and-spoke approach and the deployment of mega ships, developing a GSN within the PRD region can be beneficial,
both economically and environmentally, to port users in the container transport chain.
Keywords: Shipping Management; Shipping Network; Environmental Management; Firm Performance
POLISH MARITIME RESEARCH Special Issue 2013 S1 (79) 2013 Vol 20; pp. 13-19 10.2478/pomr-2013-0023
industry is to enhance economic performing while reducing negative environmental impacts. Environmentally sustainable operations have emerged as an important topic for firms to prosper and for policy makers to showcase their commitment to environmentally friendly operations (Sarkis et al., 2010). For the past few decades, the emissions of greenhouse gases have increased by approximately 70% (Metz et al., 2007). Increasing emissions of greenhouse gases due to transportation related activities have become a serious concern. There is an urge for shipping firms to adopt green shipping practices (GSPs) to reduce the environmental damage caused by global trade activities (Lai et al., 2011). Establishing a GSN in the PRD region can also balance the interests between reducing CO2 emissions and running market-led operations for economic gains. To establish a GSN, it is essential to investigate green shipping practices (GSPs) as organizational antecedents, and to achieve the ultimate goal of developing green shipping hubs (GSHs). This study is important to users in the shipping related industries in two perspectives. The first one concerns the identification of a potential GSN and the development of GSHs in the PRD region. The second one is to advance knowledge in shipping research that GSPs are important to the establishment of GSN.
DEVELOPMENT OF GREEN SHIPPING
NETWORK
Liner shipping provides a regular publicized schedule of shipping service between seaports. a function of liner shipping is to satisfy the shipping demand for regular freight transport. Liner ships service international seaborne trade with cargoes consolidated from a large number of consignments from different shippers. a key objective of liner shipping operations is to fully utilize the capacity of their fleets. Operating a large container ship involves huge capital investment and high daily operating costs (Lun and Marlow, 2011). Shipping firms can gain efficiency from improving fleet utilization through ship routing, which is concerned with the assignment of sequences of ports to be visited by ships (Zhang et al., 2011).
The factors needed to be considered by shipping firms to plan liner shipping services include shipping service scope and fleet mix (Lun and Browne, 2009). In planning a liner service route, it is important to decide the type of shipping routes. With increasing significance of pendulum services and transshipment networks, most liner services on the main shipping routes provide the line-bundling service. By the overlay of their roundtrips, shipping firms can offer a desired calling frequency to customers. For instance, OOCL, one of the mega global shipping lines, offers four weekly sailing line-bundling shipping services from South China to North America with its alliance members. The ports of call of these four liner shipping services are illustrated in Table 1. Other global liner shipping companies offer similar line bundling loops to transport containers to and from the PRD region.
Asia is one of the busiest areas for containerized trade. The top container ports of the world in terms of throughput are Shanghai, Singapore, Hong Kong and Shenzhen. Two of these top container ports, namely Hong Kong and Shenzhen, belong to the PRD region and they are adjacently located and economically connected. However, unproductive competition seems to emerge due to unclear roles of individual ports and a serious lack of development of a shipping network among PRD ports. Facing with the environmental concern, it is essential to use all resources efficiently and effectively. From the perspective of shipping operations, use of equipment in the containers terminals and shipping capacity should be used effectively to reduce wastes. Doubling of triple calling of ports involve longer voyage distance which can be considered as a waste of resources.
In addition to using extra shipping capacity, calling more ports in the region leads to extra CO2 emissions. As shown in Table 1, all the four liner services (i.e., SSX, PNX, PAX, and SCE) call both the ports of Hong Kong and Shenzhen, which incur addition voyages distance in the PRD region. The resultant extra CO2 emissions can be avoided if a GSN can be developed to reduce the environmental harms associated with shipping routes. As shown in Table 1, it is estimated that an excessive 8.1 million kg of CO2 is emitted annually because of Tab. 1. OOCL Liner Shipping Service (South China Outbound to North America)
Weekly Sailing
Liner Service Ship Size Ports of call in PRD region Voyage distance between ports in PRD CO2 emission in PRD region Super Shuttle x 86 = 35,604,000 grams HK SW = 45km CO2 emissions per week (due to double or triple calls at PRD ports) 155,994,000 grams CO2 emissions per year (due to double or triple calls at PRD ports) 8.1 million kg
a) SE = Shenzhen East b) SW = Shenzhen West c) HK = Hong Kong d) Assume 75% load factor e) Assume CO
2 emission by ocean-going vessel = 86 grams per km/TEU (i.e., twenty-foot equivalent unit)
double or triple calling of PRD ports. Only one shipping line generates such a huge amount of CO2 emissions. Other shipping lines offering liner services to and from PRD ports also operate similar routing patterns. As a results, there are huge amount of avoidable CO2 emissions resulting from double or even multiple calling of ports within the PRD region.
Liner shipping service providers make key decision in ship routing to secure cargoes. In international shipping, the head hauls are eastbound route from Asia to America and westbound route from Asia to Europe. To development green shipping network, port operators also play an important role. There are several container terminal operators in the PRD region with Hong Kong and Shenzhen as the key operating areas. The port of Hong Kong is served by five operators where HPH and MTL are the main terminal operators. On the other hand, the port of Shenzhen consists of ports in Shenzhen East (i.e., Yantian) and Shenzhen West (i.e., Chiwan, Dachan Bay, and Shekou). In the port of Shenzhen, the port of Shenzhen East is operated by HPH and the ports of Shenzhen West are operated by MTL.
Estimation of the direct voyage distance between the port of loading and the port of discharge can be a useful tool to identify the relative environmental cost for containership transport between these ports. An alternative route to transport containers is to develop a shipping network to transport the containers from a feeder port to a hub port by barges, and then ship the containers to discharging ports by containerships. Reduction of environmental damage in the PRD region is achieved when the alternative route is shorter than the direct route in terms of the equivalent containership distance (ECD) travelled. These shipping routes also avoid double or triple calling of ports in the PRD region. As a result, the shortest route for any given pair of origin and destination originating in this region is the route with the lowest environmental cost for container shipping.
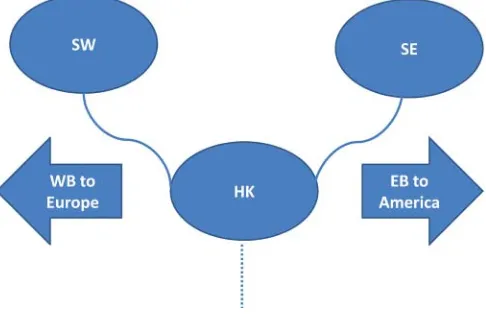
Appendix 1 illustrates the formulas to determine the voyage distances of a direct voyage and alternative routes between the ports in the PRD region and their discharging ports. This formula is a useful tool to identify the routes with the lowest environmental costs when shipping containers take routes via other ports instead of using direct loading. Based on proposed tool, the green shipping network for head hauls in PRD region is shown in Figure 1. Ports in East of Shenzhen (SE) and Hong Kong (HK) should develop as hub ports to handle eastbound (EB) cargo to America while ports in West of Shenzhen (SW) and Hong Kong (HK) should develop as hub ports to handle westbound (WB) cargo to Europe.
Fig. 1. Proposed Green Shipping Network in PRD
To minimize CO2 emissions, it is desirable to develop a GSN in PRD ports by using barges to carry containers from feeder ports to hub ports, which helps reduce the total emission volume. With the development of such a GSN,
GSHs in the PRD region can be identified. As trucks produce the highest level of CO2 emissions, the use of trucking should be minimized. For inland transport, containers should be transported from the shippers’ warehouses to the nearest port within the PRD region to reduce CO2 emissions. Ports can then be classified into feeder ports and hub ports. Feeder ports are ports that have higher external costs when they act as ports of loading for mainland containerships instead of using barges to transport containers to hub ports. Hence, it is worthwhile for feeder ports to transport their containers to a GSH for minimizing the total external cost in the PRD region. Hub ports are ports of loading that handle containers from feeder ports and also their direct containers.
ADOPTION OF GREEN SHIPPING
NETWORK
Using CO2 emissions as the analytical base, ports in the PRD region can be classified as feeder ports or hub ports. To enhance environmental performance, it is desirable to develop GSHs in the PRD region with the objective of having fewer ports of call for larger containerships. The GSN can be operated by large vessels based on scheduling vessels forth and back between major ports and supported by a hub-and-spoke system, where containers are first delivered to a feeder (or spoke) port by trucks, followed by transfer to the hub port by barges. Containers can deliver to the hub port directly if the nearest port is a hub port. a shipping hub is generally well equipped to facilitate the quick turnaround time of a large containership. Such a hub allows the development of linkages between origins and destinations where port users in the port community can achieve operational gains from operating cost through the deployment of larger ships and provide wider service through the development of feeder ports. It can also serve as a transshipment place, where feeder shipping routes are connected with one another with trunk routes for ocean-going voyages. Recently, container shipping firms have established connections with hub ports in order to make their operations cost-effective.
The use of shipping hubs implies the deployment of larger ships to transport containers. Container shipping companies operating larger ships can benefit from reduced cost per TEU. Cost efficiency is one of the most popular size-based strategies for container shipping firms to deploy mega ships. The development of a GSN indicates that huge cargo volumes are available in the hub port, which facilitates the deployment of bigger ships. Reasons for container shipping firms to deploy bigger ships include (1) large ships allow the carriage of a greater cargo volume per ship, (2) large ships equipped with efficient engines improve vessel speed, and (3) greater flexibility in container stowage can be achieved with larger ships. Larger ships are also more energy-efficient, requiring less fuel and emitting less CO2 per TEU transported.
A shipping network refers to the framework of routes within a system of nodes. Using the main container ports in the PRD region as nodes, this study proposes routes for transporting containers from these nodes to their destinations as a GSN in the PRD region. a corporate shipping network can be seen as strategic interdependence, i.e., “a situation in which one firm has the tangible or intangible resources or capabilities beneficial to but not possessed by the others” (Lun et al., 2009). With the development of shipping hubs in the PRD region, the shipping industry will benefit from using the hub-and-spoke approach. In a shipping hub, firms participate in upstream and downstream activities jointly and their collective economic actions lead to the emergence of a GSN.