JEJAK
Journal of Economics and Policy http://journal.unnes.ac.id/nju/index.php/jejak
Analysis of Production Functions and Efficiency of Corn at Patean
District Kendal Regency
Budi Arif Nugroho1
1Diponegoro University, Indonesia
Permalink/DOI: http://dx.doi.org/10.15294/jejak.v8i2.6168
Received: July 2015; Accepted: August 2015; Published: September 2015
Abstract
Food is the major need for human to survive. Corn is one of the most important food crops in the world after wheat and rice. Besides, corn is a source of carbohydrates and can also be an alternative food source. In fact, the world demand for corn to meet the need of food and cattle industry has increased every year as well as at the national level. This is due to not only the growth of population, but also the food and farm industry. The growth of corn farm increased rapidly in the last three years in Patean district, Kendal regency. However, the productivity was still low reaching only 4.57 tons/ha. This condition is interesting to review especially on the anlysis of production function and the efficiency of corn farming in the area. The aim of this reseach is to analyze the producton function and efficiency of corn farming. This study used Frontier Analysis approach.
Keywords: Efficiency, Farming, Corn, Frontier Analysis
How to Cite: Nugroho, B. (2016). Analysis of Production Functions and Efficiency of Corn at Patean District Kendal Regency. JEJAK: Jurnal Ekonomi Dan Kebijakan, 8(2), 160-172. doi:http://dx.doi.org/10.15294/jejak.v8i2.6168
© 2015 Semarang State University. All rights reserved Corresponding author :
Address: Jl. Prof. Soedarto, SH, Tembalang, Semarang City, Central Java
E-mail: [email protected]
INTRODUCTION
Food security improving program is intended to operationalize the development in order to improve the food security both at national and community level. Food in a broad sense includes food derived from plants, animals and fish to meet the needs of carbohydrates, protein, fat, and vitamins and minerals that are beneficial to the growth of human health (Maharisni, 2011).
Setiawan and Prajanti (2011) stated that agriculture is one of the main sectors that support the people's lives because the agricultural sector is a livelihood of most population in Indonesia. There are many varieties of agricultural commodity in Indonesia. Corn is a commodity that is widely consumed beside rice as the largest commodity consumed by the Indonesian people.
Nurwahidah et.al. (2015) mentioned that Corn farming productivity is productivity resulted during one planting season that is planting season on MH (OctoberApril) for dry season (Labangka district) and wet land (Utan district) corn planting season in MK1-MK2
(April-October). Corn is one of the important
food crops in the world, other than wheat and rice. Corn is a source of carbohydrates and becomes an alternative source of food. People in several regions in Indonesia (e.g. Madura, Nusa Tenggara and some regions in Java) also use corn as a food staple (Adisarwanto and Yustina, 2004).
Besides being a source of carbohydrate, corn is also used as animal feed (forage and cob), extracted oil (from seed), made of flour (from grains, known as cornmeal or cornstarch), and industrial raw materials (from wheat seeds and cob flour). Pentose-rich corn cobs are used as the raw material for making furtural (Adisarwanto and Yustina, 2004). Corn seed is rich in carbohydrates, containing up to 80 percent
of all dry seed ingredients. Carbohydrate in the form of starch is generally a mixture of amylose and amylopectin. In glutinous corn, most or all of the starch is amylopectin (Danarti, 1998).
Corn as a source of carbohydrate plays an important role as one of the Indonesian food. However, because the production and the supply of corn in the country until today have not been able to meet its own needs, corn is often imported from abroad (Danarti, 1998). Corn is also widely used as industrial raw materials and the animal feed, which levels of need is great. The use of corn as a feed ingredient for poultry also leads to a surge in demand every year.
The world's demand for corn to meet the needs of the food industry and the animal feed industry is increasing. Total corn production at the world level is 690 million tonnes, 40% of which are contributed from US, 20% from China, 7% from the European Union and Brazil as many as 6%. The international market conditions like that is an opportunity for Indonesia to increase the corn production and export overseas. Indonesia has an opportunity to supply the corn in the world market, especially exporting it to the neighboring countries like 2.5 million tons of Malaysia, 4.6 million tons of Taiwan, Japan 16 million tons, 8.5 million tons of Korea, one million ton of Chine, 5.3 million tons of Egypt, 2.3 million tons of Iran, and 1.4 million tons of Arab per year (Ministry of Agriculture, 2010).
to increase rapidly at a rate of respectively 3% and 5.78% per year (Ministry of Agriculture, 2010). Based on the National Economic Social Survey of 2010 (SUSENAS, 2010) by the Central Bureau of Statistics, it shows that the domestic corn consumption in Indonesia decreased by 7.2 % from 2.21 kg / capita / year in 2009 to 2.05 kg / capita / year in 2010. The demand for more corn is used for non-consumption such as animal feed, food industry and fuel oil.
The domestic corn demand in 2010 was increased to 13.6 million tons, in 2015 increased to 15.9 million tons and in 2020 was estimated at 18.9 million tons. Without special efforts to stimulate the national production, the import of corn in 2005 and 2010 is estimated respectively by 937 thousand tons and 740 thousand tons and in 2015 and 2020 reach 1.03 million tons and 1.68 million tons (Ministry of Agriculture, 2010).
Based on the information above, the prospects for the corn market in the domestic market and the world market is very bright. The domestic corn market is still wide open considering that the corn production in Indonesia has not been able to meet the needs of the domestic demand. The increasing demand and the absence of world corn market show that the world corn market is wide open for the new exporters. Therefore, Indonesia's efforts to develop the corn in the medium and long term prospective are reviewed from the aspects of the national corn market and the expansion of planting area of corn.
Great world corn market is an opportunity that should be utilized. Indonesia has an opportunity to fill in the corn market through the increased production of corn in the country. The
increased production can be done by increasing the productivity of corn and the corn planting area expansion.
The development of food industry that processes the corn into various forms of refined products makes the demand for corn in the country increasing. On the other hand, the production and productivity of corn in national level is still low, about 4.31 tons / ha, while the corn production technology has provided the results of 4.8 to 8.5 tonnes / ha, depending on the soil conditions and the level of technology application. Viewed from the aspect of productivity and availability of cultivation technology, the opportunity to increase the productivity of corn in the farmer level is still wide open (Subandi, 2005). The low production and productivity of corn cause the imbalance between the production and the demand both domestically and abroad.
The corn crop in general is the food crop that is favoured by the farmers in Central Java, and many farmers cultivate the corn in Kendal. All districts in Kendal Regency are the corn crop. The total acreage of corn plants vary in every district in Kendal, depending on the potential of each district.
Table 1. Development of Harvest Area, Average Yield per hectare and Corn Production at Patean District in 2013
Villages
Patean 7.139 4.57 32,649
Source: Patean District in Numbers, 2013
The development of the corn crop in Patean, particularly for the last three years, is very rapid. In Table 1 it can be seen that the harvest area and production have increased, but seen from the productivity it is still low, which only reached 4.57 tons / ha. When compared to the productivity of Central Java Province that reached 4.80 tons / ha, it is much lower, as well as other districts as the three major corn producing those are Wonogiri which productivity reached 5.55 tons / ha, Grobogan reached 5.06 tons / ha and Blora reached 4.61 tons / ha. This condition is interesting to study about the efficiency of corn cultivation farming in Patean, Kendal.
To increase the productivity of corn from every land, the farmers are always having problems in using the capital and appropriate technologies. In facing such a
selection, the combination of using capital such as seeds, fertilizers and medicines in addition to the right labors will be the basis in carrying out the selection.
yield potential of 6.08 to 7.03 tons /Ha. The cause of the low productivity of corn is that the price of production factors from year to year tends to increase, especially the price of fertilizers (Urea, SP-36, KCL) and pesticides. Besides, the price of corn during the harvest is erratic and often less profitable for the farmers. Another factor often experienced by most corn farmers is the lack of capital to buy inputs such as seed, fertilizers and drugs. Simon and Alan (1999) explained that the efficiency measures are widely used in the economic welfare to show the allocation of resources in the use of high value. Based on this, it encourages the writer to conduct a research on the analysis of the production function and efficiency of farming corn for corn farmers that is conducted in Patean, Kendal. The purpose of the research is to analyze the functions of production and efficiency of corn production in Patean, Kendal, while the data analysis used is the Frontier Analysis to calculate the function of production and the corn farming efficiency levels.
Production is the end result of a process or economic activity by using some feedback or input. Soekartawi (2003) stated that the production function is the physical relationship between the variables described (Y) and a variable that explains (X). Variables described are in the form of output while the variables explaining are in the form of input. Mathematically, this relationship can be described as follows:
Y=f(X1,X2,X3,...Xn)... ... (2.1)
With the function of production as mentioned above, the relationship Y and X can be known.
In which:
Y: the level of production
X1 ... Xn: factors of production (input)
Farmers as the farm manager should be able to allocate the use of production factors in order to achieve the optimum results so as to obtain the maximum revenue. Applying the correct farming can improve the production efficiency and the farmers’ revenue. Both objectives are the determinant factor for a farmer to take a decision in his farming operation.
Cobb-Douglas production function is a function or equation that involves two or more variables, one is called the dependent variable (Y) and the other is called the independent variable (X) (Soekartawi, 2003).
Mathematically, the Cobb-Douglas function can be formulated as follows:
Y=aX1b1X2b2…Xibi…Xnbneu………
…….… ( 2.2.)
Explanation :
Y: variable described, X: variables that explain,
a, b: the amount that would be expected, u: error (disturbance term),
e: natural logarithm, e = 2.718
To simplify the prediction, the above equation can be converted into a multiple linear form by making the equation the logarithm become:
logY = log a + b1 + b2 logX1 logX3 logX2 + b3 + ... .. + bn logXn + e ... (2.3. )
said to be more technically efficient when using the same input set, the product produced is higher. Technical efficiency is also often called long-term efficiency. Price or allocative efficiency shows the relationship of cost and output. Efficiency will be achieved if the value of the marginal product (NPM) for an input equals to the price of inputs or can be written: NPMXi = PXi or NPMXi = 1PXi.
In fact NPMXi is not always the same as PXi. What often happens is as follows:
a. (NPMXi / PXi)> 1 means that the use of input X is not efficient yet, input X should be increased to achieve the efficiency. b. (NPMXi / PXi) <1 means that the use of
input X is not efficient yet, input X needs to be reduced to achieve the efficiency (Soekartawi, 2003).
Such efficiency is also called the price efficiency or allocative effisiency.
Economic efficiency occurs when two previous efficiencies, the technical and price efficiency, are achieved and meet the two conditions, among others:
a. Terms purposes (Necessary condition), which shows the physical relationship between the input and output that the production process at the time of production elasticity is between 0 and 1. b. This result is the technical production
efficiency.
c. Terms adequacy (sufficient condition) related to the objective, which is the maximum profit condition is reached as long as the marginal value product equals to the marginal cost.
Factors of Production of Corn Farming
Soekartawi (2000), stated that factors of production are all given to the plant so that the plant is able to grow and produce well. Factors of production are known as the term input. Factors of production determine the
large-small production that is found. Factors of production that we already know are land, capital, labor and management aspects and those are the important factors of production.
Factor of farming is some of the activities on the earth's surface where a farmer, a family or a salaried manager farms or raises livestock. A farmer is trying to farm as a way of life and to do agriculture because he is a farmer. What farmers do is just make meeting the needs. In a sense that the farmers take the time, money, and combine the input to create the output is agriculture that can be viewed as a kind of enterprise. (Maxwell L. Brown, 1974 within Soekartawi, 2003b).
RESEARCH METHODS
In this research, the method of data collection uses interviews and documentation. Method of interviews is conducted by interviewing the farmers directly as respondents using the tools of the list of questions prepared in advance. Documentation is done by conducting a survey of the existing data and exploring theories that have developed, and analyzing the existing data that has been done by the previous researchers.
To reduce and prevent haziness in the discussion, it is necessary to give definition or operational meaning of each variable discussed. These variables are:
1. Corn production (Y), which is the harvested corn produced in one planting season, measured in square meter (m2). 2. Land area (X1), which is the land area
used for the corn production, measured in square meter (m2).
3. Amount of seeds (X2), which is the amount of seeds used for the corn production in one planting season, measured in units of kilograms.
unit area for the corn production during one planting season, measured in kilograms
5. Amount of Pesticides (X4), which is the amount of pesticide with a unit area for the corn production during one planting season, measured in liters.
6. Amount of Workers (X5), which is the amount of labors used for the corn production during the planting season,
measured in the day of people’s working
(HOK).
The type of data used in this research is the primary and secondary data. The primary data is collected directly from the corn farmers who have been selected as the respondents or sample, which is assisted by the list of questions (questionnaire). The secondary data contains the supporting data from the primary data, which is taken in time series, which is obtained through the study of literature from a variety of sources, journals, books, research, and limited publication of archives data from Institutions / Agencies.
Samples are partly taken from the population, Sudjana (1996: 6). To determine the size of the sample of a population, it can be calculated and used together with Slovin formula (Sevilla and Consuelo, 1993) and Uma have now (2000) as follows:
n = N ... ( 3.1.)
1+ N(Moe)2
in which :
n = measure of sample N = measure of population
Moe = Margin of error Maximum (errors that are still tolerated, taken 10 %). Reffering to the formula, the amount of samples in this research is:
n = 3.547 . 1+ (3.547 (0,1)2 )
n = 3.547 . 1+ (3.547) (0,01)
n = 3.547 . 1+ 35,47
n = 3.547. 36,47
n = 97,26 = 97
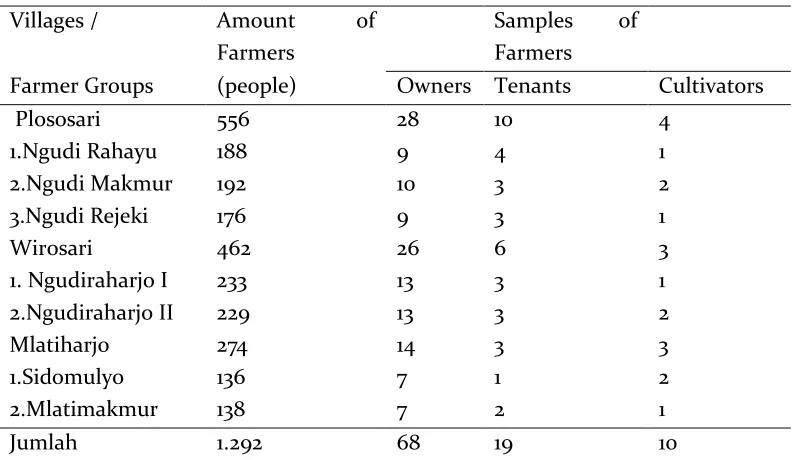
To determine the sample villages, from eleven villages in the corn producing regions in Patean, three villages are selected as the sample. The village that has the highest production of corn crop and the biggest amount of the farmers in Patean is Plososari village with the production of 9,387 tons, then the next villages as the sample are those that have the corn production below Plososari those are Wirosari village with the production of 4,313 tons and Mlatiharjo with the production 4,055 tons. The location research is intentionally determined by specific objective / characteristics using the purposive sampling techniques (Sudjana, 1996).
proportionally (Sudjana, 1996) using the following formula:
ni = Ni x n ... ( 3.2.) N
in which :
ni = measure of sample from strata to i Ni = population at strata to i
N = population at sampled village n = determined sample amount
The deployment of the number of sample from the formula is shown in Table 2 below:
Table 2. Distribution of Sample
Villages / Amount of
Farmers
Samples of Farmers
Farmer Groups (people) Owners Tenants Cultivators
Plososari 556 28 10 4
1.Ngudi Rahayu 188 9 4 1
2.Ngudi Makmur 192 10 3 2
3.Ngudi Rejeki 176 9 3 1
Wirosari 462 26 6 3
1. Ngudiraharjo I 233 13 3 1
2.Ngudiraharjo II 229 13 3 2
Mlatiharjo 274 14 3 3
1.Sidomulyo 136 7 1 2
2.Mlatimakmur 138 7 2 1
Jumlah 1.292 68 19 10
Source : PPL Patean District, 2013, processed
The model used in this research illustrates the relationship between inputs and outputs in the production process, which is known as the Cobb-Douglas function. To estimate the factors that affect the output (Y), Cobb-Douglas model is appropriate to use because this is the most relevant model.
The mathematical model of Cobb-Douglas production function for the corn farming in this research can be written as follows:
Y=aX1b1X2b2…Xibi…Xnbneu………
…….…… ( 3.3.) Explanations :
Y` : Corn Production X1 : Land Area X2 : Amount of Seeds X3 : Amount of Fertilizer X4 : Amount of Pestiside
X5 : Amount of Labors X6 : Other Costs
a, b : Expected Magnitude u : Errors (disturbance term), e : Natural Logarithm, e = 2,718
Efficiency is a concept that is relative. Tests on efficiency are carried out to see how the combination of the use of certain production factors can produce the optimal output. There are three concepts of efficiency, i.e. the technical efficiency (ET), the economic efficiency (EE), the price/allocative efficiency (EH).
1. Technical Efficiency
ET = Yi/Y^i.………(3.4.)
ET = Level of technical efficiency
Yi = Magnitude of production (output) to – i
Y^
i = Magnitude of expected production at observation to –i found through Cobb-Douglas frontier production function.
2. Price/Allocative Efficiency
Allocative (price) efficiency according Soekartawi (2003) is that the price efficiency will be achieved if the farmers are able to make an effort if the value of marginal product (NPM) for an input equals to the price of inputs or it can be written:
NPMXi = PXi ...……… ( 3.5.) NPMXi = 1 PXi .………..…… ( 3.6.) in which:
NPMXi = Marginal Product Value PXi = Price of production factor X
In fact, NPM Xi is not always the same as PXi. What often happens is as follows:
a. (NPMXi / PXi)> 1, which means that the use of inputs X is not efficient yet, input X should be increased to achieve the efficiency.
b. (NPMXi / PXi) <1, which means that the use of inputs X is not efficient yet, input X needs to be reduced to achieve the efficiency (Soekartawi, 2003b).
2. Economic Efficiency
Economic efficiency occurs when the input is used in such a way that an output level is produced at a lower cost than others. Increased efficiency occurs when the existing output or level of output is produced with lower costs.
Economic efficiency is to minimize the cost, which means that a production process
will be economically efficient at an output level when no other process can produce the same output with less cost.
Economic efficiency can be achieved if the technical efficiency and price efficiency is reached (Soekartawi, 2003b) and it can be written with the following formula:
EE = ETX EH ... (3.7.) If the value of efficiency > 1, it means the use of the input should be increased; if the value of efficiency = 1, it means the allocation of input is optimal; if the efficiency values <1, it means the use of input needs to be reduced (Soekartawi, 2003b).
One of the factors that affect the performance of the cultivation of the corn crop is the corn farmer status factor that is the age of the alleged effect on corn production. The data shows that the age of a corn farmers in Patean are dominated by the ages of 41-50 years old as many as 30 people (30.93%), 51-60 years old as many as 24 people (24.74%), 31-40 years old as many as 21 people (21.65%), more than 60 years old as many as 18 people (18.56%), and 0-30 years old as many as four people (4.12%).
RESULTS AND DISCUSSION
Table 3. Description of Variables of Corn Farming in Patean, Kendal
Source : Primary Data Processed.
For the labors, the corn farming in Patean, Kendal on average completes the work in 60.45 days of people’s working with a value of Rp 2,115,876.-
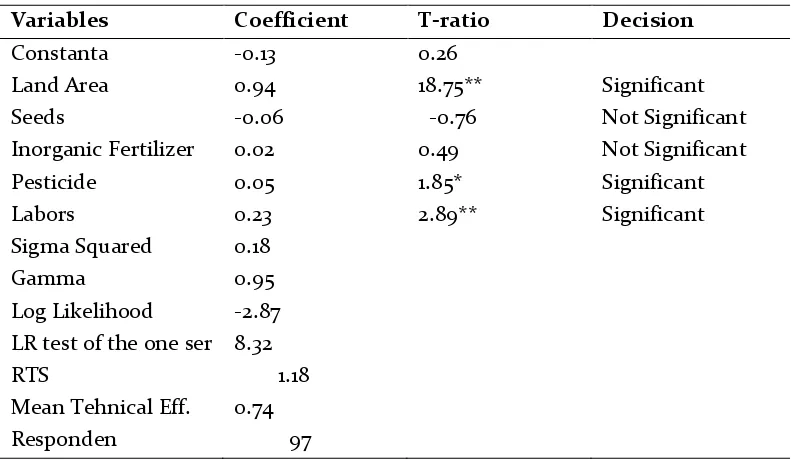
Technical efficiency becomes imperative requirement to measure the price and economic efficiencies. Technical efficiency requires or entails the production process that can utilize fewer input to produce output in the same amount (Miller and Meiners, 2000). Table 3 describes the results of the estimation of frontier production function of corn farming in using five independent variables. The followings are the results estimation of the production function. From five independent variables, there are three that show the significant effect on the corn production, which are land, pesticides and labor. While other variables those are the amount of seed and inorganic fertilizer have no significant effect.
The results of analysis of the frontier production function of corn farming shows that the significant variables are variables of land area, pesticides and labor. Variables of land area and labor are significant at a = 1% whereas the pesticide variable is significant at a = 5%. When viewed from the average of technical efficiency 0.74, it can be said that the farming in the research area is not so
efficient that to achieve efficiency in the use of inputs, the amount of input should be added.
Variable of land area has a positive coefficient. The positive sign in this land area coefficient implies that the more the land areas are used for the corn farming, the more production of corn will be increased.
The farmers have a limited amount of land. Each land area owned by the farmers is less than 0.5 hectares; it can be said that the farmers in Patean are generally the landless farmers.
The variable of the amount of seed is not significant and shows a negative sign on the corn production. It can be seen from t ratio with the magnitude smaller than t table. Negative coefficient sign on the amount of seeds explains that the more seeds are used, the output will decrease. The insignificant use of seed in this case may be because the farmers use the seeds excessive. They assume the more seeds are planted, the more corn production will be produced.
Frequently the problem faced by the farmers is the difficulty to find the fertilizer market when needed. If the fertilizers are found in the market, they must be expensive because they are limited. Finally the farmers use the fertilizer in sober quantity not as many as the quantity of planting according to the rules set forth by the department of agriculture.
Variable of pesticide has a positive coefficient. A positive sign on the coefficient of these pesticides means that more pesticides are used for the corn farming, the more production of corn will be produced. Pesticide use on corn crop is not too much because the pests that attack the corn crop is not much. Excessive use of pesticides can lead to lower production quantities of corn. The intractable corn pests difficult to control by the farmers are rats. Flocking in large numbers, mice will attack the corn plant in
young age. Rats are difficult to overcome because they move from one patch of corn crop to another. If the corn crop is missed from the pests’ attack, their products will be good.
Variable of labors has a positive coefficient. A positive sign in this labor coefficient implies that the more labors used for the corn farming are, the more production of corn will be produced. Labor use on corn crop is generally limited to be simply conducted by the members of farmer families. In Patean all activities of plating corn are carried out enough by the family workers. At the time of land preparation, the farmers usually use the additional labors outside their family members. For other activities such as planting, pest controlling, weeding harvesting dams, it is usually sufficiently conducted by the family labors.
Table 4. Estimation Result of Production Function at Corn Farming in Patean, Kendal
Variables Coefficient T-ratio Decision
Constanta -0.13 0.26
Land Area 0.94 18.75** Significant
Seeds -0.06 -0.76 Not Significant
Inorganic Fertilizer 0.02 0.49 Not Significant
Pesticide 0.05 1.85* Significant
Labors 0.23 2.89** Significant
Sigma Squared 0.18
Gamma 0.95
Log Likelihood -2.87 LR test of the one ser 8.32
RTS 1.18
Mean Tehnical Eff. 0.74 Responden 97 Source : Primary Data Processed Explanations :
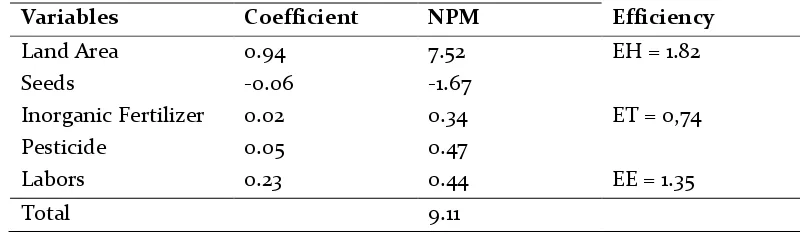
Table 5. Values of Price Efficiency and Economic Efficiency on Corn Farming
Variables Coefficient NPM Efficiency
Land Area 0.94 7.52 EH = 1.82
Seeds -0.06 -1.67
Inorganic Fertilizer 0.02 0.34 ET = 0,74
Pesticide 0.05 0.47
Labors 0.23 0.44 EE = 1.35
Total 9.11
Source : Primary Data Processed
Farrel Study (in Susantun, 2000) mentioned that the frontier production function is a function that shows the highest probability of what might be achieved by the farmers with the existing conditions in the field, where production is technically efficient and there is no other way to obtain a higher output again without using more inputs controlled by the farmers.
The estimation results show that from 97 respondents of farmers who cultivate the corn crop, they have an average technical efficiency of 0.74. The resulting value of the technical efficiency implies that the use of factors of production by the farmers have not been efficient.
The input used in carrying out the corn farming is the land area, seeds, inorganic fertilizers, pesticides, and labors. The results of analysis of price efficiency and economic efficiency for corn farming can be seen in Table 5.
From Table 5, it can explain the condition of corn farming in Patean, Kendal. Value of price efficiency (EH) is 1.82, which means that the use of corn farming inputs in Patean is not efficient. The input should be added to achieve the efficiency levels. Based on the value of technical efficiency (ET) and price efficiency (EH), the economic efficiency can be seen of 1.35. This shows that farming is not efficient and therefore it is necessary to add the factors of production in order to
achieve an efficient condition.
CONCLUSION
From the research that has been conducted. there are some conclusions as follows:
1. The results of frontier production function analysis of the corn farming in the area of research found that the significant variables are land area, pesticides and labors. Variables of land are and labors are significant at a = 1% whereas variable of pesticides is significant at a = 5%.
2. From the average technical efficiency of 0.74, it can be said that the farming in the research area is not efficient so as to achieve the efficiency in the use of inputs, the number of inputs should be added.
REFERENCES
Adisarwanto T. dan Yustina E. W., 2004. Meningkatkan Produksi Jagung Di Lahan Kering, Sawah dan Pasang Surut. Jakarta : Penebar swadaya. Altieri, M. 2010. Enhancing the productivity and
multifunctionality of traditional farming in latin America. International Journal Sustain Development World Eco. 7, 1-12
Anonim, 2002. Program Pengkajian dan Diseminasi BPTP Jawa Tengah. BadanPenelitian dan Pengembangan Pertanian. Departemen Pertanian,.Jakarta.
Badan Pusat Statistik (BPS) , 2000, Sensus Penduduk. Badan Pusat Statistik (BPS) , 2008 - 2010, Produksi Padi
Dan Palawija Propinsi Jawa Tengah.
Badan Pusat Statistik(BPS), 2013, Kendal Dalam Angka. Badan Pusat Statistik (BPS), 2013, Kecamatan Patean
Dalam Angka.
Badan Pusat Statistik (BPS), 2013, Pedoman Pengukuran Produktivitas Padi Dan Palawija.
Budi Suprihono, 2003. Analisis Efisiensi Usahatani Padi Pada Lahan Sawah di Kabupaten Demak. TesisMIESP Undip Semarang.
Danarti, S. N., 1998. Palawija, Budidaya dan Analisis Usaha Tani - Jakarta : Penebar Swadaya. Dewi Kusumawardani, 2003. Efisiensi Ekonomi Realtif
dan Analisis Pendapatan Usahatani Tembakau Berdasarkan System Penguasaan Lahan sawah di Kabupaten Temanggung. TesisMIESP Undip Semarang.
Deakin Simon, Hughes Alan. 1999, Economic Efficiency and The Proceduralisation of Company Law. ESRC Centre for Bussiness Research, Cambridge No. 133
Gujarati,D.,2003. Basic Econometrics. FourthEdition.InternationalEdition.Singapore: Mc Graw-Hill.
Hasan Basri Tarmizi dan Gunawan Sumodiningrat, 1989, Pengaruh Penggunaan Faktor Produksi
Terhadap Produksi, Pendapatan dan
Distribusinya Pada Sawah Berpengairan dan
Tanpa Pengairan, BerkalaPenelitian Pasca
Sarjana Universitas Gajah Mada (BPPS~UGM), Jilid 2, No 2A, Edisi 1989, halaman 359 ~375. Indah Susantun, 2000. Fungsi Keuntungan Cobb
Douglas dalam Perdagangan Efisiensi Ekonomi Relatif. Jurnal Ekonomi Pembangunan Vol.5 No.2, hal 149 – 161.
Budi Setiawan, Avi, Sucihatiningsih, DWP.(2011). Analisis Efisiensi Penggunaan Faktor-faktor Produksi Usaha Tani Jagung di Kabupaten
Grobogan Tahun 2008. JEJAK Journal of Economics and Policy,4(1), 69-75.
Kusumawardhani, 2002, Efisiensi Ekonomi Usahatani Kubis (Di Kecamatan Bumaji, Kabupaten Malang), Agro Ekonomi Vol. 9 No. 1 Juni 2002.Jurusan Sosial Ekonomi Pertanian Fakultas Pertanian UGM.
Mahabubul A, Gazi. 2009. The Role of Agriculture
Education and Training on Agriculture
Economics and national Development of Bangladesh. African Journal of Agricultural Research Vol. 4 (12), pp. 1334-1350.
Masood A, Muhammad. 2015. Agriculture sector performance: An analysis through the role of agriculture Sector share in GDP. Journal of Agricultural Economics, Extension and Rural Development: ISSN-2360-798X, Vol. 3(3): pp 270-275.
Miller, Roger LeRoy dan Roger E. Meiners, 2000, Teori Mikroekonomi Intermediate, penerjemah Haris Munandar, PT. Raja GrafindoPersada, Jakarta Soekartawi, 1993. Prinsip Dasar Ekonomi Pertanian –
Teori dan Aplikasi, PT.Raja Grafindo, Jakarta. Soekartawi , 1995. Analisis Usahatani. Penerbit
Universitas Indonesia. Jakarta.
Soekartawi , 2000. Pembangunan Pertanian, Rajawali Press, Jakarta.
Soekartawi,2003a). Agribisnis, Teori dan Aplikasinya, Cetakan Ketujuh, Jakarta : PT. Raja Grafindo Persada
Soekartawi, 2003b). Teori Ekonomi Produksi, dengan Pokok Bahasan Analisis Fungsi Cobb-Douglass, Cetakan Ketiga, Jakarta : PT. Raja Grafindo Persada.
Sudjana, 1996. Metode Statistika. Penerbit Tarsito , Bandung.
Sugianto, T, 1985, Production Efficiency of Caulifloer at Citarum, West Java,Indonesia, Jurnal Agro Ekonomi, No. 2. FE UGM. Yogyakarta.
Susantun,2000,Fungsi Keuntungan Cobb-Douglas dalam pendugaan efisiensi ekonomi relatif, Jurnal Ekonomi Pembangunan.