p-ISSN: 2086-0382; e-ISSN: 2477-3344
Modelling Multi Input Transfer Function for Rainfall Forecasting in Batu City
Priska Arindya Purnama, Ni Wayan Surya Wardhani, Rahma Fitriani
Department of Statistics, Brawijaya University, Malang
Email: [email protected], [email protected], [email protected]
ABSTRACT
The aim of this research is to obtain the appropriate transfer function to model rainfall data in Batu City and to figure out how accurate the results of rainfall forecasting in Batu City using the transfer function model based on air temperature, humidity, wind speed and cloud. Transfer function model is a multivariate time series model which consists of an output series (Yt) sequence expected to be affected by an input series (Xt) and other inputs in a group called a noise series (Nt). Air temperature, humidity, wind speed and cloud are used as an input series (Xt) and rainfall as an output series (Yt). Multi input transfer function model obtained is (𝑏1, 𝑠1, 𝑟1) (𝑏2, 𝑠2, 𝑟2) (𝑏3, 𝑠3, 𝑟3) (𝑏4, 𝑠4, 𝑟4) (𝑝𝑛,𝑞𝑛) = (0,0,0) (23,0,0) (1,2,0) (0,0,0) ([5,8],2) and shows that rainfall on a certain day is affected by air temperature and cloud on that day, air humidity in the previous 23 days and wind speed in the previous day. The results of rainfall forecasting in Batu City using multi input with single output transfer function model is accurate based on the result of model validation using 𝑡 test and MAPE statistic that less than 20%.
Keywords: multi input transfer function model, rainfall, forecasting
INTRODUCTION
Time series analysis is a data analysis considering the effect of time. Time series or time series data is a sequence of observations taken sequentially based on time with the same interval, ie daily, weekly, monthly, yearly or other time periods [1]. The modeling in time series analysis is classified into two, ie univariate and multivariate. One univariate time series model is Autoregressive Integrated Moving Average (ARIMA), whereas one multivariate time series model is a transfer function model. The transfer function model consists of an output series (Yt) that is
influenced by the input series (Xt) and other inputs combined in a group called the noise series
(Nt) [2]. The transfer function model combines several characteristics of the univariate ARIMA
model and multiple regression analysis or combines time series analysis with a causal approach. The purpose of modeling the transfer function is to establish a simple model that can connect the output series (Yt) with the input series (Xt) and the noise series (Nt).
ARIMA. In addition Thomakos and Geurard [5] who examined unemployment forecasting in St. Louis United States showed that the transfer function model is better when compared to the naive model and ARIMA.
Rainfall data information becomes an important thing that affects the agricultural output to determine the beginning of the growing season. One of the areas in East Java Province that has potential in the agricultural sector is Batu City, so it is important to link rainfall with the agricultural sector in Batu City. The agricultural sector is a leading sector which is expected to synergize with other sectors such as tourism, trade and industry [6] .Some factors that can affect rainfall are air temperature, humidity, wind speed and cloud [7].
Some previous research on rainfall forecasting is done by Faulina [8] about comparison of accuracy of ensemble ARIMA in Batu City and Tresnawati, et. al. [9] examined the Kalman Filter method with SST Nino 3.4 predictors in Purbalingga. Research of rainfall forecasting on preceding still has a weakness that only involves one variable. While research that has been done by Badan Meteorologi, Klimatologi dan Geofisika (BMKG) in rainfall forecasting uses ensemble method (combination of individual method using concept of merging some forecasting model) and BMA (Bayesian Model Averaging) modelling but the forecasting rarely gives the accurate results. Therefore, in this research will discuss rainfall forecasting involving more than one variable.
Air temperature, humidity, wind speed and clouds can be used to model and forecast rainfall using the transfer function model. In this study, rainfall is a response variable (output series), while air temperature, air humidity, wind speed and cloud are predictor variables (input series). The transfer function model used in this research is called the multi-input transfer function model, because the predictor variable or input series is used more than one variable (input). The existence of factors that affect the rainfall as a predictor variable (input series) is expected to provide accurate forecasting results.
FUNDAMENTAL THEORIES
The steps of formation of the transfer function model consists of five steps, namely prewhitening process of input series and output series, identification of impulse response function and transfer function, identification of noise model, prediction and testing of parameter significance of transfer function model, and diagnostic test of transfer function model [10].
Prior to the prewhitening process, the first step is to prepare the input series and the output series. In this preparation step, the identification of time series plots, stationarity test and ARIMA modeling of input series and output series is conducted. Stationarity test consists of two parts, namely stationary to the variance and the mean. Stationarity test against variance can be seen from the Box-Cox plot and the value of λ. The data is said to be stationary to the range if the
value of λ is equal to or near 1. The non-stationary time series data can be overcome by doing the Box-Cox transformation. While the stationarity test against the mean can be seen from the autocorrelation plot (ACF). The stationary data on the mean on the ACF plot will not be significant after the second or third lag. Time series data that is not stationary to the mean can be overcome by differencing to become a stationary series. After obtaining a stationary series then the next step is to identify the ARIMA model in the input sequence. The identification of ARIMA model is performed on time series data which has been stationary to the variance and the mean by looking at ACF and PACF plots. The ARIMA model will be used in the prewhitening process of the input series and output series.
The first step of identification of the impulse response function and transfer function is the calculation phase of cross correlation and the autocorrelation of the input series and the prewhitened output series. The cross correlation function (CCF) of the input series xt and the output series yt between the k-lags is expressed by 𝜌𝑥𝑦(𝑘) = γxy(k)
σx σy [10]. The second step is the direct
Determining the value of b, r, s can be done by identifying the cross-correlation values of the sample or by directly estimating the weight of the impulse response.
The phase identification model of noise series consists of two steps, the first is the initial estimate of the noise series (nt) declared 𝑛̂𝑡 = 𝑦𝑡−𝜔̂ (𝐵)
𝛿̂(𝐵)𝐵𝑏𝑥𝑡 [10] and the second is the ARIMA
modeling (pn,0,qn) for the noise series (nt).
The estimation of transfer function model parameters used maximum likelihood method and significance test of transfer function model parameters using t test statistic.
The last formation step of the transfer function model is the diagnostic test of the transfer function model which is done by testing the remaining autocorrelation and cross-correlation test (CCF) between the input and the batch input series using the Ljung-Box (Q) test statistic.
Multi-input transfer function model with single output is formulated as follows:
𝑦𝑡 = ∑ 𝜈𝑗(𝐵)𝑥𝑗𝑡
This research used daily secondary data of rainfall (𝑌𝑡), air temperature (𝑋1𝑡), humidity (𝑋2𝑡), wind speed (𝑋3𝑡) and cloud (𝑋4𝑡) in Batu City obtained from the web www.worldweatheronline.com. Daily data for the period of January 2016-December 2016 was used as training data to form a multi-input transfer function model. While the daily data for January 2017 period was used as data testing for model validation.
Figure 1. (a) Time series plot of rainfall (b) Time series plot of air temperature (c) Time series plot of humidity (d) Time series plot of wind speed (e) Time series plot of cloud
Based on the time series plot each input series and the output series indicated that the rainfall, air temperature, humidity, wind speed and cloud daily throughout the year 2016 has a pattern up and down and does not show the trend pattern. The stationarity test results to the variance indicated that each input series and output series are not stationary, which is shown by the Box-Cox plot and the λ values of each input and output series are not close to 1. Then, the Box-Cox transformation is done for each the input series and the output series. While the results of stationary test against the mean indicated by ACF and PACF plots also showed that each input series and output series has not been stationary to the mean. Therefore, differencing is done once for each of input and output series so it becomes stationary. Furthermore, the results of ARIMA model identification for the input series obtained ARIMA (1,1,2) for the air temperature input series (𝑋1𝑡), ARIMA ([3,5,7],1,2) for air humidity input series (𝑋2𝑡), ARIMA (1,1,1) for wind speed input series (𝑋3𝑡) and ARIMA (6,1,1) for cloud input series (𝑋4𝑡).
Based on the ARIMA model obtained from each input series, it can be determined prewhitening model on each input series and output series, such as:
𝛼1𝑡 = 𝑥1𝑡− 0.26995𝑥1𝑡−1+ 0.63921𝛼1𝑡−1+ 0.21176𝑎1𝑡−2 (1) series, humidity, wind speed and cloud. The prewhitening model for the output series is the same as the input series, only 𝛼𝑗𝑡 and 𝑎𝑗𝑡 are replaced by 𝛽𝑗𝑡, 𝑥𝑗𝑡 is replaced by 𝑦𝑗𝑡 where j is the index of the input series.
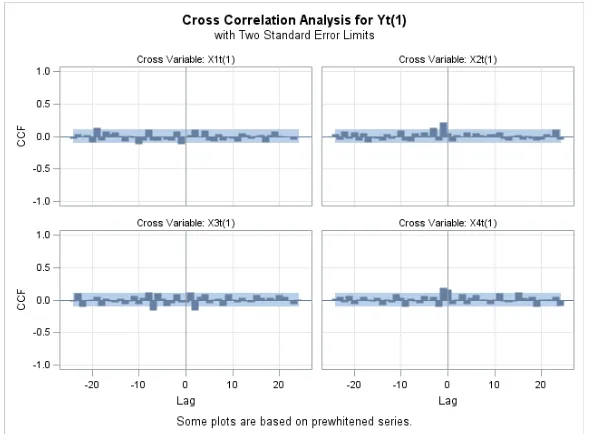
The results of the cross-correlation and the autocorrelation of the prewhitened input and output series are shown in the cross-correlation plot of each input air temperature, air humidity, wind speed, cloud series with prewhitened rainfall output are presented in Figure 2.
Figure 2. Crosscorrelation Plot of Prewhitened Input Series and Output Series
Based on the results of cross-correlation and the weight of the impulse response for each input series with prewhitened output series, it can be identified the values of b, s, r for each input series. The value of b, s, r for the air temperature input series and the rainfall output series are (b
= 0, s = 0, r = 0), for the humidity input series and the rainfall output series are (b = 23, s = 0, r = 0), while for the wind speed input series and the rainfall output series are (b = 1, s = 2, r = 0) and for the cloud input series and the rainfall output series are (b = 0, s = 0, r = 0).
The noise series model (𝑛𝑡) obtained based on the value of the impulse response weight is formulated as the following:
𝑛𝑡 = 𝑦𝑡− 𝑦̂ = 𝑦𝑡 𝑡− ∑ 𝑣̂ (𝐵)𝑥𝑗 𝑗𝑡 𝑘
𝑗=1
𝑛𝑡 = 𝑦𝑡− {(−0,1166)𝑥1𝑡+ ⋯ + (−0,8663)𝑥1𝑡−23} − {(0,1391)𝑥2𝑡+ ⋯ + (0,3001)𝑥2𝑡−23} − {(−0,2078)𝑥3𝑡+ ⋯ + (−0,4434)𝑥3𝑡−23}
− {(0,1681)𝑥4𝑡+ ⋯ + (0,0439)𝑥4𝑡−23}
Based on the equation we can get the value 𝑛24, 𝑛25, … , 𝑛365 where the value 𝑛1… 𝑛23 is set equal to zero. ARIMA model (𝑝𝑛, 0, 𝑞𝑛) for noise series (𝑛𝑡) is ARIMA ([5,8],0,2) and can be formulated
𝑛𝑡 =(1 + 0.72949𝐵 − 0.23092𝐵2(1 + 0.0378𝐵 − 0.9109𝐵− 0.06788𝐵3− 0.01765𝐵2)4+ 0.1179𝐵5+ 0.10773𝐵8) 𝑎𝑡
Table 1. Significance Test Results Parameter Multi Input Transfer Function Model
Input Series
Orde (B,S,R) Parameter Estimation T P-Value Conclusion
𝑿𝟏𝒕 b=0,s=0,r=0 𝜔01 0.1042 3.84 0.0089 Significant
𝑿𝟐𝒕 b=23,s=0,r=0 𝜔02 0.2459 2.03 0.0423 Significant
𝑿𝟑𝒕 b=1,s=2,r=0 𝜔03 0.4318 3.53 0.0180 Significant
𝑿𝟒𝒕 b=0,s=0,r=0 𝜔04 0.1992 4.12 <.0001 Significant
Table 1 shows that all parameters in the multi-input transfer function model are significant, this is based on the p-value of each parameter smaller than the value of α.
The diagnostic results of the multi-input transfer function model performed by testing the residual autocorrelation using the Ljung-Box test are shown below:
Table 2. Diagnostic Test Result of Multi Input Transfer Function Model
Multi Input Transfer Function Model
Lag Chi-Square P-Value Conclusion
(𝒃𝟏, 𝒔𝟏, 𝒓𝟏) (𝒃𝟐, 𝒔𝟐, 𝒓𝟐) (𝒃𝟑, 𝒔𝟑, 𝒓𝟑) (𝒃𝟒, 𝒔𝟒, 𝒓𝟒)
(𝒑𝒏,𝒒𝒏) = (0,0,0) (23,0,0) (1,2,0) (0,0,0)
([5,8],2)
12 2.80 0.5921 Fit
18 7.12 0.7142
24 9.66 0.8840
Based on the Ljung-Box test, a model is said to be feasible if the whole lag of a model yields a
p-value greater than α = 0.05. The result of model test using Ljung-Box test stated that the multi input transfer function model with single output is feasible to use.
So the model of multi input transfer function with single output for rainfall forecasting in Batu City stated
𝑦𝑡 = 0.10418𝑥1𝑡+ 0.24597𝑥2𝑡−23+ 0.43178𝑥3𝑡−1+ 0.19916𝑥4𝑡+ 𝑛𝑡
The model shows that rainfall on a certain day is affected by air temperature and cloud on that day, air humidity in the previous 23 days and wind speed in the previous day.
The precision of forecasting was measured by calculating the MAPE (Mean Absolute Percentage Error) statistic. MAPE statistic for testing data was 16.35%. The results of model validation using t paired test showed that the value of forecasting with actual value was not significantly different.
CONCLUSION
REFERENCES
[1] G. Box, G. Jenkins dan J. Reisel, Time Series Analysis Forecasting and Control, 4th penyunt., New Jersey: Wiley, 2015.
[2] S. Makridakis dan S. W. a. V. McGee, Metode dan Aplikasi Peramalan, 2nd penyunt., Jakarta: Erlangga, 1988.
[3] C. D. Tankersley, G. W. D dan H. K, “Comparison of Univariate and Transfer Function Models of Groundwater Fluctuations,” Water Resources Research, no. 29, pp. 3517-3533, 1993.
[4] P. Edlurd dan K. S, “Forecasting The Swedish Unemployment Rate VAR vs Transfer Function Modelling,” International Journal of Forecasting, no. 9, pp. 61-76, 1995.
[5] D. D. Thomakos dan G. J. B, “Naive, ARIMA, Nonparametric, Transfer Function and VAR Models: A Comparison of Forecasting Performance,” International Journal of Forecasting, no. 20, pp. 53-67, 2004. [6] BPS Kota Batu, Kota Batu dalam Angka, Batu: BPS Kota Batu, 2015.
[7] E. Wilson, Hidrologi Teknik, 4th penyunt., Jakarta: Erlangga, 1993.
[8] R. Faulina, “Perbandingan Akurasi Ensemble ARIMA dalam Peramalan Curah Hujan di Kota Batu, Malang, Jawa Timur,” Jurnal Matematika, Sains dan Teknologi, no. 15, pp. 75-83, 2014.
[9] R. Tresnawati, T. A. Nuraini dan W. Hanggoro, “Prediksi Curah Hujan Bulanan Menggunakan Metode Kalman Filter dengan Prediktor SST Nino 3.4 Diprediksi,” Jurnal Meteorologi dan Geofisika, no. 11, pp. 108-119, 2010.