© The Author 2013. Published by Oxford University Press on behalf of the American Association for Public Opinion Research. All rights reserved. For permissions, please e-mail: [email protected]
Using MP3 Players in sUrveys
The ImpacT of a Low-Tech SeLf-admInISTraTIon
mode on reporTIng of SenSITIve aTTITudeS
SImon chauchard*
abstract This article introduces an inexpensive, low-tech
audio-Self-administered Questionnaire that uses a basic mp3 player (mp3/aSaQ) and compares its performance in collecting data about sensitive attitudes with a number of alternatives, including a face-to-face survey. The paper compares five administration procedures in an experiment conducted in a survey on sensitive caste-related attitudes in rural India. respondents in the mp3/aSaQ group listened to a prerecorded instrument that presented them with a number of first-person statements made by “respondents like [them],” entered their responses on an answer sheet using simple shapes and logos, and finally placed their form in a bolted ballot box. Like previ-ous studies evaluating self-administration techniques, our study indicates that the mp3/aSaQ significantly increased socially undesirable answers, as compared with an equivalent face-to-face interview. comparisons with additional administration procedures suggest that when self-administra-tion is combined with the use of earphones the threat of bystander disap-proval (as opposed to interviewer disapproval) is reduced by effectively isolating respondents from their social environment.
introduction
Self-interviewing, particularly in its modern form (computer-assisted self-interviewing, or caSI), has emerged as an efficient way to limit underreport-ing of sensitive attitudes and behaviors. numerous studies have demonstrated the effectiveness of video- and audio-caSI in increasing reports of risky behaviors (o’reilly et al. 1994; Tourangeau and Smith 1996; Turner et al.
Simon chauchard is an assistant professor of government at dartmouth college, hanover, nh, uSa. he thanks Shankare gowda, martin gilens, don green, eric dickson, Kanchan chandra, Lynn vavreck, deborah Brooks, and three anonymous reviewers for feedback on the design and the presentation of this project. *address correspondence to Simon chauchard, department of government, dartmouth college, 211 Silsby hall, hB 6108, hanover, nh 03755, uSa;
e-mail: [email protected].
doi:10.1093/poq/nfs060
by guest on May 21, 2015
http://poq.oxfordjournals.org/
1998; for a more recent example, see Brener et al. 2006). over the past dec-ade, these findings have largely been extended to telephone acaSI systems (Turner et al. 1996; gribble et al. 2000; moskowitz 2004; villarroel et al. 2006). In addition, at least one study (harmon et al. 2009) has shown that the benefits of self-administration extend to sensitive attitudes.
despite this, many surveys that include sensitive questions do not employ self-interviewing methods. This may be due to cost or other reasons. Self-interviewing may require a degree of literacy that some respondents do not possess. while acaSI methodologies might help with literacy problems, technology-reliant survey modes come with their own set of issues. In some settings, technology attracts unwanted attention, and hence reduces the privacy of survey participants. In addition, many research teams throughout the world still do not have the technological skills necessary to produce a caSI survey.
This article introduces the mp3/aSaQ methodology, a self-administered questionnaire that incorporates audio using an mp3 player.1 This significantly cheaper, simpler, and more discrete administration mode (compared to caSI) does not require that respondents be literate and hence minimizes the con-cerns listed above. after introducing the mp3/aSaQ methodology, this article shows that the mp3/aSaQ methodology retains the most important advantage of other self-administered methodologies: a beneficial impact on reporting.
The rest of this article presents results from an experiment showing how the mp3/aSaQ methodology increases reporting of socially undesirable attitudes and isolates the causal mechanisms driving this reduction. finally, the article discusses the implications of these findings.
The MP3/asaQ Methodology
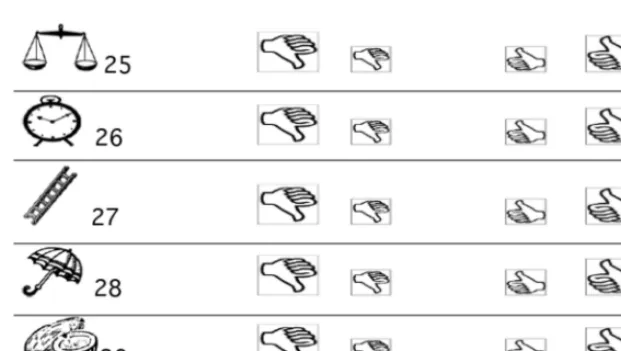
with the mp3/aSaQ methodology, respondents react privately to statements made by “villagers like [them] in earlier conversations with the research team.” In order to record their reactions to statements they hear through earphones, respondents mark an answer sheet, using simple shapes.2 The answer sheet provides a line for each question in the audio survey, and each line presents respondents with various response choices. The prerecorded voice explains how and where to answer. respondents tick one of the shapes on each line; if they do not know what to answer or refuse to answer, they do not tick anything and move on to the next line. In order for illiterate respondents to identify the line associated with each question, a logo is affixed to every statement. after each statement, the prerecorded voice asks: “how much do you agree with
1. This technology is very similar to the “walkman” technology developed by camburn,
cynamon, and harel (1991).
2. The instrument is a succession of recordings alternating with five-second-long silences, a length that was determined through a pilot test to maximize respondents’ ability to respond while avoid-ing fatigue.
by guest on May 21, 2015
http://poq.oxfordjournals.org/
what this villager said? please answer in front of the [scale or clock] symbol.” an excerpt from the answer sheet is depicted in figure 1.
Because instructions from the interviewer—and from the prerecorded voice itself—detail what each “thumb” means (clearly disagree, somewhat disagree, somewhat agree, clearly agree), most respondents have no problem in responding.
In this methodology, interviewers play a minimal role: after training respondents, they push the “play” button and wait away from the respond-ent until the recorded instrumrespond-ent has finished. at the end of the recording, the voice says, “Your interview is now over. please ask your interviewer to return. If you have missed any questions, please ask him to replay them for you.” If respondents ask to have a question repeated, interviewers use the “skip forward” function to do so.3 respondents deposit their completed answer sheet in a bolted ballot box to enhance privacy (Lowndes et al. 2012).
The impact of the MP3/asaQ Methodology on reporting
of sensitive attitudes: an experiment
In order to assess whether and how this methodology affects reporting of socially undesirable attitudes, the mp3/aSaQ was compared to other admin-istration procedures.
3. This methodology does not allow the respondent to repeat questions, which may be seen as a significant limitation in comparison to acaSI. however, in this study, respondents asked to have a question replayed in fewer than 5 percent of the cases.
Figure 1. The answer sheet.
by guest on May 21, 2015
http://poq.oxfordjournals.org/
conTexT
comparisons of administration procedures took place in a survey on untouch-ability-related attitudes in India. “untouchability” refers to the system of dom-ination through which certain castes (formerly called the “untouchables,” now legally referred to as the Scheduled castes) are discriminated against in most social activities. despite the continuing prevalence of untouchability, research-ers interviewing villagresearch-ers often face denial about its existence. for the purpose of this study, therefore, reports of openly negative or discriminatory attitudes toward members of these castes were considered “socially undesirable.”
STudY deSIgn
To test the impact of the mp3/aSaQ on reporting, this study first compared the propensity with which respondents reported these socially undesirable atti-tudes using the mp3/aSaQ procedure with the propensity with which they reported them in a comparable face-to-face interview.
The face-to-face instrument, which presented questions in the same order as the audio instrument, differed in several important ways. while the “state-ments” used were identical, respondents were asked: “many people say: ‘statement X’; how much do you agree with that?” instead of being asked to react to statements “made by villagers like [them] in conversations with the research team.”4 In addition, no ballot boxes were used; responses were read by the interviewer, who recorded them on paper.5
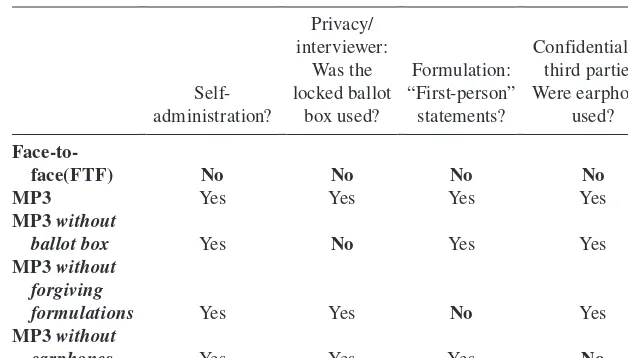
Three additional interview procedures—each of which deliberately omitted one of the features of the mp3/aSaQ methodology—were compared with the mp3/aSaQ procedure in order to isolate the mechanisms through which that procedure might increase reporting of sensitive attitudes (see table 1). first, to assess whether reporting was driven by concerns about interviewer disap-proval, a group of respondents used the mp3/aSaQ, but handed their answer sheets to the interviewer instead of placing them in a ballot box. Second, to assess whether endorsement by fictitious fellow villagers encouraged the dis-closure of undesirable attitudes, a variation of the mp3/aSaQ procedure was run in which respondents heard questions of the type “many people say that ‘statement X.’ how much do you agree with that?” instead of being presented with statements “made by villagers like [them].” Third, to assess whether reporting was driven by concerns about bystander disapproval, surveys were administered but earphones were replaced by mini-speakers, so that poten-tial bystanders could listen to the instrument. altogether, five different data- collection procedures were examined.
4. note that slightly different statements (“many people” vs. “villagers like you”) could affect responses.
5. This administration mode was thus pen-and-paper interviewing (papI) rather than computer-assisted personal interviewing (capI).
by guest on May 21, 2015
http://poq.oxfordjournals.org/
Surveys were administered to villagers from all middle and upper castes in eleven villages of rajsamand and five villages of Jaipur districts, in the state of rajasthan, in June 2009. a systematic sample of households was drawn. upon being assigned to a specific area, interviewers attempted to interview a member of every nth house (the n number depended on village, caste, and area size). within each house, interviewers interviewed the “first available male.”
assignment to experimental treatments was done as follows: all data-collection procedures were used in all villages. each day of fieldwork, inter-viewers were assigned two different administration procedures and alternated between them. respondents were contacted at their homes and informed of the administration procedure after the usual assurances of confidentiality had been issued, and they had agreed to participate.
a total of 455 interviews were completed, of which 439 were analyzed in this study.6 The cooperation rate was comparable among respondents in the self-administered and face-to-face modes: 75.6 and 73.7 percent,7 respectively. Table 1. summary of the Characteristics of the Five administration Procedures
face(FTF) no no no no
MP3 Yes Yes Yes Yes
MP3 without
ballot box Yes no Yes Yes
MP3 without forgiving
formulations Yes Yes no Yes
MP3 without
earphones Yes Yes Yes no
6. Supervisors re-contacted all respondents to ensure that interviewers had fully followed the experimental procedure. fourteen interviews were discarded because this had not been the case. In the course of this “re-contact,” ninety-one respondents were tested on the meaning of each “thumb”; two additional interviews were discarded, because the respondents could not identify the meaning of the thumbs.
7. while supervisors did not monitor the number of households in which no one answered or no male was present, they did measure “refusals to participate.” Subsequently, these percentages were calculated using the counts of refusals (which includes those target respondents who com-pleted only a subset of the survey) and the count of comcom-pleted interviews.
by guest on May 21, 2015
http://poq.oxfordjournals.org/
anaLYSeS and reSuLTS
To study the effect of administration mode on reports of socially undesirable attitudes, the statistic used in the study is the total number of hostile or discrim-inatory answers provided by each respondent in response to nineteen ques-tions (see appendix a). a response is considered socially undesirable when it lies at the extreme end of the four-point scale (that is, either a “clearly agree” response to a negative statement about members of the scheduled castes or a “clearly disagree” response to a positive statement). This statistic indicates the effect of the administration mode over the entire length of the questionnaire.
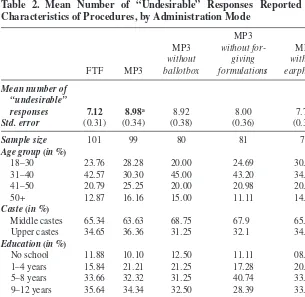
Table 2 reports the mean number of undesirable responses (out of a maxi-mum of nineteen) for each of the five administration modes. This analysis suggests that the mp3/aSaQ mode strongly increased reporting of socially undesirable attitudes: a t-test establishes a highly statistically significant dif-ference between the fTf and mp3 groups. results from the three “partial” mp3/aSaQ conditions suggest that this reduction stems from effective isola-tion from bystanders, as well as to more forgiving formulaisola-tions, but not to increased isolation from the interviewer himself.
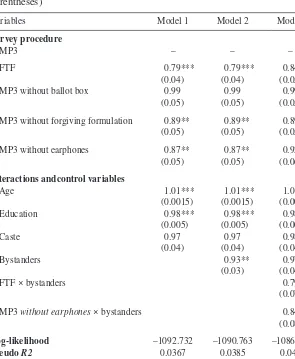
as shown in the lower rows of table 2, the characteristics of respondents across experimental groups differed only slightly. however, to ensure that demographic differences did not cause these results, multivariate analyses were run and are presented in table 3. Because of the nature of the depend-ent variable, negative binomial regressions—predicting the count of “socially undesirable” responses as a function of administration procedure and of key background characteristics, described in appendix a—were run. In all mod-els, the statistics reported are incidence-ratio rates (Irr), which indicate the incidence rate for a one-unit change in any given variable X. The coefficient corresponding to each procedure thus shows the estimated difference between that procedure and the baseline mp3/aSaQ procedure, which is the omitted category.
model 1 confirms that the mp3/aSaQ procedure strongly increased report-ing of sensitive attitudes. The number of undesirable responses given by vil-lagers who were interviewed face-to-face was only 79/100 of the number given by respondents who used the mp3/aSaQ with the forgiving statements.
model 1 also confirms the results of table 2 in suggesting why the mp3/ aSaQ procedure increases reporting of socially undesirable answers. The absence of a ballot box does not have any significant impact on counts of undesirable responses. conversely, a departure from statement-based ques-tions significantly decreased the number of undesirable attitudes respondents admitted holding, as did the replacement of earphone by mini-speakers. These results imply that both question formulation and isolation from bystanders drive the difference in means observed across the fTf group and the mp3 group in table 2. In addition, a comparison of the findings for the “mp3 with-out ballot box” group with the “mp3 withwith-out earphones” group suggests that
by guest on May 21, 2015
http://poq.oxfordjournals.org/
the fear of bystander disapproval is a more important cause of underreporting of sensitive attitudes than the fear of interviewer disapproval.
This intuition is confirmed when analyses include a control for the pres-ence of bystanders. In model 2, bystanders (a dummy variable accounting for the presence of bystanders, further described in appendix a) yields a signifi-cant and negative coefficient, which implies that the presence of bystanders decreased reporting of sensitive attitudes. Since this impact should be ampli-fied among the experimental groups in which respondents were not able to isolate themselves from others, model 3 includes interactions between this variable and administration procedures.
In this specification, the coefficient for bystanders is not significant, which implies that the impact of third-party presence is entirely conditional on respondents being interviewed without earphones (in other words, that the use Table 2. Mean number of “Undesirable” responses reported and Characteristics of Procedures, by administration Mode
fTf mp3
responses 7.12 8.98a 8.92 8.00 7.73
Std. error (0.31) (0.34) (0.38) (0.36) (0.34)
Sample size 101 99 80 81 78
Age group (in %)
18–30 23.76 28.28 20.00 24.69 30.76
31–40 42.57 30.30 45.00 43.20 34.61
41–50 20.79 25.25 20.00 20.98 20.51
50+ 12.87 16.16 15.00 11.11 14.10
Caste (in %)
middle castes 65.34 63.63 68.75 67.9 65.38
upper castes 34.65 36.36 31.25 32.1 34.62
Education (in %)
no school 11.88 10.10 12.50 11.11 08.97
1–4 years 15.84 21.21 21.25 17.28 20.25
5–8 years 33.66 32.32 31.25 40.74 33.33
9–12 years 35.64 34.34 32.50 28.39 33.33
12 years+ 02.97 02.02 00.00 02.46 03.84
note.—The variables used in this table are described more extensively in appendix a.
aa t-test establishes that the difference between mean of fTf group and mp3 group is > 0 at
the 0.000 level.
by guest on May 21, 2015
http://poq.oxfordjournals.org/
of earphones is effective in reducing the influence of third parties). The fact that the Irrs on both interaction terms are significant and less than one is evi-dence of this explanation, in conjunction with the fact that the main effect on mp3 without earphones (accounting in this regression for those mp3/aSaQ interviews that took place without earphones and without bystanders) is not significant.
Table 3. negative Binomial regressions of the Count of “socially Undesirable” responses on administration Procedures and Background
Characteristics (coefficients are incidence-rate ratios with standard errors in
parentheses)
variables model 1 model 2 model 3
survey procedure
mp3 without ballot box 0.99
(0.05)
0.99 (0.05)
0.99 (0.05)
mp3 without forgiving formulation 0.89** (0.05)
0.89** (0.05)
0.89** (0.05)
mp3 without earphones 0.87**
(0.05)
education 0.98*** 0.98*** 0.98***
(0.005) (0.005) (0.005)
mp3 without earphones× bystanders 0.84*
(0.08)
log-likelihood –1092.732 –1090.763 –1086.630
Pseudo R2 0.0367 0.0385 0.0421
N 439 439 439
note.—all results were checked using poisson models and included robust standard errors.
*p < .05, **p < .01, ***p < .001
by guest on May 21, 2015
http://poq.oxfordjournals.org/
although replacing earphones with mini-speakers yields more desirable answers when others are present, this effect disappears when respondents are alone. By delivering questions over headphones without displaying them on a screen, the mp3/aSaQ methodology increases reporting of socially undesir-able attitudes by erasing the potential influence of bystanders.
Discussion
This research admittedly took place in conditions that are, for many research-ers, unusual. what, then, are the implications for external validity?
This study rarely allowed for interviews to take place in isolation from others (the houses visited were small, and fewer than 50 percent of them had windows or doors that could be shut). add to this the large size of households, the fact that bystanders often did not belong to the respond-ent’s own household (they often were neighbors), and the difficulty of conveying the need for privacy to the respondent, and these results may be more easily explainable.8 Because survey researchers are often unable to guarantee the isolation of respondents, making low-tech and inexpen-sive self-administered methods available to survey researchers working in such settings constitutes an important step toward the production of better survey data.
These results also carry broader implications for researchers. first, these results first provide additional evidence of the benefits of self-administered interviewing. when sensitive questions are asked, isolation from others (whether interviewers or bystanders) tends to increase reporting of sensitive attitudes. This conclusion extends to the simpler, significantly cheaper,9 more discreet, and less cognitively demanding methodology introduced in this study. Second, these results extend findings on bystanders’ influence on the report of sensitive behaviors (gfroerer 1985; aquilino 1993, 1997; aquilino, wright, and Supple 2000) to the study of sensitive attitudes. finally, because these results show that reporting may be affected by a threat of bystander disap-proval (as opposed to interviewer disapdisap-proval), they may encourage research-ers to investigate the impact of bystandresearch-ers on reporting in a larger variety of settings and to use administration procedures that fully isolate respondents from their social environment.
8. moreover, the absence of women in the sample—due to many husbands’ reticence to allow their spouse to be interviewed—implies that the study underestimates the effect of bystander disapproval. In gender-conservative rural rajasthan, it is indeed likely that the threat of bystander disapproval would be even larger among women.
9. The small-screen, unbranded mp3 players used in this study cost around $30 apiece. Such prices may constitute a substantial reduction in the cost of self-administered surveys, even com-pared to the cheapest computers currently available on the market.
by guest on May 21, 2015
http://poq.oxfordjournals.org/
appendix a. Questions and Measures
of the forty statement-based questions in the mp3/aSaQ, nineteen were about untouchability or about “members of the Scheduled castes” (one of the terms used in contemporary India to refer to the former “untouchables”). Twenty-one asked about other topics, including marriage, family life, the difference between life in villages and in cities, technological change in the village, and “development.” The nineteen statements were adapted from a series of open-ended interviews in which raw statements were modified to reflect “positive” (as in members of the scheduled castes should have the same rights) or “nega-tive” views (as in members of the scheduled castes should NOT have the same rights) about caste members. Because respondents are hypothesized to be more likely to agree than to disagree with a given statement, we presented respond-ents with both negative and positive views about members of “untouchable” castes. The following nineteen statements were used in the study:
1. “If a member of the Scheduled Castes becomes sarpanch, he will only take care of other SCs.”
2. “Members of the Scheduled Castes are usually unable to do a good job as sarpanch. They do not have the skills for that.”
3. “Members of the Scheduled Castes are able to serve as politicians such as MLAs or MPs.”
4. “Members of the Scheduled Castes do not have ideas on how the vil-lage should be run.”
5. “Members of the Scheduled Castes and other SC castes are not like other social groups in the village; they are completely different and should not get the same respect.”
6. “Members of the Scheduled Castes stand much lower than others in the hierarchy of groups.”
7. “Members of the Scheduled Castes cannot think for themselves; they usually prefer being dominated by members of higher castes.”
8. “Members of the Scheduled Castes usually have low confidence.” 9. “Members of the Scheduled Castes are not as intelligent as other
villagers.”
10. “Members of the Scheduled Castes are not as hardworking as other villagers.”
11. “It is really unfair that members of the Scheduled Castes receive so much help from the government.”
12. “The authorities and the media should stop constantly portraying SCs as victims.”
13. “SCs are right to be unhappy about their condition; I understand their demands.”
14. “It is their fault if members of the Scheduled Castes are backward today.”
by guest on May 21, 2015
http://poq.oxfordjournals.org/
15. “SCs think they can do whatever they want nowadays.”
16. “I think SCs should feel free to parade in the village when there is a marriage in their community.”
17. “SCs should be allowed to drink from the same glasses/plates as other folks.”
18. “SCs should not be allowed to come to the upper-caste hamlet and interact with upper castes.”
19. “SCs should feel free to enter village temples.”
Background variables used in the analyses reported in table 2 can be described as follows:
Age: self-reported count, in years (the variable Age group in table 2 simply summarizes these data).
Level of education: self-reported count of completed years of school. Caste: self-reported dichotomous variable coded 1 (versus 0) when respond-ents report belonging to upper castes versus “middle” or “other backward” castes.
These variables were included as controls insofar as they are often described as predictors of caste-related attitudes, with older, less educated, and upper-caste respondents usually seen as holding more antagonistic attitudes.
In addition, the dichotomous variable bystanders was included in some analyses to control for the social environment of the interview. Bystanders is a dichotomous variable coded 1 when a bystander (of either gender and above twelve years of age) was present in the same room as the respondent for more than thirty continuous seconds during the interview, and 0 otherwise. This variable was coded based on a report by the interviewer.
references
aquilino, william S. 1993. “effects of Spouse presence during the Interview on Survey responses
concerning marriage.” Public Opinion Quarterly 57:358–376.
———. 1997. “privacy effects on Self-reported drug use: Interactions with Survey mode
and respondent characteristics.” In The Validity of Self-Reported Drug Use: Improving
the Accuracy of Survey Estimates, edited by L. harrison and a. hughes, 383–415. national Institute on drug abuse research monograph 167. washington, dc: national Institutes of health, department of health and human Services.
aquilino, william S., debra L. wright, and andrew J. Supple. 2000. “response effects due to Bystander presence in caSI and paper-and-pencil Surveys of drug use and alcohol use.”
Substance Use and Misuse 35:845–867.
Brener, nancy d., danice K. eaton, Laura Kann, Jo anne grunbaum, Lori a. gross, Tonja m. Kyle, and James g. ross. 2006. “The association of Survey Setting and mode with Self-reported
health risk Behaviors among high School Students.” Public Opinion Quarterly 70:354–374.
camburn, d., m. cynamon, and Y. harel. 1991. “The use of audio Tapes and written Questionnaires to ask Sensitive Questions during household Interviews.” paper presented at the national field directors/field Technologies conference, San diego.
gfroerer, Joseph. 1985. “Influence of privacy on Self-reported drug use by Youths.” In
Self-Report Methods of Estimating Drug Use: Meeting Current Challenges to Validity, edited by
by guest on May 21, 2015
http://poq.oxfordjournals.org/
B. a. rouse, n. J. Kozel, and L. g. richards, 22–30. dhhS publication no. (adm) 85–1402. rockville, md: national Institute on drug abuse.
gribble, James n., heather g. miller, philip c. cooley, Joseph a. catania, Lance pollack, and charles f. Turner. 2000. “The Impact of T-acaSI Interviewing on reported drug use among
men who have Sex with men.” Substance Use and Misuse 35:869–890.
harmon, Thomas, charles f. Turner, Susan m. rogers, elizabeth eggleston, anthony m. roman, maria a. villarroel, James r. chromy, Laxminarayana ganapathi, and Sheping Li. 2009.
“Impact of T-acaSI on Survey measurements of Subjective phenomena.” Public Opinion
Quarterly 73:255–280.
Lowndes, catherine m., a. a. Jayachandran, pradeep Banandur, Banadakoppa m. ramesh, reynold washington, B. m. Sangameshwar, Stephen moses, James Blanchard, and michel alary. 2012. “polling Booth Surveys: a novel approach for reducing Social
desirability Bias in hIv-related Behavioral Surveys in resource-poor Settings.” AIDS and
Behavior 16:1054–1062.
moskowitz, Joel m. 2004. “assessment of cigarette Smoking and Smoking Susceptibility among Youth: Telephone computer-assisted Self-Interviews versus computer-assisted Telephone
Interviews.” Public Opinion Quarterly 68:565–587.
o’reilly, James m., michael L. hubbard, Judith T. Lessler, paul p. Biemer, and charles f. Turner. 1994. “audio and video computer assisted Self-Interviewing: preliminary Tests of new
Technologies for data collection.” Journal of Official Statistics 10:197–214.
Tourangeau, roger, and Tom w. Smith. 1996. “asking Sensitive Questions: The Impact of
data-collection mode Question format, and Question context.” Public Opinion Quarterly
60:275–304.
Turner, charles f., Barbara h. forsyth, James o’reilly, phillip c. cooley, Timothy K. Smith, Susan m. rogers, and heather g. miller. 1998. “automated Self-Interviewing and the Survey
measurement of Sensitive Behaviors.” In Computer-Assisted Survey Information Collection,
edited by m. p. couper, r. p. Baker, J. Bethlehem, c. Z. f. clark, J. martin, w. L. nicholls, and J. m. o’reilly, 455–473. new York: wiley.
Turner, charles f., heather g. miller, Timothy K. Smith, philip c. cooley, and Susan m. rogers. 1996. “Telephone audio computer-assisted Self-Interviewing (T-acaSI) and Survey
measurements of Sensitive Behaviors: preliminary results.” In Survey and Statistical
Computing, 1996: Proceedings of the Second ASC International Conference, edited by r. Banks, J. fairgrieve, L. gerrard, T. orchard, c. payne, and a. westlake, 121–30. chesham, uK: association for Survey computing.
villarroel, maria a., charles f. Turner, elizabeth e. eggleston, alia al-Tayyib, Susan m. rogers, anthony m. roman, philip c. cooley, and harper gordek. 2006. “Same-gender Sex in the
united States: Impact of T-acaSI on prevalence estimates.” Public Opinion Quarterly
70:166–196.
by guest on May 21, 2015
http://poq.oxfordjournals.org/